Abstract
A total of 90% of follicular lymphomas (FLs) harbor the translocation t(14;18) leading to deregulated BCL2 expression. Conversely, 10% of FLs lack the t(14;18), and the majority of these FLs do not express BCL2. The molecular features of t(14;18)–negative FLs remain largely unknown. We performed microRNA expression analysis in 32 FL grades 1 to 3A, including 17 t(14;18)–positive FLs, 9 t(14;18)–negative FLs without BCL2 expression, and 6 t(14;18)–negative FLs with BCL2 expression. MicroRNA profiles were correlated with corresponding mRNA expression patterns, and potential targets were investigated by quantitative PCR and immunohistochemistry in an independent validation series of 83 FLs. Statistical analysis identified 17 microRNAs that were differentially expressed between t(14;18)–positive FLs and t(14;18)–negative FLs. The down-regulation of miR-16, miR-26a, miR-101, miR-29c, and miR138 in the t(14;18)-negative FL subset was associated with profound mRNA expression changes of potential target genes involving cell cycle control, apoptosis, and B-cell differentiation. miR-16 target CHEK1 showed increased expression in t(14;18)-negative FLs, whereas TCL1A expression was reduced, in line with a partial loss of the germinal center B-cell phenotype in this FL subset. In conclusion, t(14;18)–negative FL have distinct microRNA profiles that are associated with an increased proliferative capacity and a “late” germinal center B-cell phenotype.
Introduction
Follicular lymphoma (FL) constitutes the second most common B-cell malignancy among B-cell non-Hodgkin lymphomas (B-NHLs).1 It is considered an indolent lymphoma with a median overall survival of 8 to 10 years, but with an upward trend toward even further increased survival times because of more recent, improved treatment regimens.2,3 FL is currently viewed as a germinal center (GC) B-cell derived lymphoma. Its origin in the GC influences the molecular characteristics but is also reflected at the morphologic level, as FL usually forms atypical follicles that in many aspects mimic their physiologic counterparts and typically express GC-associated B-cell markers, such as CD10, BCL6, and IRF-8.1 Approximately 90% of FLs carry the translocation t(14;18)(q32;q21), leading to deregulated and aberrant expression of the antiapoptotic protein BCL2. Even with advanced, high-resolution techniques, however, a molecular rearrangement of the BCL2 gene cannot be detected in 10% of FLs,4,5 raising the question of whether these cases belong to the biologic spectrum of “conventional” FLs. It is unclear whether they differ in their clinical behavior and whether these lymphomas display pathogenetic features equivalent to BCL2 deregulation in t(14;18)–positive FLs. Such molecular events in t(14;18)–negative FLs, however, have not been identified as of yet.
We and others4,6,7 have previously investigated the morphologic and molecular features of t(14;18)–negative FLs. Current evidence suggests that these lymphomas share many morphologic, genetic, and molecular characteristics with their t(14;18)–positive counterparts that would not justify a diagnosis other than FL (eg, marginal zone lymphoma) according to currently established WHO guidelines. In this study, we performed microRNA (miR) profiling of t(14;18)–negative FLs to further characterize this FL subgroup on the molecular level and to substantiate findings previously derived from gene expression profiling experiments. miR are transcriptional and translational inhibitors with important functions in physiologic cellular processes, but there is increasing evidence that they also play a pivotal role in the oncogenic evolution in many types of cancer.8 In FLs, data on miR profiles are scarce,9,10 and t(14;18)–negative FLs have not been characterized yet. We here show that t(14;18)–negative FLs have distinct miR expression profiles that are in support of a late GC B-cell phenotype and that may be associated with particular biologic properties of this FL subset, such as an increased proliferative capacity of the tumor cells.
Methods
Lymphoma specimens and study cohorts
A total of 32 FLs grades 1 to 3A were selected from an FL series with available mRNA expression profiles previously published by the Lymphoma and Leukemia Molecular Profiling Project.11 The BCL2 translocation and protein status of these cases had been evaluated in our previous study using the BCL2 break-apart probe from Vysis (Abbot) and the clone 124 from Dako Denmark.4 The present study cohort includes 17 t(14;18)–positive FLs, 9 t(14;18)–negative FLs without BCL2 protein expression, and 6 t(14;18)–negative FLs with BCL2 protein expression. The validation cohorts are mentioned in the corresponding material and methods sections. The study was approved by the Ethics Committee of the Medical Faculty, University of Würzburg.
miR analysis
Total RNA was extracted from 20-μm sections of formalin-fixed, paraffin-embedded (FFPE) tumor tissues according to the manufacturer's instructions of the RecoverALL kit (Ambion/Applied Biosystems), followed by reverse transcription (starting amount of RNA ∼ 240 ng/μL) and preamplification using human megaplex primer pools. The cDNA of each tumor was applied to the TaqMan Human A + B miR cards (Applied Biosystems), allowing for the quantitative measurement of 667 miRs per sample. The fluidic cards were run on the 7900HT Fast Real-Time PCR system using the SDS Version 2.4 software (Applied Biosystems).
Validation experiments (quantitative PCR) were performed on an ABI PRISM 7000 Sequence Detection System using single TaqMan MicroRNA Assays (hsa-miR-101, hsa-miR-138, hsa-miR-26a, hsa-miR-29c, hsa-miR-16, and hsa-miR-922) and an endogenous control (U6-snoRNA; Applied Biosystems) and the 7000 System Software Version 1.2.3. The entire validation cohort of FL cases [42 t(14;18)–positive (37 grades 1 and 2, 5 grade 3A), 34 t(14;18)–negative without BCL2 expression (33 grades 1 and 2, 1 grade 3A), 7 t(14;18)–negative with BCL2 expression (all grades 1 and 2)] was randomly selected from the files of the lymph node pathology reference center Würzburg between the years 1991 to 2007 and enriched for FLs that lacked the translocation t(14;18) by conventional karyotyping, which were negative for BCL2 expression and that had sufficient FFPE material available for the study, as described in our previous publication.4 For quantitative PCR analysis, 17 t(14;18)–negative FLs without BCL2 expression and 25 t(14;18)–positive FLs were selected. For in vitro experiments, the diffuse large B-cell lymphoma (DLBCL) cell lines HLY1 and SUDHL6 and the Burkitt lymphoma cell line Daudi were used.
Immunohistochemistry
Immunohistochemistry for the proteins CHEK1, CDK6, HDGF, and TCL1 was performed on the previously published FL validation series, including 42 t(14;18)–positive FLs and 41 t(14;18)–negative FLs.4 CHEK1 (rabbit monoclonal antibody EP691Y; Abcam) was used in a dilution of 1:100 (Tris; pH 9.0), CDK6 was stained using the rabbit polyclonal antibody (Santa Cruz Biotechnology) in a dilution of 1:2000 (citrate buffer, pH 6.0), HDGF was detected using the mouse monoclonal antibody 26C2a (Abcam) in a dilution of 1:50 (Tris, pH 6.1), and TCL1A was detected using the clone 1-21 (Cell Signaling; 1:10 000, citrate buffer, pH 6.0). CHEK1 and CDK6 expression was evaluated semiquantitatively (< 5% of tumor cells, low expression; 5%-15% of tumor cells, medium expression; > 15% of tumor cells, high expression).
PCR and Sanger sequencing
PCR amplification of the EZH2 gene was performed on genomic DNA isolated from paraffin-embedded FL cases using the RecoverAll kit from Ambion. PCR and sequencing were performed using standard PCR (100 ng genomic DNA, 1.5mM MgCl2, 0.2 pmol primer, 250μM dNTPs, 0.4 U Taq polymerase) and sequencing protocols (0.16 pmol primer, 2 μL sequencing mix [Applied Biosystems], 10 ng DNA) and the primers EZH2_015R3 and EZH2_015F that were published by Morin et al.12 The study cohort for this approach included 7 t(14;18)–positive and 7 t(14;18)–negative FLs without BCL2 expression obtained from the files of the Institute of Pathology, University of Würzburg, Germany and the Department of Pathology.
FISH
FISH was performed on whole slices of FFPE tissue using break-apart probes for the BCL2 gene locus (Abbot) as described previously.13 In the context of this study, we refer to the cases with a BCL2 breakpoint as t(14;18)–positive FLs because the t(2;18) and t(18;22) are only rare events. For evaluation the signal constellation of 100 randomly selected cells was analyzed with a Zeiss Axioskop2 microscope (Carl Zeiss) using a cut-off of 8% as determined by FISH experiments in reactive tissues.
Statistical evaluation
Ct values that were generated on the 7900HT Fast Real-Time PCR system (Applied Biosystems) were adjusted manually for each miR using the RQ Manager Version 1.2.1 (Applied Biosystems) and were then applied to all samples. Evaluation of the Ct values that were generated on the ABI PRISM 7000 Sequence Detection System was performed using a threshold of 0.2 and an auto baseline as recommended by the supplier. For the evaluation of the ΔΔ Ct value, U6 alone, or in combination with RNU24, RNU43, RNU44, and RNU48, was used as endogenous control, and the group of t(14;18)–positive FLs was chosen as calibrator.
The miR profiles of t(14;18)–positive and t(14;18)–negative FL subgroups were compared using the Geometric Mean algorithm from DataAssist Version 2.0 (Applied Biosystems) and the ANOVA approach by Partek Genomics Suite. Ct values up to 40 were included. Pair-wise correlation of miR and mRNA data were performed using the combining approach and the Spearman correlation algorithm of the Partek GS 6.5 software. Gene expression data were available from a previous publication.11 Another correlation between miR and mRNA data were performed using a combinatorial approach, including DataAssist Version 2.0, TargetScan Version 5 (http://www.targetscan.org), Microsoft Excel, and Microsoft Access. The Gene Set Enrichment Analysis (GSEA) annotation tool (Broad Institute; http://www.broadinstitute.org/gsea/msigdb/annotate.jsp) was used for the inverse correlation of gene expression with potential miR candidates. For this approach, a 2-sided t test was performed between t(14;18)–positive and t(14;18)–negative cases. Subsequently, genes were entered into the GSEA database and annotated for miRs that were found to be differentially expressed by a P < .001. The GSEA tool was also used to annotate the genes that were found to be significantly inversely correlated with gene expression to gene families.
Immunohistochemical results were evaluated by a χ2 statistic using the SPSS Version 16 software (IBM).
Results
MicroRNA expression differs between t(14;18)–positive and t(14;18)–negative FLs
Using the human miR-cards from Applied Biosystems, 440 of 667 (66%) of miRs could be detected on average with a threshold (Ct) of less than 40.
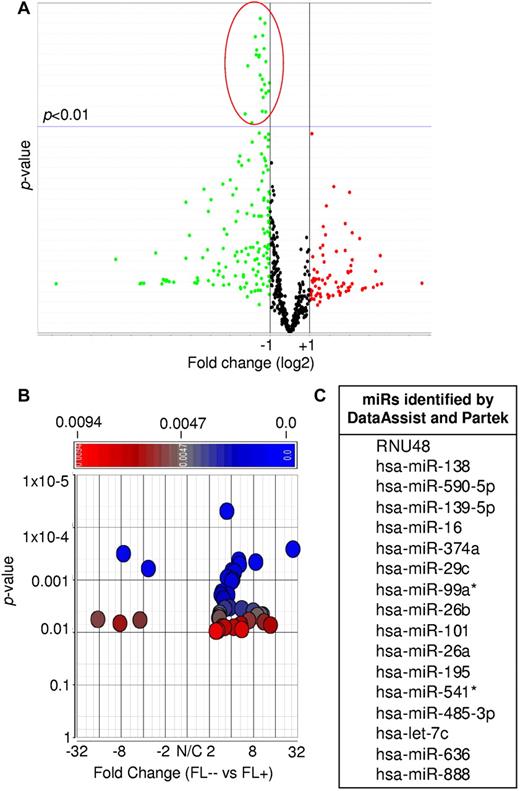
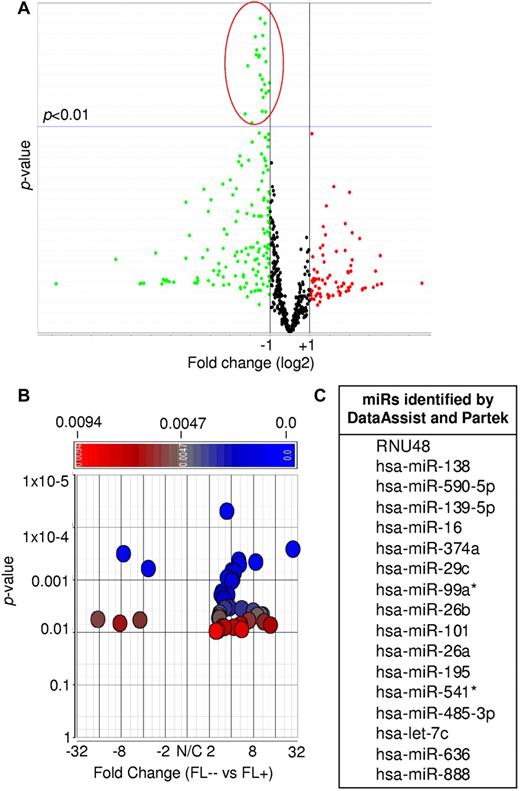
By comparing 17 t(14;18)–positive and 9 t(14;18)–negative FLs without BCL2 protein expression, we identified 24 and 40 miRs to be differentially expressed using the DataAssist and the Partek software, respectively (P < .01, Figure 1). In t(14;18)–negative FLs without BCL2 expression, all 24 miRs were down-regulated by DataAssist analysis (Figure 1A), whereas by Partek analysis 35 of the miRs were down-regulated and 5 were up-regulated (Figure 1B; supplemental Table 1, available on the Blood Web site; see the Supplemental Materials link at the top of the online article). Seventeen miRs were found to be down-regulated in both statistical approaches in FLs lacking the t(14;18) (P < .01, Figure 1C; supplemental Table 1; supplemental Figure 1).
Differentially expressed miRs between t(14;18)–positive (FL+) and t(14;18)–negative FLs without BCL2 expression (FL--). (A) DataAssist analysis using the geometric mean algorithm. FL+ was used as a calibrator. (B) Partek analysis using ANOVA. FL+ was used as a calibrator. (C) Differentially expressed miRs identified by both DataAssist and Partek.
Differentially expressed miRs between t(14;18)–positive (FL+) and t(14;18)–negative FLs without BCL2 expression (FL--). (A) DataAssist analysis using the geometric mean algorithm. FL+ was used as a calibrator. (B) Partek analysis using ANOVA. FL+ was used as a calibrator. (C) Differentially expressed miRs identified by both DataAssist and Partek.
Five miRs are associated with robust expression changes of potential mRNA targets
As miRs are known to inhibit mRNA expression on either the transcriptional or translational level, we correlated miR and mRNA expression profiles between the t(14;18)–positive and t(14;18)–negative FL subsets using 4 different analysis strategies. mRNA expression profiles were available from a previous publication.11
First, the combining approach by Partek revealed that 29 of 40 miRs were associated with mRNAs that were differentially expressed between t(14;18)–positive and t(14;18)–negative FLs (P < .001), of which 28 also showed an inverse correlation with some of their potential target genes (supplemental Table 2).
The Spearman correlation approach by Partek demonstrated a significant association between 27 of the 40 miRs and corresponding mRNA expression [23 down- and 4 up-regulated miRs in t(14;18)–negative FLs] with 22 of them also showing an inverse correlation with gene expression (P < .01). All 22 miRs were down-regulated in t(14;18)–negative FLs without BCL2 expression (supplemental Table 3). In a third approach, miRs that were differentially expressed using DataAssist were analyzed by a sequential application of the DataAssist Version 2.0 and TargetScan Version 5 software. This stringent analysis identified 11 of these 22 down-regulated miRs as being significantly and inversely associated with gene expression (Table 1). Notably, 7 of these 11 miRs were described in the literature to be expressed by B cells and to play a role in the regulation of the cell cycle, proliferation, apoptosis or were found to be differentially expressed between GCB and ABC DLBCL (detailed in Table 1).22,23 According to Partek/TargetScan, the expression of 119 genes was significantly inversely correlated with these 7 miRs, including the oncogenes GAS7, ETV1, MYCN, and TCF3, the kinases CDC42BPA, PRKG1, PRKAA2, ACVR2A, and CHEK1, and the cytokines HDGF, TNFSF9, SEMA3A, and CMTM4 (supplemental Table 4).
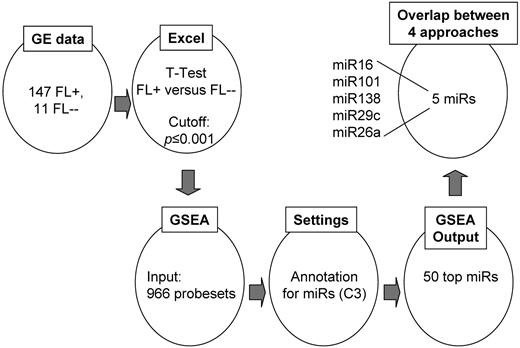
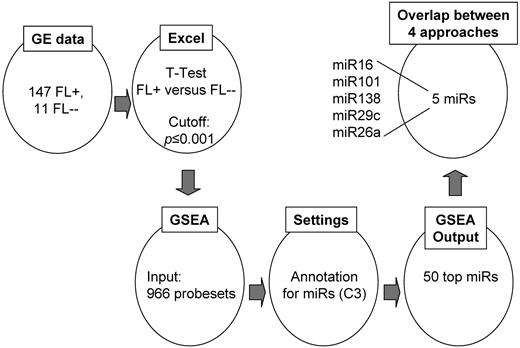
In a completely different approach (Figure 2), we started to compare mRNA expression levels between t(14;18)–positive and t(14;18)–negative FLs without BCL2 expression on a global scale and then used the GSEA miR annotation tool to search for mRNAs that are potentially regulated by miRs. Among the 7 miRs identified previously (Table 1), 5 were present in the top 50 list of this approach (Figure 2; supplemental Table 5). These include miR-101, miR-138, miR-29c, miR26a, and miR-16.
Inverse correlation approach using the GSEA annotation database. Genes that were differentially expressed between t(14;18)–negative FLs without BCL2 expression (FL--) and t(14;18)–positive FL (FL+) cases with a P value of ≤ .001 were entered into the GSEA annotation tool and then annotated for corresponding miRs. Among the top 50 miRs, we identified 5 miRs that were also detected by the Spearman correlation approach (Partek), the combining approach (Partek), and the DataAssist/TargetScan correlation approach. GE indicates gene expression.
Inverse correlation approach using the GSEA annotation database. Genes that were differentially expressed between t(14;18)–negative FLs without BCL2 expression (FL--) and t(14;18)–positive FL (FL+) cases with a P value of ≤ .001 were entered into the GSEA annotation tool and then annotated for corresponding miRs. Among the top 50 miRs, we identified 5 miRs that were also detected by the Spearman correlation approach (Partek), the combining approach (Partek), and the DataAssist/TargetScan correlation approach. GE indicates gene expression.
Taken together, the differential expression of 5 miRs between the t(14;18)–positive and t(14;18)–negative FL subgroups is associated with robust expression changes of potential mRNA targets, supporting the idea that they might be of relevance for biologic properties of these subgroups.
Down-regulation of miR-16 by quantitative PCR in an independent set of t(14;18)–negative FLs
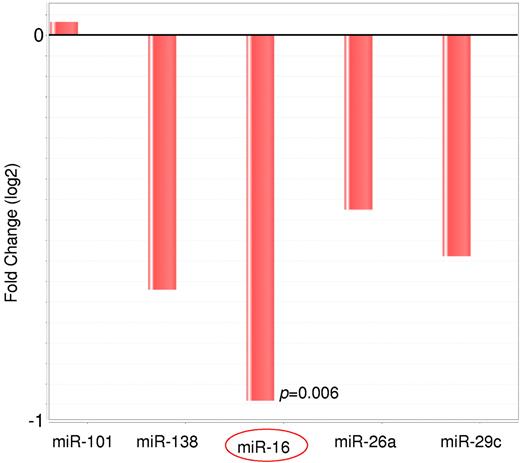
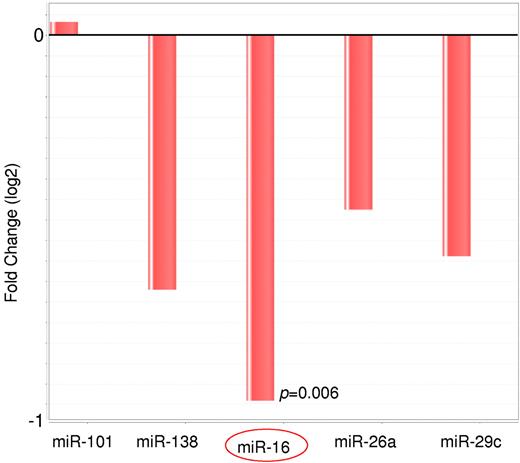
To validate our findings obtained in the global miR expression analysis, the expression status of the 5 most robustly differentially expressed miRs (miR-101, miR-138, miR-29c, miR26a, and miR-16) was investigated by quantitative PCR in an independent validation series that was composed of 17 t(14;18)–negative FLs without BCL2 expression and 25 t(14;18)–positive FL cases. The 17 t(14;18)–negative FLs without BCL2 expression showed low or absent CD10 expression and/or increased Ki67 staining according to previous findings.4 In this validation set, the expression level of miR-138, miR-29c, miR26a, and miR-16 was found to be reduced in t(14;18)–negative FLs, whereas the expression level of miR-101 showed no differential expression compared with t(14;18)–positive FLs using DataAssist analysis (Figure 3). The down-regulation of miR16 in t(14;18)–negative FL was statistically highly significant (P = .006).
Relative expression level of the miRs miR-101, miR-138, miR-16, miR-26a, and miR-29c in t(14;18)–negative FLs compared with t(14;18)–positive FLs as detected by quantitative RT-PCR. The expression level was determined in an independent FFPE validation set of 26 FLs without t(14;18) and 23 FLs with t(14;18). Four of the 5 miRs showed decreased expression in t(14;18)–negative FLs, and the difference was statistically significant for miR-16.
Relative expression level of the miRs miR-101, miR-138, miR-16, miR-26a, and miR-29c in t(14;18)–negative FLs compared with t(14;18)–positive FLs as detected by quantitative RT-PCR. The expression level was determined in an independent FFPE validation set of 26 FLs without t(14;18) and 23 FLs with t(14;18). Four of the 5 miRs showed decreased expression in t(14;18)–negative FLs, and the difference was statistically significant for miR-16.
Overexpression of the miR-16 target CHEK1 in t(14;18)–negative FLs
Given the important pathogenetic role of miR-16 in other hematologic malignancies, we investigated the expression status of 3 potential miR-16 targets on the protein level. Specifically, we performed immunohistochemistry for CDK6, HDGF, and CHEK1 in an independent validation series of 42 t(14;18)–positive FLs, 34 t(14;18)–negative FLs without BCL2 expression, and 7 t(14;18)-negative FLs with BCL2 expression.
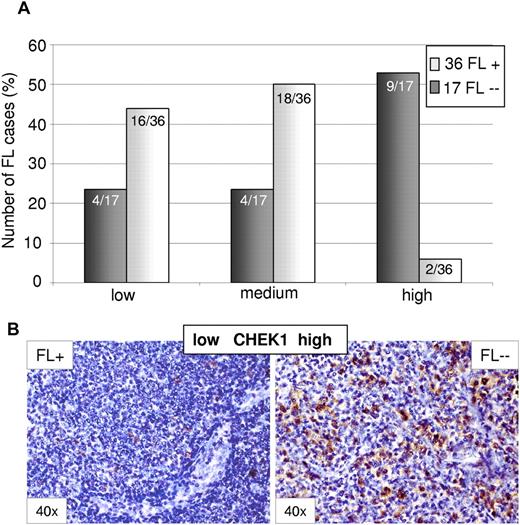
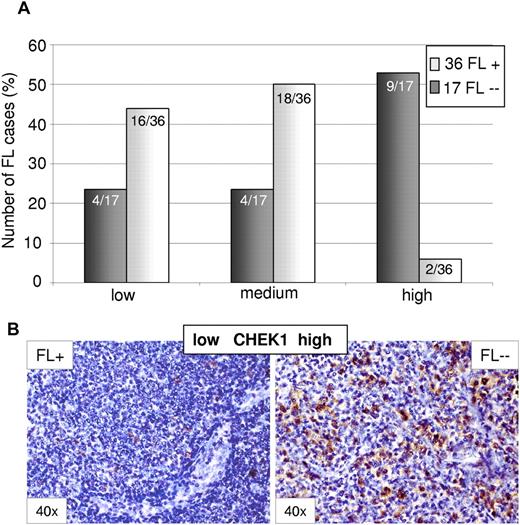
HDGF stained predominantly microvessels and only few lymphoid cells, the number of which did not differ between the 2 subgroups (data not shown). The expression of CDK6 and CHEK1 in the tumor cells ranged between 2% and 25% and was generally increased in t(14;18)–negative FLs. CHEK1 was highly expressed (> 15% of cells) in 42% of t(14;18)–negative cases, but only in 6% of t(14;18)–positive FLs (P ≤ .001, likelihood ratio, Figure 4). The differential expression of CHEK1 became even more prominent, with 53% of cases showing a high CHEK1 expression, when only t(14;18)–negative FL without BCL2 expression were considered. Because our validation set of FLs was predominantly composed of grade 1 and grade 2 FLs without any bias in the t(14;18)–positive and t(14;18)–negative FL subgroups, CHEK1 up-regulation may contribute to the pro-proliferative phenotype of t(14;18)–negative FL cells and might also confer antiapoptotic properties in FL cells that lack BCL2 expression.
Differential expression of the miR-16 target CHEK1 between t(14;18)–positive (FL+) and t(14;18)–negative FL (FL--) without BCL2 expression as detected by immunohistochemistry. (A) CHEK1 expression was increased in t(14;18)–negative FLs (P < .001, likelihood ratio). (B) Representative stainings for CHEK1 in FL+ and FL--. Images were captured using a Olympus, Color View, BX50 microscope, the Color View digital camera, and the analysis work soft imaging system (all Olympus).
Differential expression of the miR-16 target CHEK1 between t(14;18)–positive (FL+) and t(14;18)–negative FL (FL--) without BCL2 expression as detected by immunohistochemistry. (A) CHEK1 expression was increased in t(14;18)–negative FLs (P < .001, likelihood ratio). (B) Representative stainings for CHEK1 in FL+ and FL--. Images were captured using a Olympus, Color View, BX50 microscope, the Color View digital camera, and the analysis work soft imaging system (all Olympus).
Down-regulation of the GC marker TCL1 in t(14;18)–negative FLs
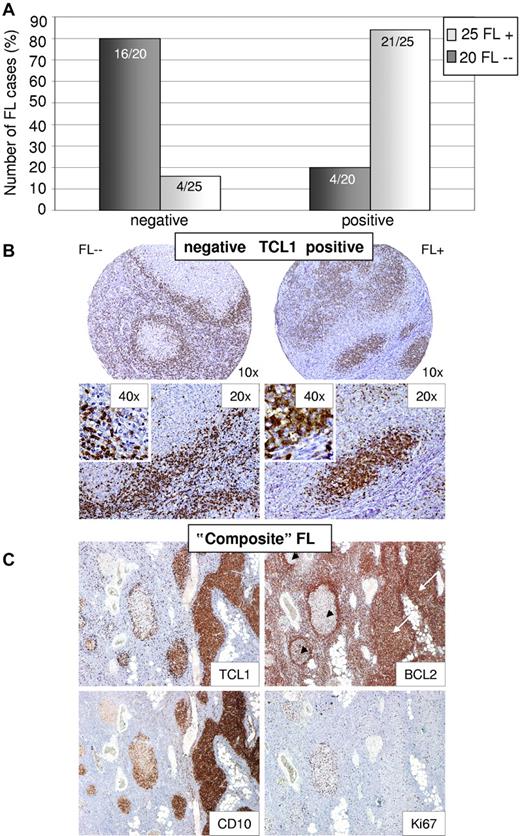
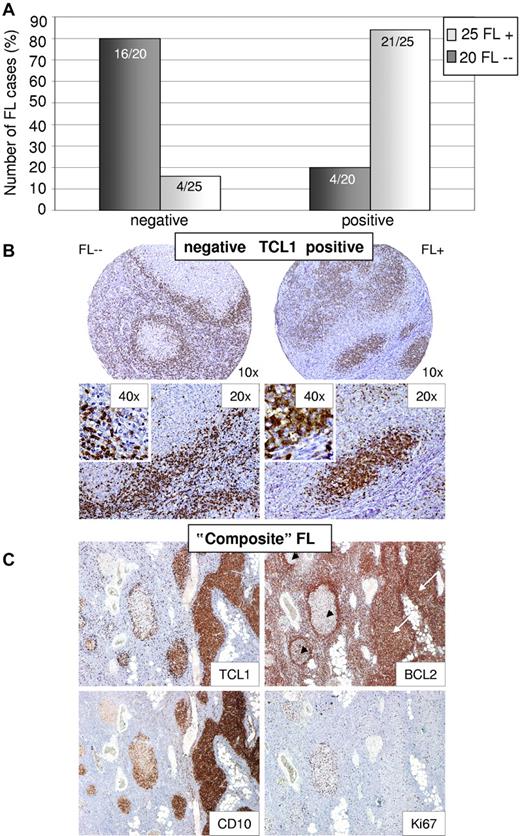
Only few miRs were more highly expressed in t(14;18)–negative FLs without BCL2 expression compared with the t(14;18)–positive counterparts. One of these was miR-922, which regulates TCL1B expression, according to the TargetScan database. In view of our observation that t(14;18)–negative FLs may show a phenotype of a “late” GC stage of B-cell differentiation4 and given that TCL1A is located in close proximity to TCL1B with high homology between the 2 proteins and similar expression patterns and was described to be expressed in naive and GC B cells, although it appears to be down-regulated in post-GC stages of B-cell differentiation, we decided to perform immunohistochemistry for TCL1A and not TCL1B in our FL validation set. In general, tumor cells in a given case were either negative for TCL1A expression or showed strong staining in the majority of cells, whereas only few cases showed weak and partial staining, which was considered positive. In t(14;18)–negative FLs, 67% of cases lacked TCL1A expression, and this percentage increased to 80%, when only t(14;18)–negative FLs without BCL2 protein expression were considered. In contrast, 84% of t(14;18)–positive FLs demonstrated TCL1A protein expression (P < .0001, Figure 5A-B). We noted a strong correlation between BCL2 and TCL1A expression, as 5 of 6 t(14;18)–negative but BCL2 protein–positive FLs also showed strong TCL1A expression (supplemental Figure 2). Circumstantial evidence for a potential biologic coregulation of these 2 proteins comes from a single t(14;18)–negative FL case composed of BCL2-positive and BCL2-negative atypical follicles in the same lymph node (Figure 5C). Interestingly, the BCL2-positive atypical follicles showed strong TCL1A expression, whereas BCL2-negative atypical follicles remained TCL1A-negative. Moreover, BCL2-negative atypical follicles showed decreased expression of CD10 and an increased proliferation, in line with our previous observations.4
Differential expression of TCL1 between t(14;18)–negative and BCL2-negative (FL--) and t(14;18)–positive FLs (FL+) as detected by immunohistochemistry. (A) TCL1 is absent in 80% of t(14;18)–negative FLs without BCL2 expression, whereas it is present in 84% of t(14;18)–positive FLs as shown by immunohistochemistry (P < .0001, Fisher Exact). (B) Representative stainings for TCL1 in FL+ and FL--. (C) “Composite” FL with BCL2-positive (white arrows) and BCL2-negative/BCL2-weak (black arrowheads) atypical follicles. Atypical follicles with BCL2 expression stain positive for TCL1, whereas in BCL2-negative follicles TCL1 expression is absent. Of note, BCL2-negative atypical follicles showed decreased CD10 expression and elevated proliferation (Ki67) compared with BCL2-positive atypical follicles. Images were captured using a Olympus, Color View, BX50 microscope, the Color View digital camera, and the analysis work soft imaging system (all Olympus).
Differential expression of TCL1 between t(14;18)–negative and BCL2-negative (FL--) and t(14;18)–positive FLs (FL+) as detected by immunohistochemistry. (A) TCL1 is absent in 80% of t(14;18)–negative FLs without BCL2 expression, whereas it is present in 84% of t(14;18)–positive FLs as shown by immunohistochemistry (P < .0001, Fisher Exact). (B) Representative stainings for TCL1 in FL+ and FL--. (C) “Composite” FL with BCL2-positive (white arrows) and BCL2-negative/BCL2-weak (black arrowheads) atypical follicles. Atypical follicles with BCL2 expression stain positive for TCL1, whereas in BCL2-negative follicles TCL1 expression is absent. Of note, BCL2-negative atypical follicles showed decreased CD10 expression and elevated proliferation (Ki67) compared with BCL2-positive atypical follicles. Images were captured using a Olympus, Color View, BX50 microscope, the Color View digital camera, and the analysis work soft imaging system (all Olympus).
In summary, BCL2 and TCL1A expression in FLs appears to be strongly correlated, and a decreased expression of TCL1A in t(14;18)–negative FLs without BCL2 expression supports our idea of a “late” GC B-cell phenotype of this FL subset.
Discussion
On the genetic level, 90% of FLs are characterized by the translocation t(14;18), leading to deregulated BCL2 expression that is thought to represent an early event in FL lymphomagenesis. Thus, 10% of FLs are t(14;18)–negative and the majority of these cases do not express BCL2. The molecular events triggering FL development in cases without t(14;18) remain largely unknown, although some of these FLs may harbor translocations of the BCL6 oncogene24 or display up-regulation of antiapoptotic proteins other than BCL2.7
Currently available evidence suggests that t(14;18)–negative FLs represent tumors within the biologic spectrum of FLs. Morphologically, t(14;18)–negative FL grades 1 to 3A were indistinguishable from their t(14;18)–positive counterparts, even after careful reevaluation by 3 independent experienced hematopathologists. They are composed of centrocytes with intermingled blasts, grow in atypical follicular structures without a prominent, neoplastic marginal zone proliferation, show expression of the GC-associated markers BCL6 and IRF8 in virtually all cases and CD10 expression in the majority of cases, and display gene expression profiles comparable with t(14;18)–positive FLs.4 In the present series, in addition, these FLs failed to show a prominent marginal zone proliferation or features of follicular colonization that might have suggested a diagnosis of a marginal zone B-cell lymphoma. Genetically, t(14;18)–negative FLs harbor, at least in part, alterations typical of other GC-derived lymphomas (eg, gains/alterations of 2p), whereas genomic imbalances characteristic of other B-cell lymphomas (eg, marginal zone lymphomas, trisomy 3, 7, and 18) appear to be lacking.4 On the other hand, t(14;18)–negative FLs also display distinct biologic features. Compared with t(14;18)–positive FLs, they rarely carry genetic gains of chromosome 18, whereas the proliferative index of the tumor cells is probably increased.4 Moreover, one-third of t(14;18)–negative cases were found to lack CD10 expression and 11% showed increased IRF4/MUM1 expression by immunohistochemistry, whereas all t(14;18)–positive FLs showed a high CD10 expression and no increase in IRF4/MUM1 expression.4 These findings, together with evidence from global gene expression profiles that are enriched for post-GC pathways including increased NF-κB signaling, suggest a molecular phenotype of a “late” GC B-cell for t(14;18)–negative FL.4
The miR profiles of t(14;18)–negative FL, established in this investigation, are well in line with our previous findings on the mRNA expression level. Seventeen miRs, which were differentially expressed between the 2 FL subgroups using 2 rigorous statistical approaches, all showed decreased expression in the t(14;18)–negative FL subset. This is of note, as miR profiling of normal stages of B-cell differentiation showed down-regulation of many miRs when GC B cells mature to plasma cells.23 It was speculated that, in the GC environment, miRs may be involved in regulating the intricate interaction between B cells and T cells or antigen-presenting cells, whereas less miR-mediated regulation might be required in a plasma cell.23 In any case, the down-regulation of a significant subset of miRs in t(14;18)–negative FL supports the notion that this FL subset shows a “late” GC B-cell phenotype.
Four statistical approaches identified 5 miRs (miR-101, miR-138, miR-16, miR-29c, and miR-26a) in t(14;18)–negative FLs that were differentially expressed and had associated mRNA expression changes of potential target genes. All of these miRs have been described to be expressed in B cells and are involved in cell cycle regulation, proliferation, and apoptosis or were found to be differentially expressed between the GC B-cell and the activated B-cell subtype of diffuse large B-cell lymphoma.9,15,16,18-20 Again, this suggests a partial loss of the GC B-cell phenotype in t(14;18)–negative FLs.
miR-101 was described as tumor suppressor and targets MCL1, which is an antiapoptotic member of the BCL2 family.19 Moreover, miR-101 and miR-26a were described to inhibit the expression of the polycomb group protein and methyl transferase EZH2 in different tumor entities.15,25-28
Because we also observed a significant up-regulation of EZH2 mRNA in t(14;18)–negative FLs without BCL2 expression in our previously published dataset of 158 FLs; and considering the recent evidence of EZH2 mutations in ∼ 7% of FLs that were shown to affect the enzymatic activity of EZH2,12 we thus additionally investigated the EZH2 Y641 mutation status in 7 t(14;18)–positive FL and 4 t(14;18)–negative FL without BCL2 expression. However, no EZH2 Y641 mutation was detected in any of the 11 FL cases. Thus, the increased EZH2 mRNA expression in t(14;18)–negative FL without BCL2 expression does not seem to be associated with EZH2 Y641 mutations, which is in line with previous findings that differences in EZH2 mRNA expression were not correlated with the presence of the mutation Y641.29
The miR-16 expression was significantly decreased in t(14;18)–negative FL in our series, and decreased expression could be confirmed by quantitative PCR analysis in a large, independent validation series of 17 t(14;18)–negative FLs without BCL2 expression and 25 t(14;18)–positive FL cases. We attempted to additionally validate this finding by an in situ approach using probes for miR-16 (Exiqon) in 9 t(14;18)–positive and 9 t(14;18)–negative FLs, but this approach turned out to be not sensitive enough to visualize 2-fold expression differences for miR-16, as detected by quantitative PCR (data not shown). Because a tumor suppressor role for this miR has been established recently in the B-cell lineage,16 particularly in the development of chronic lymphocytic leukemia, we investigated 3 potential targets of miR16, including CDK6, CHEK1, and HDGF by immunohistochemistry. The expression of CDK6 and CHEK1 ranged between 5% and 25% of tumor cells in FLs, and—in line with an elevated proliferation signature in t(14;18)–negative FLs—expression of both proteins was generally increased in this FL subset. Whereas CHEK1 protein expression was high (> 15% of cells) in 42% of t(14;18)–negative FLs, only 6% of t(14;18)–positive FLs showed high CHEK1 expression. Interestingly, the percentage of t(14;18)–negative FL cases with high CHEK1 expression was even increased in t(14;18)–negative FLs without BCL2 expression, namely, 53%. As in chronic lymphocytic leukemia,25 down-regulation of miR-16 and increased expression of its targets CHEK1 and CDK6 may contribute to the pro-proliferative phenotype of t(14;18)–negative FLs. Moreover, CHEK1 has also a role as an apoptosis inhibitor, and its down-regulation was shown to abrogate resistance to therapy in various cell line systems.30 Thus, CHEK1 might also confer antiapoptotic properties in t(14;18)–negative FLs that lack expression of the potent antiapoptotic protein BCL2. It is of note that ATM, which is part of the DNA damage signaling cascade and which directly regulates CHEK1, is usually down-regulated in physiologic GCs of healthy persons and GC derived tumors, such as GCB DLBCL and FL but up-regulated in plasma cells,31,32 except for very few FL cases that were reported to have an increased ATM expression, which was interestingly highly associated with a lack in CD10 expression.32 These FLs might therefore represent t(14;18)–negative FLs without BCL2 expression that have up-regulated ATM and, subsequently CHEK1, and down-regulated CD10 in support of a late GC phenotype.4,32 The functional proof of these hypotheses is difficult, however, given that no appropriate cell line or mouse models exist that represent FL in general or even the t(14;18)–negative FL subset.
Among few miRs that we found more highly expressed in t(14;18)–negative FLs was miR-922, which, according to the TargetScan database, targets the TCL1-family member TCL1B/TML1. Although little is known about the function and expression pattern of TCL1B, the TCL1A gene appeared of interest to us for several reasons. First, it is located 15 kb telomeric of TCL1B and shares a significant homology with TCL1B,33 and its expression is regulated during B-cell development with high expression in naive B cells, reduced expression in GC B cells, and absence in plasma cells.34 Although we failed to show that miR-922 targets TCL1A in various cell line experiments including in vitro knockdown of miR-922 in the Burkitt lymphoma cell line Daudi (data not shown), we observed an interesting expression pattern of TCL1A by immunohistochemistry. In t(14;18)–negative FLs, 67% of cases lacked TCL1A expression. When only t(14;18)–negative FLs were considered that also lacked BCL2 protein expression, this percentage increased to 80%, whereas 84% of t(14;18)–positive FLs showed TCL1A expression. Conversely, a high expression of TCL1A was observed in 83% of t(14;18)–negative FLs with BCL2 expression, suggesting a remarkable coordinated expression of TCL1A and BCL2 in FLs with both proteins either being coexpressed or absent. This observation is underlined by an anecdotal t(14;18)–negative FL case that harbored—in the same lymph node—BCL2-positive and BCL2-negative atypical follicles. Whereas the BCL2-positive but t(14;18)–negative follicles showed strong TCL1A expression, TCL1A was absent in the atypical follicles that were BCL2-negative. TCL1A has been demonstrated to serve as a coactivator of AKT promoting the activation of antiapoptotic molecules, such as BCL2 and MCL1.35,36 A direct regulatory relationship between BCL2 and TCL1A was also observed in a mixed series of NHL cases using ARACNE, an algorithm that reverse engineers a gene regulatory network from microarray gene expression data.37 Because in most FLs the expression of BCL2 is driven by a genetic event, the t(14;18), one could hypothesize that BCL2 expression in FLs influences TCL1A expression (eg, as part of a regulatory loop). As TCL1A was described to be down-regulated on plasma cell differentiation and as low levels of TCL1A were found to be associated with NF-κB and its associated pathways,34,37 a reduced expression of TCL1A in t(14;18)–negative FLs without BCL2 expression is in line with a late GC B-cell phenotype of this FL subset and suggests that t(14;18)–negative FL with BCL2 expression retain a “full” GC B-cell phenotype, as do most t(14;18)–positive FLs.
In conclusion, our study defines a specific miR expression profile for t(14;18)–negative FLs that mirrors findings derived from previous mRNA expression profiling, pointing to a molecular phenotype of the tumor cells that corresponds to a late GC B-cell. This deregulated miR expression may also contribute to some of the biologic features of this FL subset (eg, an increased proliferation rate of the tumor cells). Whether t(14;18)–negative FLs that should be regarded part of the spectrum of FLs for the time being behave different clinically will have to await further investigations in well-defined study cohorts of FL patients in prospective clinical trials.
The online version of this article contains a data supplement.
The publication costs of this article were defrayed in part by page charge payment. Therefore, and solely to indicate this fact, this article is hereby marked “advertisement” in accordance with 18 USC section 1734.
Acknowledgments
The authors thank all members of the Leukemia and Lymphoma Molecular Profiling Project who are not coauthors of this study as well as Tina Grieb and Theodora Nedeva for excellent technical assistance.
This work was supported by the National Cancer Institute Strategic Partnering to Evaluate Cancer (Signature grant UO1-CA 114778). E.L. was supported by the Deutsche Forschungsgemeinschaft. A.Z. was supported by the Associazione Italiana per la Ricerca sul Cancro. G.O. and H.H. were supported by Robert-Bosch-Stiftung. G.O. and A.R. were supported by the network project Molecular Mechanisms in Malignant Lymphomas (project M4) of the Deutsche Krebshilfe. L.H. is a researcher from Institut d'Investigacions Biomèdiques August Pi i Sunyer and was supported by the Spanish Ministry of Health and “programa d'estabilització d'investigadors” of Direcció d'Estrategia i Coordinació del Departament de Salut (Generalitat de Catalunya).
National Institutes of Health
Authorship
Contribution: E.L. designed and performed research, collected data, analyzed and interpreted the data, performed statistical analysis, and wrote the manuscript; A.Z., H.H., and E.H. performed research and collected, analyzed, and interpreted the data; B.P. performed statistical analysis and analyzed and interpreted the data; R.D.G., W.-C.C., R.M.B., L.M.R., D.D.W., J.D., E.S.J., J.F., L. M.S., H.-K.M.-H., and M.C. collected, analyzed, and interpreted the data; E.C. and G.O. designed research and collected, analyzed, and interpreted the data; L.H. designed and performed research, collected, analyzed, and interpreted the data, and performed statistical analysis; and A.R. designed research, collected, analyzed, and interpreted the data, and wrote the manuscript.
Conflict-of-interest disclosure: The authors declare no competing financial interests.
Correspondence: Andreas Rosenwald, Institute of Pathology, University of Würzburg, Josef-Schneider-Str 2, 97080 Würzburg, Germany; e-mail: rosenwald@mail.uni-wuerzburg.de.
References
Author notes
G.O., L.H., and A.R. contributed equally to this study as co-senior authors.

