Abstract
The forkhead box n1 (Foxn1) transcription factor is essential for thymic organogenesis during embryonic development; however, a functional role of Foxn1 in the postnatal thymus is less well understood. We developed Foxn1 transgenic mice (Foxn1Tg), in which overexpression of Foxn1 is driven by the human keratin-14 promoter. Expression of the Foxn1 transgene increased the endogenous Foxn1 levels. In aged mice, overexpression of Foxn1 in the thymus attenuated the decline in thymocyte numbers, prevented the decline in frequency of early thymic progenitors, and generated a higher number of signal joint TCR excised circle. Histologic studies revealed that structural alterations associated with thymic involution were diminished in aged Foxn1 Tg. Total numbers of EpCAM+ MHC II+ and MHC IIhi thymic epithelial cells were higher in young and old Foxn1Tg and more EpCAM+ MHC IIhi TEC expressed Ki-67 in aged Foxn1Tg compared with WT. Furthermore, Foxn1Tg displayed a significant reduction in the expansion of splenic CD4+ memory compartments and attenuated the decline in CD4+ and CD8+ naive compartments. Our data indicate that manipulation of Foxn1 expression in the thymus ameliorates thymopoiesis in aged mice and offer a strategy to combat the age-associated decline in naive T-cell production and CD4 naive/memory ratios in the elderly.
Introduction
It is well documented that aging negatively affects immune responses, leading to an increase in infection and mortality. Exactly how aging alters immune cell functions is not completely understood. Aging causes a decline in the production of naive T cells by the thymus; furthermore, intrinsic defects in mature T-cell functions, alterations in life span of naive T cells and in naive/memory T-cell ratios in the peripheral lymphoid tissues are documented.1,2 It is thought that these age-associated changes culminate the decline in T-cell responses in the elderly. Understanding the cellular and molecular mechanisms that govern these changes would lead to novel approaches and strategies that can be used to ameliorate T-cell functional decline and promote thymic output of naive T cells in the elderly.
In postnatal life, the thymus is the primary organ that produces naive TCRαβ T cells for the peripheral T-cell pool, albeit the production declines as early as 3 months of age.3 Thymic epithelial cells (TECs) are the primary cell type of thymic stroma, critically responsible for thymopoiesis.4 Functional maturation of TEC requires expression of the transcription factor forkhead box n1 (Foxn1); mutations in both mouse Foxn1 and human FOXN1 genes result in athymic and hairless conditions as seen in nude mice and patient with severe combined immunodeficiency syndrome.5,6 We previously showed that the decline in the expression of Foxn1 in thymic stroma correlates with the onset of reduction in thymocyte numbers and production of naive T cells as determined by the total number of signal joint TCR excised circle (sjTREC) in the thymus, suggesting that Foxn1 may play a role in age-associated thymic involution.3 Subsequent work by others demonstrated a role of Foxn1 in the cross-talk between TEC and developing thymocytes, which is required for thymopoiesis.7 Genetic approaches provide data to strengthen a supporting role of Foxn1 in thymopoiesis in the postnatal thymus, demonstrating that induced deletion of Foxn1 or reduced expression leads to premature thymic involution, whereas the presence of Foxn1+ TEC is essential for maintaining thymopoiesis.8-11 Hence, preventing the decline in Foxn1 expression in the context of aging could rescue age-associated thymic involution.
We used a transgenic (Tg) approach to generate Foxn1 overexpressing mice in which expression of Foxn1 is driven by the human keratin-14 (K14) promoter. We report here that thymic involution is attenuated as seen by the delay in the decline in thymopoiesis in aged Foxn1Tg compared with wild-type mice (WT). The attenuation in thymic involution reflects the intact thymic architecture, higher number of EpCAM+ cells, and higher levels of the early T lineage progenitors (ETPs) found in aged Foxn1Tg mice. In addition, the attenuation of thymic involution abated the decline in CD4+ and CD8+ naive compartments and prevented the age-associated expansion of the peripheral CD4+ memory T cell. Lastly, the finding that expression of Foxn1 can be up-regulated in the aged thymus suggests that strategies to reverse the decline in Foxn1 expression with advancing age can be used to ameliorate thymopoiesis and potentially improve immune responses in the elderly.
Methods
Foxn1Tg
The mouse Foxn1 cDNA fragment (2.1 kb) from nucleotide positions 78 to 2255 (NM_008238.1) was cloned into the BamH1 site of the human K14 promoter expressing cassette pG3ZK14 (K14-Foxn1; Dr Elaine Fuchs, Rockefeller University, New York, NY). The K14-Foxn1expression construct was sequenced to confirm the correct orientation and its open reading frame. The 5.5-kb NarI-VspI fragment of the K14-Foxn1 construct was used to generate Tg mice on the B6D2F1 background using standard protocol. Tg founders (lines 60 and 5) were first identified by southern blot analysis and subsequently by PCR analysis of tail genomic DNA using the Extract-N-AMP tissue PCR kit (Sigma-Aldrich). Tg founders were identified using primers specific for rabbit β-globin intron-Foxn1 (5′-end) and Foxn1-human K14 polyA (3′-end) junctions. Founders were backcrossed to the B6 background for 13 generations. Transgene copy numbers were determined by quantitative PCR using primers specific for exon 3 of Foxn1 gene. C57Bl/6 mice were purchased from Harlan or NIA and served as controls. All animal work was performed according to protocols approved by Loyola University Stritch School of Medicine Institutional Animal Care and Use Committee.
Quantification of Foxn1 mRNA levels in thymic stroma
Thymic stroma samples were obtained from young and old WT and Foxn1Tg by gentle teasing and repeatedly washing to remove thymocytes; total RNA was isolated using Trizol reagent (Sigma-Aldrich) according to the manufacturer's protocol. Isolated RNA was then treated with DNase using Ambion DNA-free kit and 0.5 to 2 μg of RNA was used for cDNA synthesis using the Invitrogen's SuperScript II synthesis kit. Quantitative RT-PCR was performed on an Applied Biosystems 7300 as previously described.3 To differentiate the expression levels of the endogenous and transgene Foxn1 in Foxn1 Tg mice, 2 sets of primer were designed. The first primer set recognize both the endogenous (Foxn1Endo) and the transgene (Foxn1Tg) Foxn1 transcripts; this primers set was used to determine the total levels of Foxn1 (Foxn1Total). The second primer set only detects the Foxn1 transgene (Foxn1Tg). The levels of endogenous Foxn1 mRNA were then calculated by subtracting Tg Foxn1 levels from total Foxn1 levels (Foxn1Endo = Foxn1Total − Foxn1Tg). Primer sequences are presented in Table 1. Samples were normalized to the housekeeping gene Gapdh. Levels of Foxn1 expression were extrapolated from a standard curve constructed with 5 known concentrations ranging from 10 copies/μL to 100 000 copies/μL. Levels of Foxn1 were expressed as copy numbers/μg RNA.
Immunofluorescence and H&E staining
Acetone-fixed frozen thymi sections (4-5 μm) in OCT media were used for immunofluorescent studies. Anti-Foxn1 antibody was raised in rabbits against a Foxn1 peptide (amino acid 303-324, exon 6). Sections were blocked with Super Block (ScyTek) and then incubated with either rabbit anti–mouse Foxn1 (IgG, 100-150 μg/mL), rabbit anti–mouse keratin 5 (0.1 μg/mL, Covance), rat anti–mouse keratin 8 (0.221 μg/mL, DSHB), rabbit IgG (Invitrogen), or rat IgG (BD Biosciences). Sections were then washed and incubated with goat anti–rabbit IgG-FITC, goat anti–rabbit IgG- AF488, or goat anti–rat IgG-AF546 F(ab)2′ (10 μg/mL; Invitrogen). Sections were analyzed using a Zeiss confocal LSM 510 microscope. For H&E staining, thymic tissues were fixed in formalin and then embedded in paraffin.
Flow cytometry
One million (1 × 10⁶) thymocytes from WT and Foxn1Tg were blocked with an anti-Fc receptor antibody CD16/32 and stained with a cocktail containing FITC-conjugated antibodies specific for lineage-positive markers CD3, CD8, B220, CD49b, CD11b, Gr-1, and Ter119. Thymocytes were then stained with anti–mouse CD117, CD25, CD44, and CD127. ETPs were identified as lin− CD117+ CD44hi CD25− CD127−, and the frequency of ETP was expressed as number of ETP/100 000 thymocytes. Thymic stromal cells were stained with CD45, EpCAM, MHC II, and Ly51, followed by fixation and permeabilization for Ki67 staining. Medullary thymic epithelial cells (mTECs) were identified as CD45− EpCAM+ Ly51− that were either MHC II+ or MHC IIhi. Total number of ETP and mTECs was calculated from the frequencies and total number of isolated thymocytes or thymic stromal cells. Flow cytometric data were analyzed using FlowJo Version 7.5.5 (TreeStar). Antibody information is summarized in Table 2.
Isolation of thymic stromal cells
Thymi were removed, injected with 0.05 mg/mL liberase (Roche Diagnostics), and incubated at room temperature for 8 minutes before dispersing by gentle teasing and pipetting. Digestion continued at 37°C for 35 minutes with the addition of DNAse (0.2 mg/mL), and thymic stromal cells were released mechanically and enriched using a 50% to 25% step Percoll (Sigma-Aldrich) gradient (unpublished protocol from T. D. Logan and A. Bhandoola, University of Pennsylvania).
Quantification of sjTREC, TCR-Dβ1, and TCR-Dβ2 germline levels
Genomic DNA from 1 × 10⁶ thymocytes was isolated using DNAzol (Invitrogen) according to the manufacturer's protocol. The sjTREC levels were determined by quantitative PCR using 80 ng of genomic DNA as previously described.3 The same amount of DNA was used to determine the levels of germline TCR-Dβ1 and Dβ2; primers specific for Dβ1 and Dβ2 were designed such that only the germline configurations of the 2 genes were detected while any DJ rearrangements result in the loss of the sequences specific for the reverse primers. Standard curves consisting of the following concentrations were used to calculate copy numbers of sjTREC, TCR-Dβ1, and TCR-Dβ2: 100 000, 10 000, 1000, 100, and 10 copies/μL. The levels of TCRCβ2 (exon 1) were used to normalize all samples. Primer sequences were presented in Table 1.
Results
Expression of Foxn1 in the thymus of Foxn1Tg mice
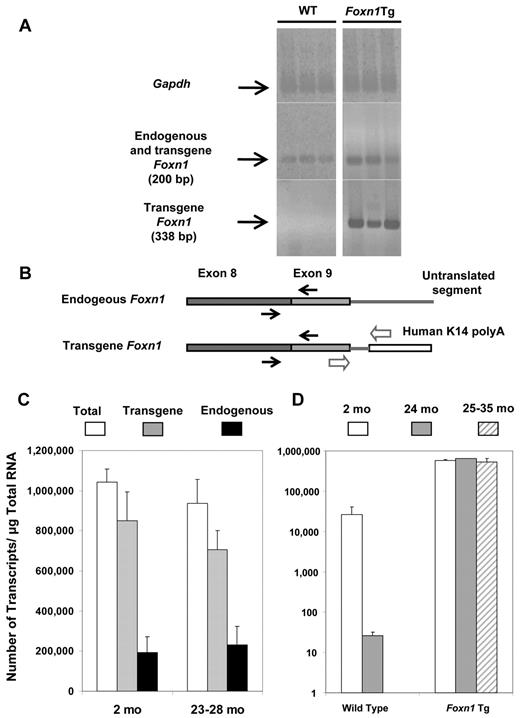
We determined that the homozygous Foxn1Tg line 5 has 10 to 12 copies and the Foxn1Tg line 60 has 4 or 5 copies of the transgene (data not shown). To determine the contribution of the endogenous and transgene Foxn1 expression in the 2 Tg lines, we designed primers specific only for the transgene Foxn1 and common primers that amplify both the transgene and endogenous Foxn1 transcripts. Figure 1A shows that the transgene-specific primers only detected Foxn1 mRNA in thymic stroma from Foxn1Tg whereas the common primers detected Foxn1 mRNA in both WT and Foxn1Tg thymic stroma. Figure 1B shows the relative positions of the 2 sets of primers within the endogenous and transgene Foxn1 transcripts. Expression of the transgene Foxn1 for the 2-month-old Tg line 60 was approximately 4-fold higher than the endogenous Foxn1; both endogenous and transgene levels were not changed with age (Figure 1C). In contrast, thymi from C57Bl/6 WT mice showed a 1000-fold reduction in expression of Foxn1 with age (Figure 1D), similar to our previous observations in BALB/c mice.3 The overall levels of expression of Foxn1 in the Foxn1Tg mice were 20-fold higher compared with that in young C57Bl/6 mice. Furthermore, the levels of Foxn1 expression in both Tg lines were similar and not reduced with age (Figure 1D). Interestingly, expression of endogenous Foxn1 in the 2-month-old Foxn1Tg is 7.2-fold higher than that found in the young WT mice (192 303 vs 26 628), suggesting that overexpression of the transgene induces expression of the endogenous Foxn1 (Figure 1C-D).
Quantification of endogenous and Tg Foxn1 expression by quantitative RT-PCR. (A) RT-PCR shows specificity of primers that detect both the endogenous and transgene Foxn1 and primers that only detect transgene Foxn1 transcripts. Each lane represents results from a WT or Foxn1Tg mouse (line 60). (B) Diagram showing the relative positions of the forward and reverse primers that detect either both endogenous and transgene (arrows) or only Tg (arrow outlines) Foxn1 transcripts. (C) Expression of the endogenous and transgene Foxn1 in 2-month-old (n = 3) and 23- to 28-month-old (n = 3) Tg line (line 60). The numbers of transcripts per microgram of total RNA were calculated from a standard curve after normalization with the mouse housekeeping gene Gapdh; each sample was performed in triplicates. The endogenous Foxn1 levels were determined by subtracting the total Foxn1 (endogenous plus transgene) from that of the transgene. White bars represent the total Foxn1 levels; gray bars, Tg Foxn1; and black bars, endogenous Foxn1. Errors bars represent SD. (D) Expression of total Foxn1 in WT (n = 2 at 2 months; n = 3 at 24 months) and in the 2 Foxn1Tg lines (line 60: n = 3 at 2 months and n = 3 at 24 months; line 5: n = 4 at 25-35 months). WT: white bar represents 2 months of age; and gray bar, 24 months of age. Foxn1 Tg: white bar represents 2 months of age; gray bar, 24 months of age (line 60); crossed bars represent 25 to 35 months of age (line 5). y-axis is in logarithmic scale. Errors bars represent SD.
Quantification of endogenous and Tg Foxn1 expression by quantitative RT-PCR. (A) RT-PCR shows specificity of primers that detect both the endogenous and transgene Foxn1 and primers that only detect transgene Foxn1 transcripts. Each lane represents results from a WT or Foxn1Tg mouse (line 60). (B) Diagram showing the relative positions of the forward and reverse primers that detect either both endogenous and transgene (arrows) or only Tg (arrow outlines) Foxn1 transcripts. (C) Expression of the endogenous and transgene Foxn1 in 2-month-old (n = 3) and 23- to 28-month-old (n = 3) Tg line (line 60). The numbers of transcripts per microgram of total RNA were calculated from a standard curve after normalization with the mouse housekeeping gene Gapdh; each sample was performed in triplicates. The endogenous Foxn1 levels were determined by subtracting the total Foxn1 (endogenous plus transgene) from that of the transgene. White bars represent the total Foxn1 levels; gray bars, Tg Foxn1; and black bars, endogenous Foxn1. Errors bars represent SD. (D) Expression of total Foxn1 in WT (n = 2 at 2 months; n = 3 at 24 months) and in the 2 Foxn1Tg lines (line 60: n = 3 at 2 months and n = 3 at 24 months; line 5: n = 4 at 25-35 months). WT: white bar represents 2 months of age; and gray bar, 24 months of age. Foxn1 Tg: white bar represents 2 months of age; gray bar, 24 months of age (line 60); crossed bars represent 25 to 35 months of age (line 5). y-axis is in logarithmic scale. Errors bars represent SD.
Overexpression of Foxn1 and thymopoiesis in young mice
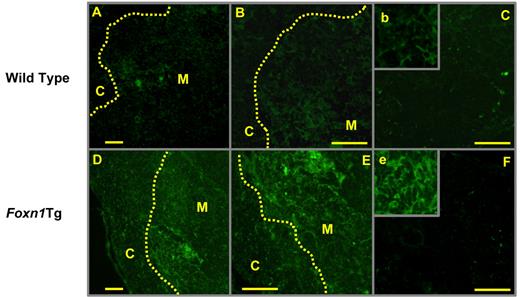
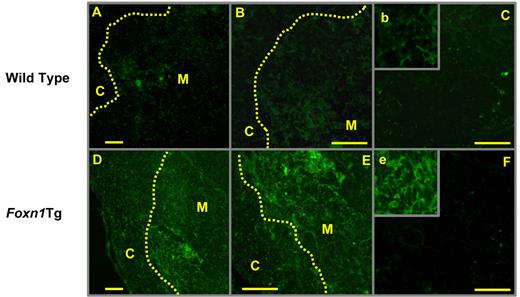
We next determined whether high levels of expression of Foxn1 affected thymic architecture in the young Tg mice. Using a rabbit polyclonal antibody raised against Foxn1 peptide and immunofluorescent staining, we found that expression of Foxn1 in the WT thymus (2-3 months) was prominent in the thymic medulla with scattered Foxn1+ cells in the thymic cortex (Figure 2A-B inset b). Expression of Foxn1 in Tg mice was also detected in thymic medulla as well as cortex with a similar expression pattern; however, staining appeared more prominent compared with that in the WT thymus (Figure 2A-B,D-E insets b,e). Thus, the enhanced intensity staining of Foxn1 reflected the increase in the expression at the mRNA levels of both the transgene and endogenous Foxn1. Functionally, the overexpression of Foxn1 did not affect the development of thymocytes as determined by the normal distribution of CD4, CD8 double-negative, double-positive, and single CD4- or CD8-positive subsets compared with that found in WT mice (supplemental Figure 1, available on the Blood Web site; see the Supplemental Materials link at the top of the online article).
Detection of Foxn1-expressing stroma cells in the thymus of WT and Foxn1 Tg mice (2-3 months) by immunofluorescent staining. Frozen sections (4-5 μm) were fixed in acetone and stained with a rabbit anti-Foxn1 antibody (IgG fraction) or purified rabbit IgG control antibody, followed by incubation with FITC-conjugated goat anti–rabbit IgG F(ab)2′. (A-B,D-E) Stained with anti-Foxn1 antibody. (C,F) Stained with purified rabbit IgG antibody. Slides were studied using Zeiss LSM 510 confocal microcopy (A,C-D,F, original magnification 25×/0.8 W; B,E, original magnification 40×/1.2 W). Insets b and e represent an enlargement of the medulla regions in panels B and E, respectively. Scale bars represent 50 μm.
Detection of Foxn1-expressing stroma cells in the thymus of WT and Foxn1 Tg mice (2-3 months) by immunofluorescent staining. Frozen sections (4-5 μm) were fixed in acetone and stained with a rabbit anti-Foxn1 antibody (IgG fraction) or purified rabbit IgG control antibody, followed by incubation with FITC-conjugated goat anti–rabbit IgG F(ab)2′. (A-B,D-E) Stained with anti-Foxn1 antibody. (C,F) Stained with purified rabbit IgG antibody. Slides were studied using Zeiss LSM 510 confocal microcopy (A,C-D,F, original magnification 25×/0.8 W; B,E, original magnification 40×/1.2 W). Insets b and e represent an enlargement of the medulla regions in panels B and E, respectively. Scale bars represent 50 μm.
Overexpression of Foxn1 attenuates age-associated decline in thymopoiesis as measured by thymocyte numbers and ETP frequencies
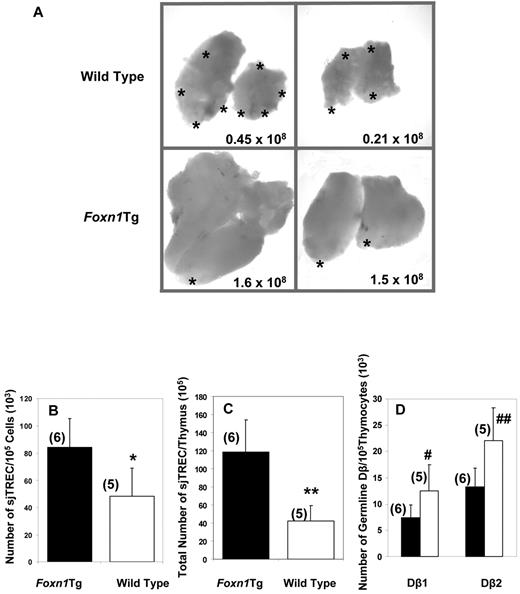
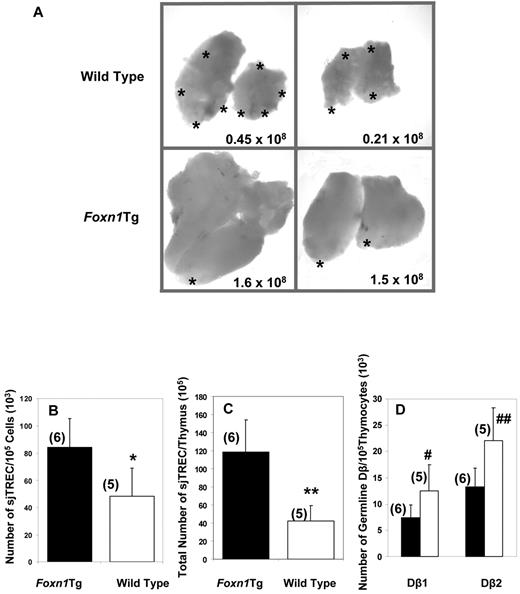
Because overexpression of Foxn1 does not affect thymopoiesis in young mice, we determined whether age-associated decline in thymopoiesis is affected in aged Foxn1Tg. As shown in Figure 3A, aged Foxn1 Tg (13 months) had relatively larger thymi, few foci of adipose tissue, and higher number of total thymocytes compared with age-matched WT. We determined the frequencies of sjTREC/105 thymocytes and total number of sjTREC as readout of naive T-cell output in the thymi of Foxn1Tg versus WT mice at 12 to 15 months of age. The thymi from Foxn1Tg averaged 1.7-fold higher in frequency of sjTREC/105 cells and 2.8-fold higher in the total number of sjTREC/thymus (Figure 3B-C, P = .019; P = .004). Conversely, we observed significantly lower copy numbers of the germline TCR-Dβ1 in aged Foxn1Tg compared with the age-matched WT (P = .044), indicating that a higher number of the TCR-Dβ loci are rearranged in thymocytes from Foxn1Tg (Figure 3D). Although we detected a similar trend for the TCR-Dβ2 locus, the differences were not quite significant (P = .063).
Gross morphology and TCR rearrangement in aged WT and Foxn1Tg. (A) Gross morphology of thymi from 2 WT (top) and 2 Foxn1Tg (line 60) mice 13 months of age (bottom). The numbers denote total number of thymocytes obtained from each thymus. *Translucent/fatty areas of the thymus. (B-C) Rearrangement of TCR-α chain was measured as the number of sjTREC/105 thymocytes (B), and total number of sjTREC/thymus (C) in old (12-15 months of age) Foxn1Tg (line 60 and line 5) and WT mice. (D) D-J rearrangement of TCR-β chain was determined by the number of germline copies of Dβ1 and Dβ2; black bars represent Foxn1 Tg; and white bars, WT mice. Quantitative PCR was used for both assays; each sample was performed in triplicates. Values in parentheses indicate the numbers of mice in each group. P values from comparison between WT and Foxn1Tg mice as determined by t test are as follows: *P = .019; **P = .004; #P = .040; ##P = .063.
Gross morphology and TCR rearrangement in aged WT and Foxn1Tg. (A) Gross morphology of thymi from 2 WT (top) and 2 Foxn1Tg (line 60) mice 13 months of age (bottom). The numbers denote total number of thymocytes obtained from each thymus. *Translucent/fatty areas of the thymus. (B-C) Rearrangement of TCR-α chain was measured as the number of sjTREC/105 thymocytes (B), and total number of sjTREC/thymus (C) in old (12-15 months of age) Foxn1Tg (line 60 and line 5) and WT mice. (D) D-J rearrangement of TCR-β chain was determined by the number of germline copies of Dβ1 and Dβ2; black bars represent Foxn1 Tg; and white bars, WT mice. Quantitative PCR was used for both assays; each sample was performed in triplicates. Values in parentheses indicate the numbers of mice in each group. P values from comparison between WT and Foxn1Tg mice as determined by t test are as follows: *P = .019; **P = .004; #P = .040; ##P = .063.
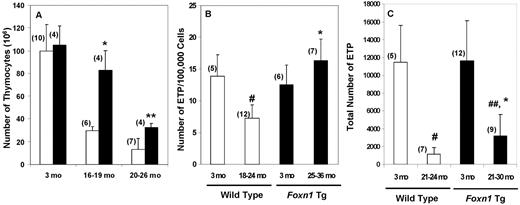
To further demonstrate that overexpression of Foxn1 improves thymopoiesis with age, we determined changes in the number of thymocytes in WT and Foxn1Tg that were > 2 years old. Although the number of thymocytes in WT declined rapidly during middle age (by 16-19 months) and then showed a more protracted reduction in the 20- to 26-month age group, the reduction in the number of thymocytes in Foxn1Tg progressed with a much reduced magnitude (Figure 4A). Compared with the 3-month-old mice, there was a 3.7-fold reduction in the number of thymocytes in WT by 16 to 19 months of age, but the number of thymocytes in Foxn1Tg of the same age group was reduced only by 1.4-fold (Figure 4A). By 20 to 26 months of age, we observed a 5.3-fold reduction compared with 3 months in WT but only a 3-fold reduction in Foxn1Tg (Figure 4A). Furthermore, we analyzed a group of 6 Foxn1Tg killed at 29 to 32 months of age and determined that the number of thymocytes in these Foxn1Tg were not different from those of the WT 20 to 26 months of age (14.2 × 10⁶ ± 13.3 × 10⁶ WT vs 18.8 × 10⁶ ± 11.3 × 10⁶ Tg; P = .83, data not shown). Thus, our data strongly indicate that overexpression of Foxn1 in the thymus attenuates the age-associated decline in thymopoiesis in Foxn1Tg. Based on the total number of thymocytes, we estimated that the decline in thymopoiesis in Foxn1Tg lags behind WT approximately 6 to 8 months.
Thymocyte and ETP numbers in WT and Foxn1Tg. (A) Thymocyte numbers in 3-month-old, 16- to 19-month-old, and 20- to 26-month-old WT (white bars) and Foxn1Tg (line 60; black bars). P values from comparison between WT and Foxn1Tg as determined by t test or Mann-Whitney are as follows: *P = .043 and **P = .012, respectively. (B) Frequencies of ETP in WT (white bars) and Foxn1Tg (black bars). ETP are defined as Lin− CD117+ CD44hi CD25− C127−. WT 3-month-old versus WT 18- to 24-month-old: #P = .009; Foxn1Tg 25- to 36-month-old versus WT 18- to 24-month-old: *P = .038 (P values from t test). (C) Total number of ETP in WT (white bars) and Foxn1Tg (black bars) mice. WT 3-month-old versus 21- to 24-month-old: #P = .003; Foxn1Tg 3-month-old versus 21- to 30-month-old: ##P < .001; Foxn1Tg 21- to 30-month-old versus WT 21- to 24-month-old: *P = .047 (P values from t test). Error bars represent SD. Values in parentheses represent the number of mice in each group. Data were from line 5 and line 60.
Thymocyte and ETP numbers in WT and Foxn1Tg. (A) Thymocyte numbers in 3-month-old, 16- to 19-month-old, and 20- to 26-month-old WT (white bars) and Foxn1Tg (line 60; black bars). P values from comparison between WT and Foxn1Tg as determined by t test or Mann-Whitney are as follows: *P = .043 and **P = .012, respectively. (B) Frequencies of ETP in WT (white bars) and Foxn1Tg (black bars). ETP are defined as Lin− CD117+ CD44hi CD25− C127−. WT 3-month-old versus WT 18- to 24-month-old: #P = .009; Foxn1Tg 25- to 36-month-old versus WT 18- to 24-month-old: *P = .038 (P values from t test). (C) Total number of ETP in WT (white bars) and Foxn1Tg (black bars) mice. WT 3-month-old versus 21- to 24-month-old: #P = .003; Foxn1Tg 3-month-old versus 21- to 30-month-old: ##P < .001; Foxn1Tg 21- to 30-month-old versus WT 21- to 24-month-old: *P = .047 (P values from t test). Error bars represent SD. Values in parentheses represent the number of mice in each group. Data were from line 5 and line 60.
ETP frequencies and total number have been shown to decline with age.12 To begin understanding the cellular mechanism by which thymic involution is attenuated in aged Foxn1Tg, we determined whether the ETP population is affected with age in WT and Foxn1Tg. As previously shown with advanced age, the frequency of ETP/105 cells and the total number of ETPs were significantly reduced in WT12 (Figure 4B-C). However, the ETP frequencies were not affected, and the decline in total ETP number was attenuated with age in the Foxn1Tg. ETP frequencies were not only significantly higher in the aged Foxn1Tg compared with those in aged WT (P = .038), but the levels were also not significantly different from those found in young WT and Foxn1Tg (P = .233, P = .534, Figure 4B); the total number of ETPs in old Foxn1Tg mice was 2.7-fold higher than in aged WT (P = .047, Figure 4C).
Overexpression of Foxn1 prevents age-associated changes in cortical and medullary thymic architecture
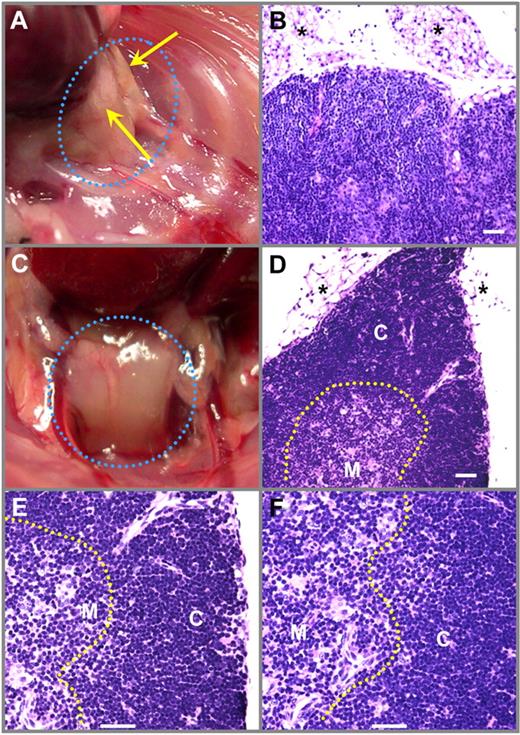
A hallmark of aged-associated thymic involution is the reduction in size and the accumulation of adipose tissue in thymic parenchymal tissue, resulting in a fatty appearance of the thymus gland and a reduction in thymocyte numbers.13 As shown in Figure 3, at a gross level of observation, thymi from 2 Foxn1Tg (13 months) displayed a homogeneous opacity with no obvious appearance of adipose tissue, which appears as translucent areas present in thymi from age-matched WT. A histologic study was performed to determine whether changes seen in an involuted thymi from WT were also observed in Foxn1Tg. Figure 5A-B shows a fatty thymus of a 26-month-old WT with altered thymic architecture as determined by the loss of cortical-medullary demarcation. As a comparison, a thymus from a much older Foxn1Tg (line 60, 31 months) showed little adipose tissue deposition and a well-defined cortical-medullary demarcation (Figure 5C-F).
Changes in gross thymic morphology and histology of old WT and Foxn1 Tg mice (line 60). (A) Gross thymic morphology of a 26-month-old WT mouse with adipose tissue present (arrows). (B) H&E staining of the same thymus shows the loss of cortical-medulla demarcation and the abundance of adipose tissue (*). (C) Gross thymic morphology of a 31-month-old Foxn1Tg mouse with intact parenchymal tissue with little adipose tissue deposition. (D-F) H&E staining of the same thymus shows a clear cortical-medulla demarcation and little adipose tissue deposition. Images were acquired with a Leitz Diaplan microscope with a 25×/0.6 W (B-D) and 50×/1.0 W equipped with Religa 2000R camera and QImaging Pro software (Version 6.0). Scale bars represent 50 μm.
Changes in gross thymic morphology and histology of old WT and Foxn1 Tg mice (line 60). (A) Gross thymic morphology of a 26-month-old WT mouse with adipose tissue present (arrows). (B) H&E staining of the same thymus shows the loss of cortical-medulla demarcation and the abundance of adipose tissue (*). (C) Gross thymic morphology of a 31-month-old Foxn1Tg mouse with intact parenchymal tissue with little adipose tissue deposition. (D-F) H&E staining of the same thymus shows a clear cortical-medulla demarcation and little adipose tissue deposition. Images were acquired with a Leitz Diaplan microscope with a 25×/0.6 W (B-D) and 50×/1.0 W equipped with Religa 2000R camera and QImaging Pro software (Version 6.0). Scale bars represent 50 μm.
We next analyzed the expression patterns and the intensities of keratin 8 and keratin 5, which demarcate thymic cortex and medulla, respectively. The intensity of keratin 8 staining (red) was less in 26-month thymi compared with that determined in 2-month WT (Figure 6B,C vs A). Compared with WT, Foxn1 Tg (31 months) displayed intense keratin 8 staining in the thymic cortex, showing few areas that were devoid of staining (Figure 6E-F). We also observed a disorganized medullary region as visualized by filamentous staining pattern of keratin 5 (green) as well as the collapse of discreet regions of keratin 5-positive cells into a fused medullary region in old WT mice (Figure 6B-C). In contrast, the patterns of keratin 5 staining in Foxn1Tg displayed a more discrete and distinct medullary foci similar to that found in young mice (Figure 6D-F). Thus, overexpression of Foxn1 dampened the age-associated alterations in thymic architecture.
Double-staining of cortical keratin 8 (red) and medullary keratin 5 (green) in the thymus of WT and Foxn1Tg mice (line 60). Acetone-fixed frozen sections of thymi from 2-month-old (A) and 26-month-old (B-C) WT mice and 2-month-old (D) and 31-month-old (E-F) Tg mice were stained with a rabbit-anti–mouse keratin 5 (green) and rat-anti–mouse keratin 8 (red). Sections were analyzed with a Zeiss LSM 510 confocal microscope. Images were obtained with CApo 40×/1.2 W with a 2 × 2 matrix and digitally stitched using the LSM 510 software. Scale bar represents 200 μm.
Double-staining of cortical keratin 8 (red) and medullary keratin 5 (green) in the thymus of WT and Foxn1Tg mice (line 60). Acetone-fixed frozen sections of thymi from 2-month-old (A) and 26-month-old (B-C) WT mice and 2-month-old (D) and 31-month-old (E-F) Tg mice were stained with a rabbit-anti–mouse keratin 5 (green) and rat-anti–mouse keratin 8 (red). Sections were analyzed with a Zeiss LSM 510 confocal microscope. Images were obtained with CApo 40×/1.2 W with a 2 × 2 matrix and digitally stitched using the LSM 510 software. Scale bar represents 200 μm.
Overexpression of Foxn1 increases the number of EpCAM+ cells and maintains a higher number of EpCAM+ with age
It has been shown that aging causes a reduction in the CD45− thymic stroma fraction, mainly because of a reduction in the highly proliferating MHC IIhi TEC subset.14 Reduction of Foxn1 expression is correlated with a reduction in mTECs, specifically with the loss of MHC IIhi UEA+ mTECs, which express high levels of Foxn1.9,10 We found that the total number of MHC II+ EpCAM+ Ly51− TECs was 2.5-fold higher in 3-month-old Foxn1Tg compared with WT (P = .003, Table 3). Because it has been shown that the MHC IIhi TEC is responsible for the size of the medullary compartment, we determined the number of MHC IIhi EpCAM+ Ly51− TECs and found that it was 5-fold higher in Foxn1Tg (P < .001, Table 3). Aging resulted in reduction of both MHC II+ and MHC IIhi EpCAM+ subsets; however, their numbers remained significantly higher in Foxn1Tg compared with WT (P = .023, P = .040, Table 3). We also found that the percentages of Ki67+ were higher (2-fold) in aged Foxn1Tg compared with aged WT (P = .017, Table 3). However, cortical TEC numbers were equivalent in aged Foxn1Tg and WT (data not shown). Flow cytometric profiles of isolated TECs are presented in supplemental Figure 2.
Attenuation of age-associated thymopoiesis affects the peripheral naive and memory T-cell compartment
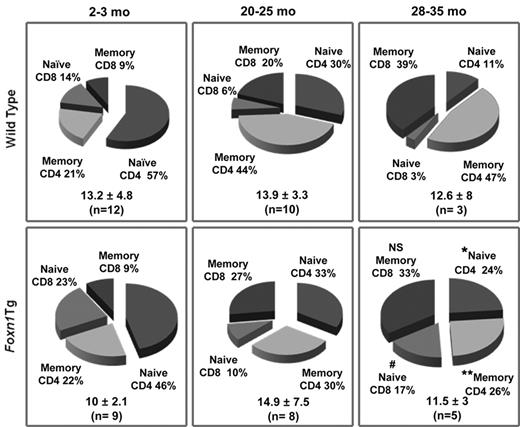
It is well established that the decline in the production and egress of naive T cells from the thymus with age results in the contraction of the peripheral CD4 and CD8 naive T-cell compartments and a concomitant expansion of the memory compartments. Therefore, we determined whether attenuation of thymic involution in aged Foxn1Tg affected the peripheral memory pools. Splenic naive and memory T cells were defined as CD3+ T cells that were CD44+ or CD44hi, respectively. As expected, the total number of CD3+ T cells in the spleen was not significantly changed with age in WT or Foxn1Tg (Figure 7). However, the CD4+ naive compartment in WT showed a significant decline from 57% at 2 to 3 months to 30% at 20 to 25 months and to 11% at 28 to 35 months; similarly, the CD8+ naive compartment declined from 14% to 6% and to 3% (Figure 7 top panels). Concurrently, the CD4+ memory compartment in WT increased from 21% to 44% and to 47%, and the CD8+ memory compartment increased from 9% to 20% and to 39% (Figure 7 top panels). In contrast, the decline in naive CD4+ and CD8+ in the CD3+ pool was less severe in Foxn1Tg compared with WT; we determined only a 2-fold reduction (28-35 months vs 2-3 months) for naive CD4+ and 1.4-fold for naive CD8+ in Foxn1Tg compared with a 5.2-fold and 4.7-fold decline in WT, respectively (Figure 7). Within the memory compartments, we detected a similar fold increase in the expansion of CD8+ memory compartment in WT and Foxn1Tg (3.7-fold in Tg and 4.3-fold in WT). Interestingly, although there was a 2.2-fold increase in the expansion of memory CD4+ in WT, no significant expansion in the CD4+ memory compartment was detected in Foxn1Tg (Figure 7). Furthermore, the fractions of CD4+ and CD8+ naive cells were significantly higher in the Foxn1Tg at 28 to 35 months compared with WT within the same age group (P = .038 for CD4 and P = .058 for CD8, Figure 7). Conversely, the fraction of CD4+ memory compartment in the Foxn1Tg mice was significantly less than that found in WT mice (26% vs 47%, P = .0019).
Changes in the peripheral splenic naive and memory T-cell compartments with age. Pie charts show the distributions of naive and memory CD4+ and CD8+ T cells in WT and Foxn1Tg mice (lines 5 and 60) of 3 different age groups. The percentages of naive and memory cells were calculated based on the average total number of CD3+ CD44+ T cells per spleen (bottom right in each panel, in millions). Values in parentheses indicate the number of animals in each age group. P values from t test comparing WT and Foxn1 within an age group: *P = 0.038; **P = 0.019; #P = 0.058. NS indicates not significant.
Changes in the peripheral splenic naive and memory T-cell compartments with age. Pie charts show the distributions of naive and memory CD4+ and CD8+ T cells in WT and Foxn1Tg mice (lines 5 and 60) of 3 different age groups. The percentages of naive and memory cells were calculated based on the average total number of CD3+ CD44+ T cells per spleen (bottom right in each panel, in millions). Values in parentheses indicate the number of animals in each age group. P values from t test comparing WT and Foxn1 within an age group: *P = 0.038; **P = 0.019; #P = 0.058. NS indicates not significant.
Discussion
We have previously shown that expression of Foxn1 in the thymus declines as early as 3 months and occurs concurrently with the onset of a reduction in the total number of thymocytes and total sjTREC/thymus.3 To investigate functional roles of Foxn1 in thymopoiesis in the postnatal thymus, we generated Foxn1Tg in which expression of Foxn1 is driven by the human K14 promoter. We selected K14 promoter because K14 is expressed in epithelial stem cells and in thymic epithelial cell precursors.15,16 The 2 Tg lines that we have generated have low copy numbers of the transgene (4 or 5 and 10-12 copies); however, both express Foxn1 at a level 20-fold higher than in the C57Bl/6 WT mice. More importantly, Foxn1 expression in both Tg lines was not reduced with age.
How expression of Foxn1 is regulated, particularly with age, is not known. Although a 3-dimensional organization of TEC is required for maintenance of Foxn1 expression, upstream signals/factors that regulate expression of Foxn1 during thymic organogenesis and in postnatal thymus remain elusive.17,18 It has been suggested that members of the Wnt glycoprotein family can regulate expression of Foxn1 in vitro.19 In hair follicles, BMP4 has been shown to up-regulate Foxn1 expression.20 BMP4 has also been shown to localize to cells in the ventral region of the third pharyngeal endoderm that later express Foxn1 and are responsible for thymic organogenesis.21 Direct evidence that links BMP4 and Foxn1 expression in the aged thymus, however, is lacking.
The Foxn1Tg provide a unique in vivo mouse model to test whether overexpressing Foxn1 transgene affects expression of endogenous Foxn1. We discovered that overexpression of the transgene Foxn1 significantly increased expression of the endogenous gene, suggesting that Foxn1 acts in cis to regulate its own expression. Indeed, we found that stable mouse OP9 and human TEC cell lines that overexpress the mouse and human FOXN1 (OP9-Foxn1, TE84-FOXN1) induced expression of the endogenous mouse Foxn1 and human FOXN1 genes (data not shown). Thus, the in vitro observations in the 2 cell lines recapitulate findings obtained from the in vivo Foxn1Tg model. Our finding that expression of Foxn1 is self-regulated fulfills the previous suggestive notion that Foxn1 functions in a cell-autonomous fashion and underscores the finding that TECs that express a high level of Foxn1 are more sensitive to Foxn1 levels.10,18 Furthermore, the same induced levels of the endogenous Foxn1 in young and old mice suggest that down-regulation of Foxn1 with age is totally reversible and can be manipulated to reverse expression of Foxn1 in the aged thymus.
Because expression of Foxn1 in our Foxn1Tg is not reduced with age, we could directly determine whether maintaining expression of Foxn1 at higher than the normal physiologic level would have an effect on thymopoiesis in young and old mice. In the WT thymus, we found that Foxn1 is predominantly expressed in the medulla; however, scattered Foxn1+ TECs were also found in the cortex. This pattern of Foxn1 expression is similar to previous findings reported by others in which Foxn1+ cells were tracked by the expression of Gfp driven by the Foxn1 promoter.22 The predominantly medullary pattern of expression is similar in the Foxn1Tg. The intensity of the staining appears stronger in the Tg thymus, which corroborates the high expression of Foxn1 at the mRNA level. The pattern of expression also correlates with K14 promoter activity. K14 protein forms a heterodimer complex with keratin 5, which is predominantly expressed in mTECs and in a minor population of cortical TECs.23,24 Thus, K14-driven expression of Foxn1 in the Tg thymus closely emulates the expression of the endogenous Foxn1 and does not alter thymopoiesis as supported by the normal distribution of CD4, CD8 double-positive, CD4+ and CD8+ single-positive cells and CD4, CD8, CD3 triple-negative. We did observe, however, a significantly higher fraction of the single CD3+ CD8α+ T cells (73.3 ± 0.5 vs 59 ± 6.2, P = .011) and concomitantly a reduced level of CD3− CD8α+ (26.7 ± 1.6 vs 40.6 ± 6.2, P = .015) in Tg thymi compared with WT (supplemental Figure 1). Interestingly, the total number of thymocytes in young Foxn1Tg is not higher than that found in young WT, indicating that overexpression of Foxn1 alters neither the function nor the number of thymopoietic supporting thymic stromal niches. In the context that the thymic size and total thymocyte number are dictated by cortical niches occupied by the double-negative cells as suggested previously,25 we would speculate that high expression of Foxn1 does not affect the double-negative cell niches, at least in the young mice.
Although overexpression of Foxn1 does not affect thymopoiesis in young mice, it does have significant effects on thymopoiesis in aged thymus. Using the number of copies of germline TCR-Dβ1 and TCR-Dβ2 as an indicator of maturation at the triple-negative stage III, in which TCR-β loci are undergoing rearrangement, we demonstrated that, in old (12-15 months) Foxn1Tg thymus, there were 1.7-fold fewer number of germline Dβ1 and Dβ2 copies compared with WT mice. This suggests that more triple-negative stage III cells are undergoing TCRV-β rearrangement or that TN in Tg thymi are more effective in this process; consequently, the total number of sjTREC, a measurement of TCRVα rearrangement, is also higher (3-fold) in the thymus of Foxn1Tg. Overall, there was a precipitous decline in thymopoiesis from 2 months to 16 to 19 months in WT compared with Foxn1Tg. In Foxn1Tg, a similar pattern of decline was only observed much later when the mice were 20 to 26 months old. We also determined that the total number of thymocytes in Foxn1Tg at 29 to 32 months is not significantly different from that found in the 20- to 26-month age group. Similarly, the number of thymocytes is not significantly different between the 16- to 19-month and 20- to 26-month age groups. Taken together, we suggest that the decline in thymocyte numbers is attenuated with age in Foxn1Tg mice by approximately 6 to 8 months. Thus, although overexpression of Foxn1 does not completely rescue thymic involution and restore thymopoiesis, high expression of Foxn1 does circumscribe the detrimental effect of age on thymopoiesis.
It was suggested that the decline in the frequencies, number, and function of the ETP are partly responsible for thymic involution.12 Although we also detected a reduction in the frequencies and number of ETP in old WT mice, the frequencies of ETP in old Foxn1Tg mice were not reduced and the total number of ETPs in old Foxn1Tg was higher than old WT. We noted that the frequencies and total number of ETPs in young WT and Foxn1Tg mice were not significantly different. The data indicate that thymic microenvironment with high expression of Foxn1 does not affect the homing and function of the young ETP, reflecting similar total number of thymocytes in both young WT and Foxn1Tg; rather, high expression of Foxn1 in old mice prevents the decline in the frequency of ETP and lessens the decline in ETP number. Thus, we speculate that high expression of Foxn1 only partially rescues the intrinsic defect in aged ETP. It has been suggested that Notch signal is required for the generation of ETP from the bone marrow multipotent progenitors.26 Whether ETP displays a decline in Notch signal with age remains to be determined. However, it is less likely that high expression of Foxn1 directly affects Notch signal in the aged ETP for 2 reasons. First, expression of the Notch ligand Delta-like 1 (Dl1) and Delta-like 4 (Dl4) is not dependent on the expression of Foxn1 in the postnatal thymus.27,28 Second, although we found the expression of both Dl1 and Dl4 are reduced in the aged thymus, their reduced expression levels are not restored in thymic stromal of Foxn1Tg mice (data not shown).
Age-associated thymic involution is associated with infiltration of fibroblastic and adipose tissue as a result of epithelial-mesenchymal transition.13 Although thymi from old Foxn1Tg are reduced in size compared with young, we observed that there was little infiltration of adipose tissue and the cortical-medullary demarcation remains intact. In the caloric-restricted mice, increases in fibroblasts in the aged thymus are blocked by inhibition of epithelial-mesenchymal transition and adipogenesis through inhibition of peroxisome proliferator-activated receptor-γ expression.29 A direct role of Foxn1 in adipogenesis remains to be determined.
Previous work has shown that induced-deletion of Foxn1 causes rapid thymic atrophy mainly because of severe deterioration of mTECs, indicating that Foxn1 expression is critical for the maintenance of mTECs in the postnatal thymus.9 It was also noted that the MHC IIhi mTEC displays high proliferative rate, is responsible for generating the mTEC pool, and is sensitive to reduced expression of Foxn1.10,14,30 Our data showing higher number of EpCAM+ MHC II + and MHC IIhi TECs in Foxn1Tg are in agreement with the previous findings.9,10,14,30 The elevated number of these EpCAM+ mTECs and higher proliferation rate of the EpCAM+ MHC IIhi in old Foxn1 Tg than in WT suggests that the presence of increased number of these cells is responsible for limiting alterations in thymic architecture and attenuate the decline in thymopoiesis with age.
The decline in the production of naive T cells from the thymus caused by age-associated thymic involution results in constriction of the TCR repertoire diversity and expansion of peripheral memory compartments by homeostatic expansion.2,31 Therefore, the ability to prevent the decline in thymic production of naive T cells and consequently attenuate age-associated expansion of peripheral memory compartments is essential in restoring a young-like peripheral T-cell composition. In our Foxn1Tg mice, preventing alterations in thymic architecture with age correlated with improved thymopoiesis, reflected by the higher frequencies of ETP and absolute number of thymocytes. Furthermore, alterations in the proportions of peripheral naive and memory compartments with age were also prevented in aged Foxn1Tg mice. Whether the combinatorial effect of preventing age-associated changes in thymopoiesis and peripheral T cells also will lead to improvement of immune response in the old Foxn1Tg mice is not known and is currently under investigation.
The online version of this article contains a data supplement.
The publication costs of this article were defrayed in part by page charge payment. Therefore, and solely to indicate this fact, this article is hereby marked “advertisement” in accordance with 18 USC section 1734.
Acknowledgments
The authors thank Pat Simms for her excellent technical skill in cell sorting, Mary Kay Olsen for her work on the histology study, Theodore Daniel Logan and Dr Avinash Bhandoola (University of Pennsylvania) for kindly sharing their unpublished thymic epithelial cell isolation protocol, Dr Elaine Fuchs for the keratin 14 construct, and Dr Al Singer (National Cancer Institute) for his valuable advices and support in the early phase of the work.
This work was supported by the National Institutes of Health (R01 AG32809, P.T.L.; R01 AG013874, P.L.W.; T32 AI007508, E.C.Z.; T32 AG031780, E.C.Z.) and Loyola University Stritch School of Medicine (intramural pilot project grant, P.T.L.).
National Institutes of Health
Authorship
Contribution: E.C.Z. and P.T.L. designed experiments and wrote the paper; P.L.W. contributed to experimental design; E.C.Z., P.A.K., and S.Z. performed research and analyzed data; and N.J.Z.-L. and A.B.F. assisted with construction of the transgenic mice.
Conflict-of-interest disclosure: The authors declare no competing financial interests.
Correspondence: Phong T. Le, Department of Microbiology and Immunology, 2160 S First Ave, Bldg 120, Rm 5644, Maywood, IL 60154; e-mail: ple@lumc.edu.


