Abstract
Soluble HLA-G (sHLA-G) inhibits natural killer (NK) cell functions. Here, we investigated sHLA-G–mediated modulation of (1) chemokine receptor and NK receptor expression and function and (2) cytokine and chemokine secretion in CD56bright and CD56dim NK cells. sHLA-G-treated or untreated peripheral blood (PB) and tonsil NK cells were analyzed for chemokine receptor and NK receptor expression by flow cytometry. sHLA-G down-modulated (1) CXCR3 on PB and tonsil CD56bright and CD56dim, (2) CCR2 on PB and tonsil CD56bright, (3) CX3CR1 on PB CD56dim, (4) CXCR5 on tonsil CD56dim, and (5) CD94/NKG2A on PB and tonsil CD56bright and CD56dim NK cells. Such sHLA-G–mediated down-modulations were reverted by adding anti–HLA-G or anti–ILT2 mAbs. sHLA-G inhibited chemotaxis of (1) PB NK cells toward CXCL10, CXCL11, and CX3CL1 and (2) PB CD56bright NK cells toward CCL2 and CXCL10. IFN-γ secretion induced by NKp46 engagement was inhibited by NKG2A engagement in untreated but not in sHLA-G–treated NK cells. sHLA-G up-regulated secretion of (1) CCL22 in CD56bright and CD56dim and (2) CCL2, CCL8, and CXCL2-CXCL3 in CD56dim PB NK cells. Signal transduction experiments showed sHLA-G–mediated down-modulation of Stat5 phosphorylation in PB NK cells. In conclusion, our data delineated novel mechanisms of sHLA-G–mediated inhibition of NK-cell functions.
Introduction
Natural killer (NK) cells are a lymphocyte population that can spontaneously kill tumor cells and virus-infected cells. Recently, it has been shown that NK cells are also major producers of proinflammatory and immunosuppressive cytokines, such as IFN-γ, TNF-α, and IL-10, in physiologic and pathologic conditions.1 Moreover, NK cells secrete hematopoietic growth factors, ie, granulocyte macrophage–colony-stimulating factor, granulocyte colony-stimulating factor, and IL-3, and chemokines, including CCL2 (MCP-1), CCL3 (MIP1-α), CCL4 (MIP1-β), CCL5 (RANTES), and CXCL8 (IL-8).1 Importantly, NK-cell major functions can be modulated by their interaction with other immune cell types, such as dendritic cells, T and B lymphocytes, macrophages, and neutrophils.2 Altogether, these features delineate a central role of NK cells in innate immune response against tumors and pathogens,3 and in innate and adaptive immunity regulation.
Multiple activating or inhibitory receptors regulate NK-cell functions, and the balance between activating/inhibitory signals is crucial to determine NK-cell activation and target cells lysis, allowing NK cells to acquire self-tolerance and avoid autoreactivity. In particular, HLA class I molecules play a key role in self-tolerance by interacting with NK-cell inhibitory receptors.4 These receptors include CD94/NKG2A heterodimer that recognizes HLA-E molecule and killer-Ig–like receptor (KIR; CD158) family that is composed of clonally distributed receptors specific for determinants shared by classic HLA class Ia alleles.4 NK-cell activation may be induced by proinflammatory cytokines such as IL-2, IL-15, and IL-18 and by the interaction between activating NK receptors and their ligands on target cells. In humans, activating receptors include NKp46, NKp30, NKp44 (natural cytotoxicity receptors), DNAM-1, and NKG2D and coreceptors 2B4 and NTBA.4
Different chemokine receptors control NK-cell migration and recirculation through peripheral blood (PB), inflamed tissues, and secondary lymphoid organs.5 In particular, CCR7 and CXCR3, through a gradient of CCL19/CCL21 and CXCL9/CXCL10/CXCL11, respectively, drive NK-cell migration to lymph nodes, where they promote T-helper 1 (Th1)–polarization, whereas CXCR1, CX3CR1, and chem23R, specific receptors for CXCL8 (IL-8), CXC3CL1 (fractalkine) and Chemerin, respectively, are involved in NK-cell binding to endothelial cells and migration to injured tissues.5-7
Two major subsets of PB NK cells have been identified on the basis of surface density of CD56 molecule, an isoform of human neural cell adhesion molecule, that may be involved in NK cell–target cell interactions. CD56bright/CD16dim/− NK cells express high levels of CD56, are virtually negative for CD16, and exhibit low cytotoxicity, while secreting large amounts of Th1 cytokines in response to cytokines (ie, IL-12 and IL-18). These cells express CCR7 and CXCR3 and predominate in secondary lymphoid organs.8,9 In contrast, the main NK-cell subset in PB is represented by CD56dim/CD16+ NK cells that exert potent natural and antibody-dependent cytotoxicity; express CXCR1, CX3CR1, and chem23R; and display higher expression of IL-2R common γ chain compared with CD56bright counterparts. Both NK-cell subsets express CD94/NKG2A, whereas KIRs expression is mainly detected in CD56dim/CD16+ subset.10
Several studies have demonstrated HLA-G inhibitory effects on NK cells. HLA-G belongs to nonclassic HLA Ib molecules that also include HLA-E, -F, and -H. These molecules, at variance with classic HLA-Ia molecules (HLA-A, -B, and -C), display potent immunoregulatory properties targeting NK cells, T and B lymphocytes, monocytes, and dendritic cells.11
HLA-G shows a complex splicing pattern of primary transcript that yields 4 membrane-bound (HLA-G1, -G2, -G3, and -G4) and 3 soluble (HLA-G5, -G6, and -G7) isoforms.12 Soluble HLA-G (sHLA-G) also can be generated by shedding of membrane-bound isoforms by metalloproteases.
Both soluble and membrane-bound HLA-G molecules display similar immunoregulatory properties mediated by the interaction with different receptors. In particular, HLA-G is the unique known ligand of KIR2DL4 (CD158d), whose expression is mainly detected in CD56bright/CD16dim/− NK cells. Additional HLA-G receptors are represented by immunoglobulin-like transcript (ILT)2 (CD85j, LILRB1) and ILT4 (CD85d, LILRB2). Both lymphoid and myeloid cells express ILT2, whereas ILT4 is present in myeloid cells only.13 ILT2 and ILT4 are inhibitory receptors, whereas KIR2DL4 seems capable to transduce both inhibitory and activating signals.14 HLA-G also binds CD160 on NK cells, endothelial cells, and T lymphocytes.13
HLA-G molecules inhibit the cytolytic function of NK cells and T lymphocytes. During pregnancy, decidual NK-cell expression of ILT2 and KIR2DL4 and their interaction with HLA-G expressed and secreted by extravillous cytotrophoblast play a crucial role in protecting semiallogeneic fetal tissues from maternal uterine NK cytolysis.15 In tumors and viral infection, HLA-G overexpression and release by tumor cells and virus-infected cells represent a further mechanism of escape from immune system recognition.16,17
HLA-G molecules inhibit NK cell–mediated cytotoxicity through down-regulation of perforin and Stat3,18 and they also may induce fratricide killing of NK cells.19 More recently, it has been demonstrated that sHLA-G inhibits NK-cell–mediated lysis, impairing actin reorganization and perforin granule polarization toward target cells.20 Moreover, the impaired cytoskeletal reorganization affects CD2 localization in late NK-to-target cell immune synapse.21
Finally, secretion of different cytokines and chemokines by PB and decidual NK cells can be modulated by sHLA-G toward proinflammatory or immunosuppressive cytokine secretion profile, depending on KIR2DL4 or ILT2 engagement by HLA-G molecules.22-25
Here, we have explored the potential role of sHLA-G in the modulation of surface phenotype and function of CD56bright and CD56dim NK-cell subsets. In particular, sHLA-G–treated NK cells were analyzed for (1) modulation of chemokine receptors and chemotaxis, (2) phenotypic and functional modulation of activating or inhibitory NK-cell receptors, and (3) secretion of cytokines and chemokines. Finally, sHLA-G signaling pathways in these NK-cell subsets were investigated.
Methods
Soluble HLA-G production
Soluble HLA-G was produced in 721.221.G1 human lymphoblastoid cell line26 (kindly provided by Dr Francesco Puppo, DIMI, Genoa, Italy). The purity of sHLA-G preparation was assessed by mass spectrometry (see supplemental Methods, available on the Blood Web site; see the Supplemental Materials link at the top of the online article).
Purified sHLA-G was tested at 100 ng/mL. Dose-response experiments were performed using serial dilutions from 100 ng/mL to 6.25 ng/mL. In some experiments, HLA-G1 molecules were aggregated on nanoparticles, previously used to enhance HLA-G bioactivity.27 This experimental model also facilitates anti–HLA-G mAb blocking experiments. Notably, control beads did not affect the expression of receptors here investigated. Results obtained with HLA-G beads and sHLA-G were comparable.
Goat anti–mouse IgG Adembeads (Ademtech) were incubated for 1 hour at room temperature with anti–HLA-G mAb MEM-G/9. After washes, coated beads were incubated overnight at 4°C with HLA-G–containing supernatants (HLA-G beads) or medium (control beads). Nanoparticles were then washed and resuspended in culture medium before being used (3 × 10⁴ beads/cell).
Cell isolation and culture
The study was approved by the Ethical Committee of G. Gaslini Institute, Genoa, Italy. Surgically removed tonsils and normal PB samples were obtained following written informed consent. Mononuclear cells were isolated by Ficoll-Hypaque (Sigma-Aldrich) density gradient.
Total NK cells, CD56bright NK cells, and CD56dim NK cells were isolated from PB samples using NK isolation kit, CD56bright NK-cell isolation kit, and CD16+/CD56+ NK-cell isolation kit, respectively (Myltenyi Biotec), following the manufacturer's protocol.
NK cells were treated in vitro for 24 to 36 hours in RPMI-1640 and 10% FBS at 37°C and 5% CO2 with (1) sHLA-G (100 ng/mL) or medium alone or with (2) HLA-G beads or control beads (3 × 10⁴ nanoparticles/cell) before being analyzed. In some experiments, NK cells were cultured for 24 hours with recombinant human IL-2 (Proleukin; Chiron Italia) at the concentration of 500 IU/mL before being treated with sHLA-G as detailed under “Soluble HLA-G production.”
Antibodies and flow cytometry
Cells were stained with fluorochrome-conjugated mAbs or with isotype and fluorochrome-matched control antibodies, or with unconjugated mAbs followed by fluorochrome-conjugated isotype-specific goat anti-mouse second reagent (see supplemental Methods), and then they were run on a Gallios cytometer (Beckman Coulter). We acquired 104 events that were analyzed using Kaluza software (Beckman Coulter).
Blocking experiments
Blocking experiments with anti–HLA-G mAb were performed by pretreatment of HLA-G beads with anti–HLA-G blocking mAb 87G (Exbio). Beads were incubated with 50 μg/mL 87G mAb 30′ at 37°C and 5% CO2 before being added to cells.
Blocking experiments of the ILT2 receptor were performed by adding 20 μg/mL of anti-ILT2/CD85j blocking antibody (clone 292319; R&D Systems) or isotype-matched control (Invitrogen) 30′ before stimulating cells as described in “Cell isolation and culture.”
Chemotaxis
Chemotaxis was investigated as described under supplemental Methods. The migration index was calculated as follows: (no. of migrated cells/no. of dispensed cells × 100). The migration index obtained with medium alone was subtracted from each corresponding migration index value.
IFN-γ release by NK cells
Cross-linking experiments were performed on total PB NK cells. Plates were coated overnight at 4°C with 100 μL of different monoclonal antibodies: (1) anti-NKp46 activating receptor (2.5 μg/mL), (2) anti-NKG2A inhibitory receptor (2.5 μg/mL), (3) anti-NKp46 + anti-NKG2A, and (4) PBS. Plates were then washed 3 times in PBS. NK cells (previously treated with sHLA-G or medium) were plated at 100 000 cells/well in RPMI-1640 10% FBS + IL12p70 (0.1 ng/mL) and incubated at 37°C and 5% CO2 for 24 hours. Supernatants were then collected and centrifuged at 3000g for 10 minutes. IFN-γ was measured using IFN-γ ELISA set (Immunotools), following the manufacturer's protocol. Samples were tested in triplicate diluted 1:10 in dilution buffer (PBS, 1% FBS, and 0.05% Tween 20). Fold increase of IFN-γ secretion was calculated for each experimental set as follows: (nanogram per milliliter of IFN-γ secreted with specific mAbs/nanogram per milliliter of IFN-γ secreted with irrelevant isotype-matched mAb).
Antibody array
Cytokine production was investigated on supernatants collected from purified PB CD56bright and CD16+/CD56dim NK cells either untreated or treated with sHLA-G, using RayBio Human Cytokine Antibody Array 3 (RayBiotech; supplemental Table 2), following the manufacturer's protocol. Samples were tested after 1:4 dilution in culture medium. Protein levels were quantified by scanning densitometry of the radiography films using VersaDoc 3000 gel imaging system (Bio-Rad Laboratories). Results are expressed as relative density obtained as follows: density of specific spot/mean density of housekeeping proteins spots.
Signaling pathway
sHLA-G signaling pathways were investigated by flow cytometry on total PB NK cells, either untreated or treated with sHLA-G (see supplemental Methods).
Statistics
Statistical analysis was performed using Prism 5.03 software (GraphPad Software). A t test or Mann-Whitney test was used, depending on data distribution. The significance range as follows: *P < .05 (significant), **P < .005, and ***P < .0005.
Results
sHLA-G dampens the expression of different chemokine receptors on NK cells
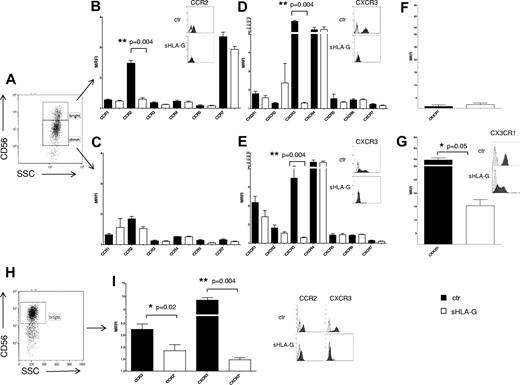
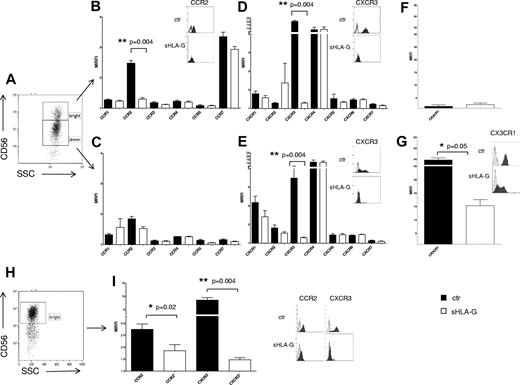
We evaluated by flow cytometry the expression of chemokine receptors on NK cells from PB, gating on CD56bright or CD56dim cell fractions (Figure 1A), after culture in the presence or absence of sHLA-G. Representative histograms of flow cytometric analysis of chemokine receptor expression on CD56bright and CD56dim NK cells are shown in supplemental Figures 1 and 2, respectively.
Modulation of chemokine receptors expression by sHLA-G on PB NK cells. (A-G) Cytofluorimetric analysis of chemokine receptor expression on purified total PB NK cells, gating on CD56bright or CD56dim NK cells. (A) Representative staining with anti-CD56 mAb. CC chemokine receptor expression on CD56bright (B) and CD56dim (C) NK cells, CXC chemokine receptor expression on CD56bright (D) and CD56dim (E) NK cells, and CX3CR1 expression on CD56bright (F) and CD56dim (G) NK cells, either untreated (black bars) or treated with sHLA-G (white bars). Data are expressed as MRFI. Means of 5 different experiments ± SD are shown. Asterisks indicate significant differences. The insets in panels B, D, E, and G show representative stainings of NK cells, ctr, or treated with sHLA-G, with anti-CCR2, anti-CXCR3, and anti-CX3CR1 mAbs, respectively. Black profiles indicate staining with specific mAbs, whereas gray profiles indicate staining with irrelevant isotype-matched mAb. (H-I) Cytofluorimetric analysis of chemokine receptor expression on purified PB CD56bright NK cells. (H) Representative staining with anti-CD56 mAb. (I) CCR2 and CXCR3 expression on CD56bright NK cells untreated (black bars) or treated with sHLA-G (white bars). Data are expressed as MRFI. Means of 5 different experiments ± SD are shown. Asterisks indicate significant differences. The inset shows representative stainings of CD56bright NK cells, ctr, or treated with sHLA-G, with anti-CCR2 and anti-CXCR3 mAbs, respectively. Black profiles indicate staining with specific mAbs, whereas gray profiles indicate staining with irrelevant isotype-matched mAb.
Modulation of chemokine receptors expression by sHLA-G on PB NK cells. (A-G) Cytofluorimetric analysis of chemokine receptor expression on purified total PB NK cells, gating on CD56bright or CD56dim NK cells. (A) Representative staining with anti-CD56 mAb. CC chemokine receptor expression on CD56bright (B) and CD56dim (C) NK cells, CXC chemokine receptor expression on CD56bright (D) and CD56dim (E) NK cells, and CX3CR1 expression on CD56bright (F) and CD56dim (G) NK cells, either untreated (black bars) or treated with sHLA-G (white bars). Data are expressed as MRFI. Means of 5 different experiments ± SD are shown. Asterisks indicate significant differences. The insets in panels B, D, E, and G show representative stainings of NK cells, ctr, or treated with sHLA-G, with anti-CCR2, anti-CXCR3, and anti-CX3CR1 mAbs, respectively. Black profiles indicate staining with specific mAbs, whereas gray profiles indicate staining with irrelevant isotype-matched mAb. (H-I) Cytofluorimetric analysis of chemokine receptor expression on purified PB CD56bright NK cells. (H) Representative staining with anti-CD56 mAb. (I) CCR2 and CXCR3 expression on CD56bright NK cells untreated (black bars) or treated with sHLA-G (white bars). Data are expressed as MRFI. Means of 5 different experiments ± SD are shown. Asterisks indicate significant differences. The inset shows representative stainings of CD56bright NK cells, ctr, or treated with sHLA-G, with anti-CCR2 and anti-CXCR3 mAbs, respectively. Black profiles indicate staining with specific mAbs, whereas gray profiles indicate staining with irrelevant isotype-matched mAb.
As shown in Figure 1B, sHLA-G significantly down-regulated CCR2 expression on CD56bright NK cells (mean relative fluorescence intensity [MRFI] median, 2.51 ± 0.08 vs 1.31 ± 0.04; P = .004), whereas no CC chemokine receptor was modulated on CD56dim NK cells (Figure 1C).
sHLA-G significantly down-regulated CXCR3 expression, both in CD56bright (MRFI median, 21.1 ± 1.51 vs 1.26 ± 0.04; P = .004) and CD56dim (MRFI median, 3.77 ± 0.96 vs 1.31 ± 0.02; P = .004) NK cells (Figure 1D-E, respectively), whereas that of other CXC receptors was unaffected by the same treatment.
As shown in Figure 1G, CX3CR1, whose expression was detected at high levels on PB CD56dim NK cells, was significantly down-modulated by sHLA-G treatment (MRFI median, 41.23 ± 3.83 vs 14.54 ± 2.29; P = .05). Conversely, CX3CR1 expression was low to absent in PB CD56bright NK cells and was not modulated by sHLA-G treatment (Figure 1F).
CCR2 and CXCR3 expression also was tested on purified PB CD56bright NK cells (Figure 1H). Again, sHLA-G significantly down-modulated the expression of both CCR2 (MRFI median, 2.79 ± 0.22 vs 1.65 ± 0.25; P = .02) and CXCR3 (MRFI median, 8.18 ± 0.88 vs 1.46 ± 0.08; P = .004; Figure 1I).
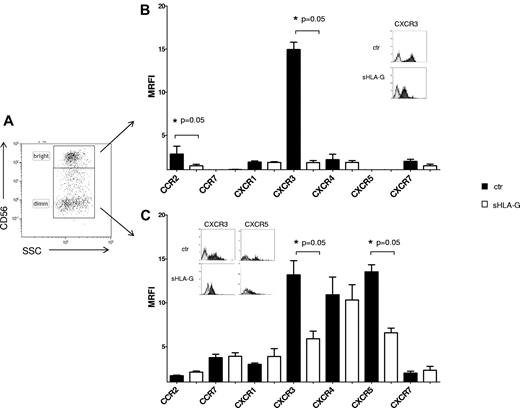
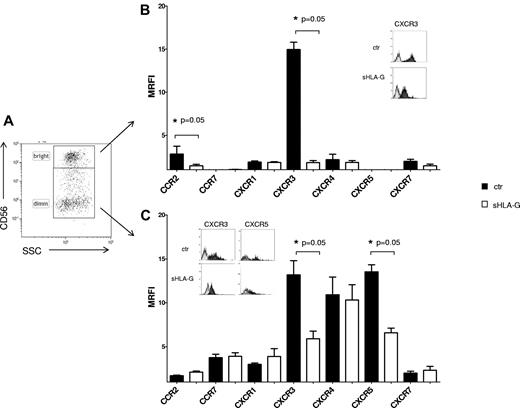
Finally, the expression of chemokine receptors was evaluated on NK cells from tonsil as prototype of a secondary lymphoid organ, gating on CD56bright or CD56dim cells (Figure 2A). sHLA-G significantly down-regulated the expression of CXCR3 both in CD56bright (MRFI median, 14.58 ± 1.62 vs 6.31 ± 0.85; P = .05) and CD56dim (MRFI median, 14.5 ± 0.83 vs 1.96 ± 0.2; P = .05) NK cells (Figure 2B and C, respectively). Moreover, sHLA-G down-regulated expression of (1) CCR2 in CD56bright (MRFI median, 2 ± 0.92 vs 1.61 ± 0.18; P = .05) and (2) CXCR5 in CD56dim NK cells (MRFI median, 12.93 ± 0.8 vs 7.06 ± 0.52; P = .05).
Modulation of chemokine receptor expression by sHLA-G on NK cells from tonsil. Cytofluorimetric analysis of chemokine receptor expression on purified total NK cells from tonsil, gating on CD56bright or CD56dim NK cells on the basis of CD56 expression. (A) Representative staining with anti-CD56 mAb. The expression of chemokine receptors was evaluated on CD56bright (B) and CD56dim (C) NK cells, either untreated (black bars) or treated with sHLA-G (white bars). Data are expressed as MRFI. Means of 5 different experiments ± SD are shown. Asterisks indicate significant differences. The insets in panels B and C show representative stainings of NK cells, ctr, or treated with sHLA-G, with anti-CXCR3 and anti-CXCR5 mAbs. Black profiles indicate staining with specific mAbs, whereas gray profiles indicate staining with irrelevant isotype-matched mAb.
Modulation of chemokine receptor expression by sHLA-G on NK cells from tonsil. Cytofluorimetric analysis of chemokine receptor expression on purified total NK cells from tonsil, gating on CD56bright or CD56dim NK cells on the basis of CD56 expression. (A) Representative staining with anti-CD56 mAb. The expression of chemokine receptors was evaluated on CD56bright (B) and CD56dim (C) NK cells, either untreated (black bars) or treated with sHLA-G (white bars). Data are expressed as MRFI. Means of 5 different experiments ± SD are shown. Asterisks indicate significant differences. The insets in panels B and C show representative stainings of NK cells, ctr, or treated with sHLA-G, with anti-CXCR3 and anti-CXCR5 mAbs. Black profiles indicate staining with specific mAbs, whereas gray profiles indicate staining with irrelevant isotype-matched mAb.
sHLA-G down-regulates expression of CD94/NKG2A on NK cells
Next, we evaluated the effect of sHLA-G treatment on the expression of a panel of NK receptors. These receptors included activating receptors and coreceptors (NKG2D, DNAM-1, NKp30, NKp44, NKp46, NTBA, and 2B4) as well as KIR2DL1/S1, KIR2DL2/L3/S2, KIR2DL4, CD94/NKG2A, and ILT2 inhibitory receptors.
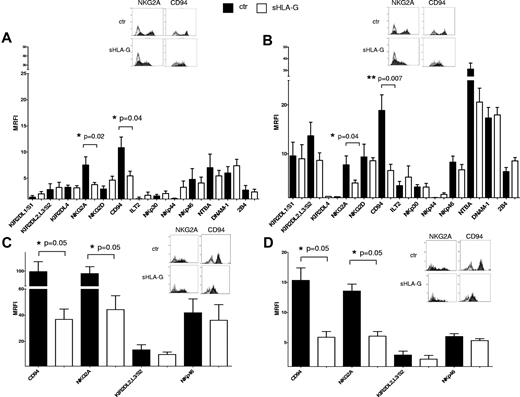
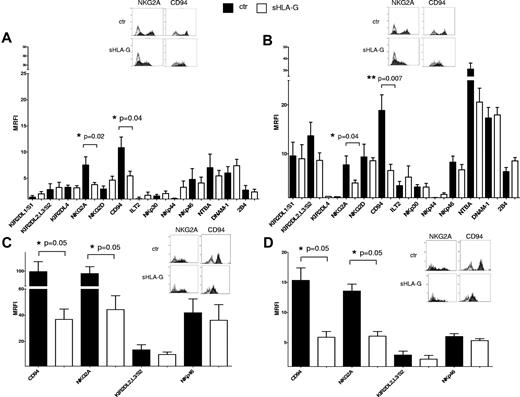
This analysis was performed by flow cytometry, gating on CD56bright and CD56dim NK cells isolated from PB (Figure 3A and B, respectively) or human tonsil (Figure 3C and D, respectively).
Expression of activating and inhibitory receptors on sHLA-G–treated NK cells. Cytofluorimetric analysis of the expression of activatory and inhibitory receptors on purified total NK cells, gating on CD56bright or CD56dim NK cells on the basis of CD56 expression. Expression of NK-cell receptors was evaluated on PB CD56bright (A) and CD56dim NK cells (B) or tonsil CD56bright (C) and CD56dim NK cells (D), either untreated (black bars) or treated with sHLA-G (white bars). Data are expressed as MRFI. Means of 5 different experiments ± SD are shown. Asterisks indicate significant differences. The insets in panels A through D show representative stainings of NK cells, ctr, or treated with sHLA-G, with anti-NKG2A and anti-CD94 mAbs, respectively. Black profiles indicate staining with specific mAbs, whereas gray profiles indicate staining with irrelevant isotype-matched mAb.
Expression of activating and inhibitory receptors on sHLA-G–treated NK cells. Cytofluorimetric analysis of the expression of activatory and inhibitory receptors on purified total NK cells, gating on CD56bright or CD56dim NK cells on the basis of CD56 expression. Expression of NK-cell receptors was evaluated on PB CD56bright (A) and CD56dim NK cells (B) or tonsil CD56bright (C) and CD56dim NK cells (D), either untreated (black bars) or treated with sHLA-G (white bars). Data are expressed as MRFI. Means of 5 different experiments ± SD are shown. Asterisks indicate significant differences. The insets in panels A through D show representative stainings of NK cells, ctr, or treated with sHLA-G, with anti-NKG2A and anti-CD94 mAbs, respectively. Black profiles indicate staining with specific mAbs, whereas gray profiles indicate staining with irrelevant isotype-matched mAb.
sHLA-G treatment down-regulated the expression of CD94/NKG2A heterodimer, both in CD56bright (Figure 3A; NKG2A MRFI median, 7.37 ± 1.57 vs 3.69 ± 0.4, P = .04; CD94 MRFI median, 11,.7 ± 2.05 vs 6.08 ± 0.86, P = .02) and CD56dim (Figure 3B; NKG2A MRFI median, 8.56 ± 1.84 vs 4.42 ± 0.57, P = .04; CD94 MRFI median, 17.79 ± 3.21 vs 7.15 ± 1.21, P = .007) PB NK cells. Representative histograms of flow cytometric analysis of NK-cell receptors expression on PB CD56bright and CD56dim NK cells are shown in supplemental Figures 3 and 4, respectively.
Expression of CD94/NKG2A also was significantly down-regulated by sHLA-G in CD56bright (Figure 3C; NKG2A MRFI median, 78.04 ± 18.30 vs 40.44 ± 10.53, P = .05; CD94 MRFI median, 73.16 ± 26.59 vs 37.48 ± 7.80, P = .05) and CD56dim (Figure 3D; NKG2A MRFI median, 13.04 ± 1.13 vs 6.72 ± 0.77, P = .05; CD94 MRFI median, 14.76 ± 2.05 vs 6.58 ± 0.94, P = .05) tonsil NK cells.
On the contrary, the expression of all the other NK receptors analyzed was not significantly modified by sHLA-G treatment, either in PB or tonsil NK-cell populations.
sHLA-G–mediated down-regulation of chemokine receptors and NK receptors is dose dependent
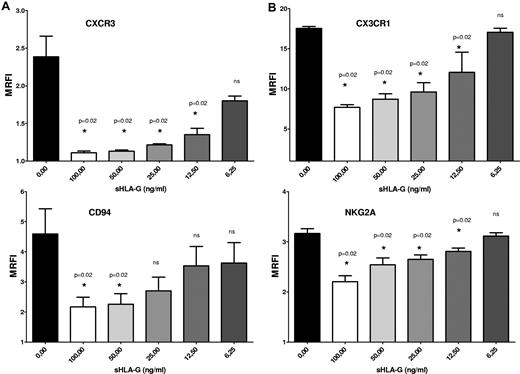
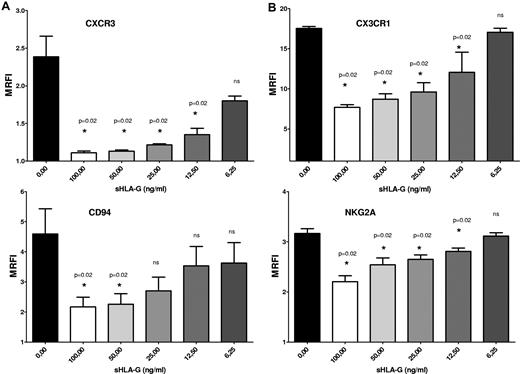
We have tested whether chemokine receptor and NK receptor down-modulation induced by sHLA-G was dose dependent. Total PB NK cells were cultured with medium alone or in the presence of serial dilutions (1:2) of sHLA-G, starting from 100 ng/mL to 6.25 ng/mL. Next, the expression of CXCR3, CX3CR1, CD94, and NKG2A was analyzed by flow cytometry.
CXCR3 (Figure 4A), CX3CR1 (Figure 4B), and NKG2A (Figure 4C) expression on NK cells (MRFI, 2.38 ± 0.27, 17.52 ± 0.24, and 3.16 ± 0.09, respectively) was significantly down-regulated by sHLA-G at 100 ng/mL (MRFI, 1.11 ± 0.02, 7.68 ± 0.68, and 2.2 ± 0.11, respectively; P = .02), 50 ng/mL (MRFI, 1.13 ± 0.01, 2.26 ± 0.34, and 2.54 ± 0.13, respectively; P = .02), 25 ng/mL (MRFI, 1.21 ± 0.01, 9.61 ± 1.16, and 2.65 ± 0.08, respectively; P = .02) and 12.5 ng/mL (MRFI, 1.35 ± 0.08, 12.06 ± 2.5, and 2.81 ± 0.06, respectively; P = .02) but not at 6.25 ng/mL (MRFI, 1.8 ± 0.06, 17.05 ± 0.51, and 3.11 ± 0.06, respectively; P = .02).
Dose–response experiments. Total PB NK cells were treated with serial dilutions (1:2) of sHLA-G (range, 100-6.25 ng/mL). Cytofluorimetric analysis of CXCR3 (A), CX3CR1 (B), CD94 (A), and NKG2A (B) expression was performed. Data are expressed as MRFI. Means of 3 different experiments ± SD are shown. Asterisks indicate significant differences.
Dose–response experiments. Total PB NK cells were treated with serial dilutions (1:2) of sHLA-G (range, 100-6.25 ng/mL). Cytofluorimetric analysis of CXCR3 (A), CX3CR1 (B), CD94 (A), and NKG2A (B) expression was performed. Data are expressed as MRFI. Means of 3 different experiments ± SD are shown. Asterisks indicate significant differences.
CD94 expression (Figure 4C; MRFI, 4.59 ± 0.83) was dampened by sHLA-G at 100 ng/mL (MRFI, 2.17 ± 0.32; P = .02) and 50 ng/mL (MRFI, 2.26 ± 0.34; P = .02) but not at 25 ng/mL (MRFI, 2.70 ± 0.45), 12.5 ng/mL (MRFI, 3.53 ± 0.64), and 6.25 ng/mL (MRFI, 3.62 ± 0.67).
Blocking experiments
To demonstrate unambiguously the role of sHLA-G in the down-modulation of chemokine receptor and NK receptors expression on NK cells, sHLA-G treatment was performed in the presence of an anti–HLA-G (87G) mAb, that blocks the interaction between HLA-G and its receptors.
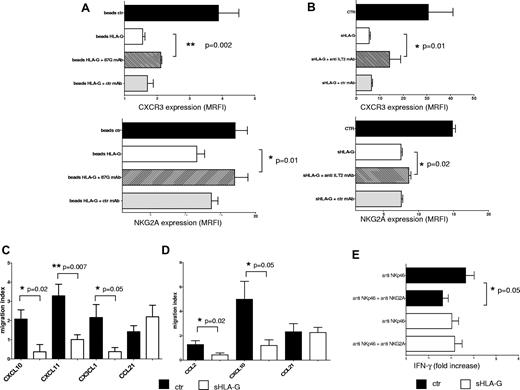
Expression of CXCR3 and NKG2A was evaluated on total PB NK cells that had been treated with (1) control beads, (2) HLA-G beads, and (3) HLA-G beads preincubated with 87G mAb or irrelevant isotype-matched mAb.
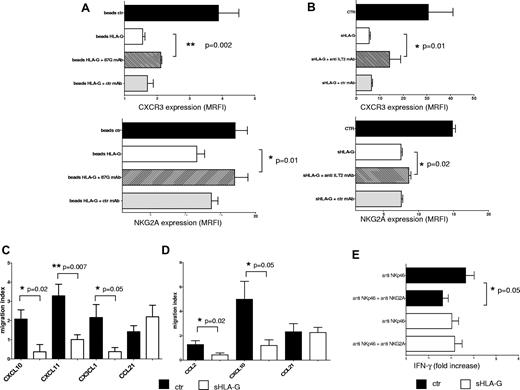
As shown in Figure 5A, HLA-G beads down-regulated the expression of CXCR3 (top) on NK cells, compared with cells treated with control beads (MRFI median, 4.24 ± 0.62 vs 1.49 ± 0.06; P = .002). Preincubation of HLA-G beads with the anti–HLA-G mAb but not with irrelevant isotype-matched mAb significantly restored the expression of CXCR3 (MRFI median, 2.11 ± 0.03 vs 1.49 ± 0.06; P = .002), demonstrating that modulation of CXCR3 expression was mediated by sHLA-G. Similar results were obtained analyzing NKG2A expression (Figure 5A bottom). Indeed, sHLA-G–induced down-regulation of NKG2A expression (MRFI median, 17.08 ± 1.75 vs 11.61 ± 1.11; P = .01) was significantly reverted by preincubation of HLA-G beads with anti–HLA-G mAb (MRFI median, 17.01 ± 1.90 vs 11.61 ± 1.11; P = .01), whereas such effect was not obtained using irrelevant isotype-matched mAb (Figure 5A bottom).
Blocking experiments and functional assays. (A) Total PB NK cells were treated with beads (1) uncoated (ctr; black bars), (2) coated with sHLA-G (beads HLA-G; white bars), (3) coated with sHLA-G and treated with 87G anti–HLA-G blocking mAb (striped bars), or (4) coated with sHLA-G and treated with isotype-matched irrelevant ctr mAb (gray bars) before being admixed with NK cells. Cytofluorimetric analysis of CXCR3 or NKG2A expression has been performed. (B) Blocking experiments performed on total PB NK cells untreated (ctr; black bar) or treated with sHLA-G (white bar) or preincubated with anti-ILT2/CD85j mAb (striped bar) or isotype-matched mAb (gray bar) and then treated with sHLA-G. Cytofluorimetric analysis of CXCR3 or NKG2A expression is shown. Data are expressed as MRFI. Means of 3 different experiments ± SD are shown. Asterisks indicate significant differences. Chemotaxis was performed on total PB NK cells (C) or PB CD56bright NK cells (D), using as chemoattractants (1) CXCL10, CXCL11, CX3CL1, and CCL21 or (2) CCL2, CXCL10, and CCL21, respectively. Data are expressed as migration index (no. of migrated cells/no. of total cells × 100). Means of 5 different experiments ± SD are shown. Asterisks indicate significant differences. (E) IFN-γ secretion by total PB NK cells treated with anti-NKp46 mAb alone or in combination with anti-NKG2A mAb. NK cells were either untreated (black bars) or treated with sHLA-G (white bars) before mAb-mediated cross-linking of NKp46 and/or NKG2A molecules. Data are expressed as IFN-γ fold increase (nanogram per milliliter of IFN-γ secreted by specific mAb-treated cells divided by nanogram per milliliter of IFN-γ secreted by irrelevant isotype-matched treated cells). Means of 3 different experiments ± SD are shown. Asterisks indicate significant differences.
Blocking experiments and functional assays. (A) Total PB NK cells were treated with beads (1) uncoated (ctr; black bars), (2) coated with sHLA-G (beads HLA-G; white bars), (3) coated with sHLA-G and treated with 87G anti–HLA-G blocking mAb (striped bars), or (4) coated with sHLA-G and treated with isotype-matched irrelevant ctr mAb (gray bars) before being admixed with NK cells. Cytofluorimetric analysis of CXCR3 or NKG2A expression has been performed. (B) Blocking experiments performed on total PB NK cells untreated (ctr; black bar) or treated with sHLA-G (white bar) or preincubated with anti-ILT2/CD85j mAb (striped bar) or isotype-matched mAb (gray bar) and then treated with sHLA-G. Cytofluorimetric analysis of CXCR3 or NKG2A expression is shown. Data are expressed as MRFI. Means of 3 different experiments ± SD are shown. Asterisks indicate significant differences. Chemotaxis was performed on total PB NK cells (C) or PB CD56bright NK cells (D), using as chemoattractants (1) CXCL10, CXCL11, CX3CL1, and CCL21 or (2) CCL2, CXCL10, and CCL21, respectively. Data are expressed as migration index (no. of migrated cells/no. of total cells × 100). Means of 5 different experiments ± SD are shown. Asterisks indicate significant differences. (E) IFN-γ secretion by total PB NK cells treated with anti-NKp46 mAb alone or in combination with anti-NKG2A mAb. NK cells were either untreated (black bars) or treated with sHLA-G (white bars) before mAb-mediated cross-linking of NKp46 and/or NKG2A molecules. Data are expressed as IFN-γ fold increase (nanogram per milliliter of IFN-γ secreted by specific mAb-treated cells divided by nanogram per milliliter of IFN-γ secreted by irrelevant isotype-matched treated cells). Means of 3 different experiments ± SD are shown. Asterisks indicate significant differences.
Finally, to investigate whether ILT2, a receptor for HLA-G, was involved in down-modulation of CXCR3 (as reported by Morandi et al28 ) and NKG2A, additional experiments were performed using an anti-ILT2/CD85j blocking mAb. As shown in Figure 5B, sHLA-G–mediated inhibition of CXCR3 (top) and NKG2A (bottom) expression on NK cells was partly but significantly reverted by preincubating these cells with anti-ILT2/CD85j mAb (MRFI median: untreated [ctr], 30.65 ± 10.47 and 14.67 ± 0.44, respectively; sHLA-G, 5.48 ± 0.53 and 7.45 ± 0.2, respectively; sHLA-G + anti-ILT2 mAb, 14.2 ± 4.64 and 8.61 ± 0.29 respectively; P = .01) but not with irrelevant isotype-matched mAb, demonstrating that sHLA-G modulated CXCR3 and NKG2A expression partly through the interaction with ILT2 receptor.
sHLA-G inhibits chemotaxis of NK cells toward CXCL10, CXCL11, CX3CL1, and CCL2
We performed in vitro chemotaxis experiments on total PB NK cells and PB CD56bright NK cells, either untreated or treated with sHLA-G. We used as chemoattractants (1) CXCL10 and CXCL11, the ligands of CXCR3 (which was down-regulated by sHLA-G on both CD56dim and CD56bright PB NK cells); (2) CX3CL1, ligand of CX3CR1 that was down-modulated by sHLA-G on CD56dim NK cells; and (3) CCL2, the ligand of CCR2, that was down-regulated by sHLA-G on CD56bright PB NK cells. CCL21, a ligand of CCR7, that was not modulated by sHLA-G treatment also was tested as a control.
As shown in Figure 5C, sHLA-G significantly inhibited chemotaxis of total PB NK cells toward CXCL10 (migration index median, 1.87 ± 0.48 vs 0 ± 0.37; P = .02), CXCL11 (migration index median, 3.2 ± 0.59 vs 1.07 ± 0.25; P = .007), and CX3CL1 (migration index median, 2.8 ± 0.67 vs 0.27 ± 0.21; P = .05).
Chemotaxis of CD56bright PB NK cells toward CCL2 (migration index median, 1.33 ± 0.31 vs 0.64 ± 0.14; P = .02) and CXCL10 (migration index median, 4.12 ± 1.46 vs 1.18 ± 0.46; P = .05) also was inhibited by sHLA-G treatment (Figure 5D).
Finally, chemotaxis of either total PB NK cells or CD56bright PB NK cells toward CCL21 was unaffected by sHLA-G.
sHLA-G–mediated down-regulation of CD94/NKG2A receptor results in impaired inhibitory function
We tested whether sHLA-G–mediated down-modulation of the inhibitory CD94/NKG2A receptor on NK cells was associated with an impairment of its inhibitory function. To this end, in the presence of suboptimal doses of recombinant IL-12, total PB NK cells (either untreated or treated with sHLA-G) were cultured in wells precoated with an agonistic mAb against the NKp46 activating receptor, alone or in combination with an agonistic mAb against NKG2A (Figure 5E). Culture supernatants were recovered and analyzed for the amount of IFN-γ by ELISA.
As described previously, in untreated NK-cells mAb-mediated cross-linking of NKp46 induced the release of IFN-γ (IFN-γ fold increase, 3.35 ± 0.37) that was significantly reduced by the simultaneous engagement of NKG2A (IFN-γ fold increase, 2.5 ± 0.24; P = .05). Engagement of NKp46 also induced IFN-γ secretion in sHLA-G–treated NK cells (IFN-γ fold increase, 3.13 ± 0.3). In this case however, engagement of NKG2A failed to down-modulate the NKp46-mediated release of IFN-γ (IFN-γ fold increase, 3.15 ± 0.33), indicating that inhibitory activity of NKG2A was dampened by sHLA-G treatment.
sHLA-G–modulated chemokine secretion by CD56dim and CD56bright PB NK cells
We investigated the chemokine secretion pattern of PB purified CD56bright and CD56dim NK cells, either untreated or treated with sHLA-G. Results are expressed as relative density.
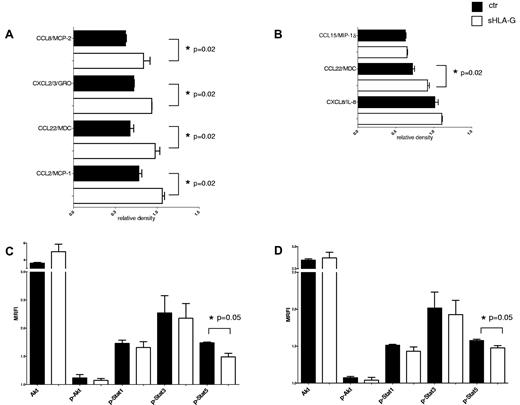
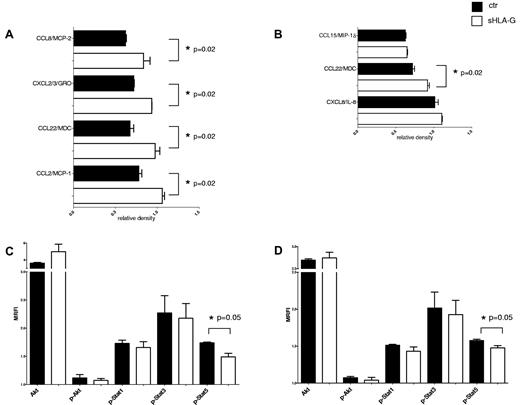
sHLA-G significantly increased the secretion of CCL22/MDC by CD56dim NK cells (Figure 6A; 0.66 ± 0.04 vs 0.97 ± 0.05; P = .02) and CD56bright NK cells (Figure 6B; 0.71 ± 0.02 vs 0.92 ± 0.02; P = .02). Moreover, in CD56dim NK cells sHLA-G significantly augmented the secretion of CCL2/MCP-1 (0.76 ± 0.03 vs 1.05 ± 0.02; P = .02), CXCL2-CXCL3/GRO (0.71 ± 0.005 vs 0.93 ± 0.001; P = .02), and CCL8/MCP-2 (0.62 ± 0.02 vs 0.83 ± 0.07; P = .02).
Modulation of cytokine and chemokine secretion and signal transduction by sHLA-G. Cytokine and chemokine secretion was assessed on supernatants from purified PB CD56dim and CD56bright NK cells by antibody array. Means of 3 different experiments ± SD for modulated cytokines and chemokines are shown in panel A (CD56dim NK cells) and panel B (CD56bright NK cells). Black bars indicate untreated NK cells, whereas white bars indicate NK cells treated with sHLA-G. Data are expressed as relative density (density of specific spot/ mean of density of housekeeping proteins spot). Asterisks indicate significant differences. Analysis of signal transduction was performed on total PB NK cells either untreated (black bars) or treated with sHLA-G (white bars), gating on CD56bright (C) and CD56dim (D) NK cells. Results are expressed as MRFI. Means of 3 different experiments ± SD are shown. Asterisks indicate significant differences.
Modulation of cytokine and chemokine secretion and signal transduction by sHLA-G. Cytokine and chemokine secretion was assessed on supernatants from purified PB CD56dim and CD56bright NK cells by antibody array. Means of 3 different experiments ± SD for modulated cytokines and chemokines are shown in panel A (CD56dim NK cells) and panel B (CD56bright NK cells). Black bars indicate untreated NK cells, whereas white bars indicate NK cells treated with sHLA-G. Data are expressed as relative density (density of specific spot/ mean of density of housekeeping proteins spot). Asterisks indicate significant differences. Analysis of signal transduction was performed on total PB NK cells either untreated (black bars) or treated with sHLA-G (white bars), gating on CD56bright (C) and CD56dim (D) NK cells. Results are expressed as MRFI. Means of 3 different experiments ± SD are shown. Asterisks indicate significant differences.
sHLA-G affects phosphorylation of Stat5
Finally, we investigated the expression of proteins involved in signal transduction in NK cells, either untreated or treated with sHLA-G, gating on CD56bright or CD56dim cell fractions as described “sHLA-G–modulated chemokine secretion by CD56dim and CD56bright PB NK cells. ” In particular, we evaluated the phosphorylation of (1) Akt that is crucial for cell cycle progression and (2) Stat1, Stat3, and Stat5 that regulate the transcription of several genes.29
sHLA-G significantly down-regulated the expression of phosphorylated (p)-Stat5, both in CD56bright (Figure 6C; MRFI median, 1.57 ± 0.01 vs 1.48 ± 0.03; P = .05) and in CD56dim NK cells (Figure 6D; MRFI median, 1.75 ± 0.01 vs 1.47 ± 0.06; P = .05) NK cells. p-Akt (as well as Akt), p-Stat1, and p-Stat3 were not affected by sHLA-G treatment.
Discussion
In this study, we investigated for the first time sHLA-G–mediated modulation of expression and function of different molecules related to NK-cell activity.
We demonstrated previously that sHLA-G inhibited chemotaxis of different T-cell subsets through the down-regulation of the expression of different chemokine receptors.28 Here, we report that sHLA-G modulated expression and function of different chemokine receptors on CD56bright and CD56dim resting NK cells. Similar results were obtained using NK cells from PB and tonsil, tested as prototype of secondary lymphoid organ. Likewise, the effects of sHLA-G on IL-2–activated CD56bright and CD56dim NK cells were similar to those detected with the corresponding resting cell fractions (see supplemental Methods).
sHLA-G significantly down-regulated CXCR3 expression both in CD56bright and CD56dim NK cells and impaired their migration toward CXCL10 and CXCL11 that together with CXCL9 are ligands of this receptor.30 CXCR3 drives NK-cell migration to inflamed tissues, in particular during viral infections, thereby promoting NK cell–mediated lysis of virus-infected cells and leading to the resolution of viral infection. Indeed, dysregulation of CXCR3 signaling impairs antiviral responses in vivo.31 Moreover, CXCR3 is essential, in association with CXCR4, for CD56bright NK-cell recruitment to the endometrium during the menstrual cycle and in the decidua during pregnancy.32 Furthermore, CD56bright NK cells recruited through CXCR3 engagement in psoriatic skin are key players in the pathogenesis of psoriasis.33 Similarly, in allergic contact dermatitis CD56bright NK cells are recruited, mainly through CXCR3, to the skin where they release type-1 cytokines that induced apoptosis of keratinocytes.34
Our data suggest that high levels of serum sHLA-G that have been detected in patients with solid or hematologic tumors and viral infections13 might impair NK-cell migration to inflamed tissues through down-modulation of CXCR3 expression and chemotaxis to CXCL9, CXCL10, and CXCL11. Reduced recruitment of NK cells would translate into lower NK activity against virus-infected or tumor cells. In contrast, decreased levels of serum sHLA-G observed in patients with different autoimmune and inflammatory diseases might facilitate migration of NK cells to inflamed tissues, leading to disease exacerbations and tissue damage.4,35,36
We also have demonstrated that sHLA-G down-regulated CCR2 expression in PB and tonsil CD56bright NK cells and impaired their migration toward CCL2. CCR2 plays an important role in the recruitment of NK cells to inflamed tissues during viral infection and tuberculosis.37,38 Moreover, infiltration of NK cells in a mouse model of established metastatic tumors was mediated by CCL2–CCR2 interaction.39 Again, we can speculate that high levels of serum sHLA-G might reduce the migration of CD56bright NK cells to the site of inflammation, thereby leading to impaired antiviral or antitumor immune responses.
CX3CR1, the receptor for CX3CL1 (fractalkine), is highly expressed on CD56dim but not on CD56bright NK cells. It has been demonstrated that CX3CL1 is preferentially expressed and released in Th1-mediated disorders, such as psoriasis and granulomatous lymphadenitis induced by Mycobacterium tuberculosis. NK cells are recruited through CX3CR1–CX3CL1 interaction to the site of inflammation, together with Th1 cells that also express CX3CR1 at high levels. Corecruitment of NK cells and Th1 T cells results in the amplification of Th1 responses.40 Moreover, CX3CR1 drives NK-cell migration toward inflamed tissues during multiple sclerosis41 and rheumatoid arthritis.42 Finally, CX3CR1 has a pivotal role in the recruitment of activated cytotoxic NK cells to the tumor. Indeed, defective antitumor responses detected in CX3CR1−/− mice have been correlated with reduced NK-cell migration to the tumor microenvironment.43
Our data suggested that high serum levels of sHLA-G, through down-modulation of CX3CR1 expression and inhibition of NK-cell migration toward CX3CL1, might affect NK-cell recruitment in different pathologic conditions. This effect may translate into an amelioration of Th1–mediated inflammatory diseases and autoimmune diseases, but, alternatively, may impair NK cell–mediated antitumor responses.
Surprisingly, we found that CXCR5 expression was down-regulated by sHLA-G on CD56dim NK cells from tonsil but not from PB. Although the reason(s) for this discrepancy is unknown, it is conceivable that the proinflammatory environment typical of surgically removed tonsils may synergize with sHLA-G in down-regulation of CXCR5 expression.
Inhibitory activities of HLA-G molecules (both membrane-bound and soluble isoforms) on NK cell–mediated lysis have been reported previously.15,20-25 However, the potential modulation of activating and inhibitory NK receptors induced by HLA-G has never been investigated.
In this study, we demonstrate that sHLA-G did not affect the expression of activating NK receptors and coreceptors (NKp30, NKp44, NKp46, NKG2D, NTBA, 2B4, and DNAM-1) and KIR2DL1/S1, KIR2DL2,L3/S2, KIR2DL4, and ILT2/CD85j inhibitory receptors on CD56bright and CD56dim NK cells from PB and tonsils. In another experimental model, sHLA-G was found to boost expression of its own receptor ILT2/CD85j,44 a finding that was not confirmed by our study and by another published study.28 This is probably because of different cell types used as targets for sHLA-G, the different experimental settings, or both.
Surprisingly, sHLA-G induced a phenotypical and functional down-regulation of CD94 and NKG2A molecules that associate to form the heterodimeric receptor CD94/NKG2A, and CD94/NKG2A binds HLA-E molecule.45 HLA-E, like HLA-G, belongs to HLA-Ib subfamily. The physiologic role of HLA-E is to bind peptides derived from the leader sequence of other HLA class I molecules and to present them to NK cells through interaction with CD94/NKG2A receptor, thus allowing NK cells to monitor the expression of HLA-class I molecules on target cells. In fact, the interaction between HLA-E and CD94/NKG2A inhibits NK-cell mediated lysis of HLA-E+ target cells.45 It is tempting to speculate that sHLA-G performed a “negative feedback” on NK cells, rendering NK cells that have been previously sensitized to sHLA-G less prone to be subsequently inhibited by HLA-E molecule. It has been demonstrated that nonapeptides derived from HLA-G leader peptide are loaded on HLA-E molecules.46 When HLA-G is overexpressed, ie, in tumor cells, the augmented generation of HLA-G–derived nonapeptides leads to surface HLA-E up-regulation. In tumor cells, HLA-G can inhibit NK-cell functions directly or indirectly through the up-regulation of HLA-E that inhibits NK cell–mediated lysis by interacting with CD94/NKG2A.47 Although this is true for surface HLA-G on target cells that express both HLA-G and HLA-E, it is conceivable that sHLA-G behaves differently from the surface molecule. Conversely, in physiologic conditions, HLA-E molecules loaded with HLA-G–derived nonapeptides are preferentially recognized by NK cells through CD94/NKG2C activating receptor.48 In this view, our finding that sHLA-G can down-modulate CD94/NKG2A expression on NK cells may be relevant in the process of tolerance breaking that occurs during cytotrophoblast implantation.48
We have demonstrated that down-regulation of chemokine receptors and NK receptors induced by sHLA-G is dose dependent. Notably, such effect was achieved at high concentration of sHLA-G, similar to sHLA-G serum levels detected in pathologic conditions, but not at concentration similar to physiologic HLA-G serum levels.
Results on HLA-G–induced modulation of cytokine and chemokine secretion by NK cells are still contradictory. Li et al22 have demonstrated that sHLA-G induced proinflammatory and proangiogenic factor release in decidual CD56+ NK cells through KIR2DL4 ligation. Similar results have been obtained by van der Meer et al24 that have demonstrated an increased secretion of the proinflammatory cytokines TNF-α and IFN-γ by PB and uterine NK cells induced by sHLA-G. Moreover, Rajagopalan et al25 have demonstrated that sHLA-G induced release of proinflammatory cytokines and chemokines in resting NK cells. In contrast, Morel et al23 have demonstrated that HLA-I molecules (including HLA-G) down-modulate IFN-γ secretion by NK cells through ILT2/CD85j ligation.
We have here analyzed for the first time differential effects of sHLA-G on cytokine and chemokine secretion in purified CD56bright and CD56dim PB NK cells. CCL22/MDC secretion was increased by sHLA-G treatment both in CD56dim and CD56bright NK cells. These data may be relevant, because it has been demonstrated previously that up-regulation of CCL22 secretion by NK cells may augment the recruitment of regulatory T cells in tumor microenvironment of Lewis lung carcinoma, leading to the establishment of an immune-suppressive microenvironment.49 Chemokine secretion seems to be more affected by sHLA-G treatment in CD56dim than in CD56bright NK cells. In fact, sHLA-G also increased the secretion of MCP-1 (CCL2), MCP-2 (CCL8), and GRO chemokines (CXCL2 and CXCL3) by CD56dim NK cells.
Finally, we evaluated the expression of proteins involved in signal transduction. We have demonstrated that sHLA-G induced p-Stat5 down-regulation both in CD56dim and CD56bright NK cells, leading to deregulation of the transcription of several genes. These data are in line with our previous study on T lymphocytes, in which we have demonstrated that sHLA-G down-regulated Stat5 phosphorylation through an increased phosphorylation of the protein phosphatase SHP-2,28 and another study showing that sHLA-G down-regulated JAK2, Stat3, and Stat5 phosphorylation in erythroid cells.50 The reasons why, at variance with a previous report,18 we did not detect any difference in p-Stat3 expression in CD56dim or CD56bright NK cells on treatment with sHLA-G or medium are unknown, but they may be related to the different sources of NK cells tested.
Signal transduction initiated by sHLA-G in CD56dim and CD56bright NK cells probably involves additional pathways beside that related to Stat5 phosphorylation. Furthermore, posttranscriptional mechanisms may control the expression in NK cells of the molecules investigated here. Such mechanisms may be especially relevant in for CCR2, whose expression was differentially regulated by sHLA-G in CD56dim and CD56bright NK cells.
In conclusion, our data delineate novel aspects of the control of NK-cell function operated by sHLA-G molecules that may have important implications in disease pathogenesis. In particular, sHLA-G (1) down-modulated expression of CXCR3, CX3CR1, and CCR2 and migration toward their specific ligands that might impair NK-cell recirculation and function; (2) modulated the expression and function of the CD94/NKG2A receptor, possibly preventing HLA-E–mediated inhibition in sHLA-G–sensitized NK cells through a negative feedback; and (3) modulated cytokine and chemokine secretion by NK cells, perhaps impacting on the recruitment of different cell population, such as regulatory T cells.49
The online version of this article contains a data supplement.
The publication costs of this article were defrayed in part by page charge payment. Therefore, and solely to indicate this fact, this article is hereby marked “advertisement” in accordance with 18 USC section 1734.
Acknowledgments
The authors thank Dr Soldano Ferrone for providing the NAMB-1 monoclonal antibody and Camilla Valentino for excellent secretarial assistance.
This work has been supported by Ministero del Lavoro, della Salute e delle Politiche Sociali (Progetti di Ricerca Corrente) and Progetto Strategico RFPS-2006-3-340007, investigator grant (10 643), and special project 5X1000 (9962) from Associazione Italiana per la Ricerca sul Cancro (AIRC).
Authorship
Contribution: F.M. designed the research, performed most of the experiments, analyzed data, and wrote the paper; E.F. and A.P. performed some experiments; R.C., C.B., and A.D. provided some reagents, performed some experiments, analyzed data, and wrote the manuscript; and V.P. designed the study, analyzed data, and wrote the manuscript.
Conflict-of-interest disclosure: The authors declare no competing financial interests.
Correspondence: Fabio Morandi, Laboratory of Oncology, G. Gaslini Institute, Largo G. Gaslini 5, 16148 Genova, Italy; e-mail: fabiomorandi@ospedale-gaslini.ge.it.

