Abstract
The cell lineage origin of IFN-producing killer dendritic cells (IKDCs), which exhibit prominent antitumoral activity, has been subject to debate. Although IKDCs were first described as a cell type exhibiting both plasmacytoid DC and natural killer (NK) cell properties, the current view reflects that IKDCs merely represent activated NK cells expressing B220, which were thus renamed B220+ NK cells. Herein, we further investigate the lineage relation of B220+ NK cells with regard to other NK-cell subsets. We surprisingly find that, after adoptive transfer, B220− NK cells did not acquire B220 expression, even in the presence of potent activating stimuli. These findings strongly argue against the concept that B220+ NK cells are activated NK cells. Moreover, we unequivocally show that B220+ NK cells are highly proliferative and differentiate into mature NK cells after in vivo adoptive transfer. Additional phenotypic, functional, and transcriptional characterizations further define B220+ NK cells as immediate precursors to mature NK cells. The characterization of these novel attributes to B220+ NK cells will guide the identification of their ortholog in humans, contributing to the design of potent cancer immunotherapies.
Introduction
Natural killer (NK) cells are large granular lymphocytes that were first described for their capacity to spontaneously eliminate tumor cells and virus-infected cells without prior sensitization.1 These functions are mediated by an array of Ig-like and C-type lectin receptors that deliver both activating and inhibitory signals.1 In addition to their cytotoxic activity, NK cells rapidly produce vast amounts of cytokines, such as IFN-γ, as well as other cellular mediators, including chemokines. NK cells thus act as an important first line of defense in the early control of virus infection, in tumor immunosurveillance, and in immunoregulation.
The differentiation of NK cells from hematopoietic stem cells in the BM is incompletely understood, but it is thought to occur in a sequential manner that involves multiple stages of development that is based on phenotype, function, and turnover.2 The first committed NK-cell precursor (NKP) is characterized by CD122+ expression in the absence of the expression of other lineage markers,3 although a pre-NKP cell lacking CD122 expression has recently been characterized as a NK cell–committed progenitor preceding NKP in the differentiation stages.4 NKPs subsequently give rise to immature NK (iNK) cells that express CD122 along with NK1.1 and CD94/NKG2. As iNK cells differentiate further, they undergo education to achieve their full functional competence, and they acquire CD49b expression to finally become mature NK (mNK) cells.2 These CD49b+ mNK cells still compose a heterogeneous cell population that may be segregated according to their phenotype, function, and tissue distribution. Indeed, functional maturation of CD49b+ mNK cells proceeds along 4 stages from the CD11b−CD27− to the CD11b−CD27+ then to the CD11b+CD27+ and finally to the CD11b+CD27− subset.5 Several other markers are acquired along this differentiation process, including CD43, CD94-NKG2, and Ly49 receptors.5-7 Finally, on activation, mNK cells gain the expression of additional activation markers, namely CD69, CD44, FasL, CD86, and MHC II.8-12 In addition, activated mNK cells increase in size and show heightened functional properties such as an enhanced cytolytic potential and increased ability to produce cytokines.2
Notably, activated mNK cells show a striking phenotypic resemblance to the IFN-producing killer dendritic cells (IKDCs), which were initially described as a hybrid cell type exhibiting properties of both mNK cells and plasmacytoid DCs (pDCs).13,14 Indeed, as for mNK cells, IKDCs expressed various mNK-cell markers, including CD49b, they produced vast amounts of IFN-γ, they showed prominent in vitro cytolytic activity, and they were more efficient than mNK cells at eliminating tumors in vivo.13,14 By analogy to pDCs, IKDCs exhibited a CD11clowB220+ phenotype, they were shown to produce IFNα as well as present Ags to T cells. Yet the pDC properties associated with IKDCs were readily debated. For one, mNK cells exhibit low levels of CD11c,15 whereas the expression of B220 and MHC II can be up-regulated on mNK cells, at least on in vitro activation.9,12 Secondly, several groups could not replicate the finding that IKDCs produced IFNα,16-19 suggesting that the IKDC preparation in the original studies13 may have been contaminated with pDCs. Finally, 3 independent groups found that cells exhibiting the IKDC phenotype were part of the NK lineage and challenged the idea that these cells also exhibit DC properties.9,16-18 Together, these groups found that, as for mNK cells, IKDCs depended on IL-15 for their differentiation, exhibited spontaneous cytotoxic activity toward target cells, and produced vast amounts of IFN-γ after stimulation. Of relevance, they also found that, as opposed to pDCs, IKDCs were independent of Flt-3L for their differentiation and did not express PU.1. Moreover, both mNK cells and IKDCs depended on Id2 for differentiation,19 and the Ag presentation potential of IKDCs to T cells was also challenged.9,16 Together, these observations prompted a redefinition of IKDCs as an NK-cell subset rather than a pDC/NK cell hybrid cell type. Consequently, cells carrying the IKDC phenotype are now more commonly referred to as activated B220+ NK cells.18 Nevertheless, the exact lineage relation of B220+ NK cells, which arguably present with the most efficient antitumoral potential relative to other mNK-cell subsets,14,16,20-22 has yet to be determined.
Herein, we address the biological relationship between B220+ NK cells and mNK cells. We show that mNK cells do not acquire B220 expression in vivo, even in the presence of activating stimuli. Rather, we show that B220+ NK cells are immediate precursors to mNK cells. Thus, this study reveals a new role for B220+ NK cells as an intermediate in the differentiation of mNK cells in vivo.
Methods
Mice
Eight- to 12-week-old mice were used for all the experiments. C57BL/6 mice were purchased from The Jackson Laboratory. B6.SJL and B6.Rag1−/− mice were maintained at the Maisonneuve-Rosemont Hospital housing facility. Studies were approved by the Maisonneuve-Rosemont Hospital Ethics Committee and were overseen by the Canadian Council for Animal Protection.
Antibodies
The following Abs were purchased from BioLegend or eBioscience: CD3e (17A2), CD19 (6D5), CD11c (N418), B220 (RA3-6B2), CD49b (DX5), CD122 (5H4), CD11b (M1/70), CD27 (LG.3A10), NKp46 (29A1.4), CD2 (RM2-2), CD69 (H1.2F3), CD45.1 (A20), and CD45.2 (104). NK1.1 (PK136) was obtained from BD Biosciences. Abs against signaling lymphocytic activation molecule (SLAM)–associated protein (SAP) and SLAMs (CD84, CRACC, 2B4, Ly108) and CD43 (S7) were produced in the laboratory.
Cell preparation and flow cytometry
Spleens were mechanically disrupted through a 70-μm sterile cell strainer (BD Biosciences) and treated with NH4Cl; 2.4G2 was added before staining with specific Abs. Data were acquired with the use of a LSRII flow cytometer (BD Biosciences) or FACSCalibur (BD Biosciences) and analyzed with FlowJo Version 7.6 software (TreeStar). Dead cells, doublets, and autofluorescence were electronically excluded during the analysis. CD19+ and CD3+ were also excluded to analyze NK cells in C57BL/6 mice. Intracellular staining for SAP was performed with the use of the BD Biosciences Cytofix/Cytoperm Kit. Cell sorting was performed on the FACS Aria III. B220+ NK cells were gated as CD11clow B220+ CD49b+ cells, CD27+ NK cells as CD11c−/low B220− CD49b+ CD27+, and CD27− NK cells as CD11c−/low B220− CD49b+ CD27−. Cell purities were routinely > 90%.
Adoptive transfer
B6.SJL (CD45.1) sorted spleen cells were adoptively transferred into C57BL/6 (CD45.2) mice or B6.Rag1−/− (CD45.2) mice through tail vein injections. In vivo activation of NK cells was achieved with intraperitoneal injections of either 200 μg/mouse of polyinosinic-polycytidylic acid (poly I:C; Sigma) or 100 μg of anti-CD40 Ab in mice weighing 25 g (Bio X Cell; clone FGK45) 24 hours after cell injections. Cells were analyzed 5 or 15 days after transfer; 18 hours, 3 days, and 5 days after poly I:C injection; or 40 hours, 3 days, and 5 days after anti-CD40 treatment.
Cytotoxic assay
For 51Cr release lysis assay, 5000 target YAC-1 cells were incubated at 37°C for 1.5 hours with 50 μCi (1.85 MBq) of sodium chromate (Perkin-Elmer) and washed before the addition of effector cells at various ratios. B220+, CD27+, and CD27− NK effector cells were sorted from the spleen of mice injected with poly I:C 18 hours earlier. Effector and target cells were incubated together for 4 hours at 37°C. All effector/target cell ratios were conducted in duplicate or triplicate.
BrdU incorporation
Mice were injected intraperitoneally with 1 mg of BrdU (Sigma-Aldrich) on day 0 and given 1 g/L BrdU in the drinking water, which was replaced every 3 or 4 days. Cells were fixed, permeabilized, treated with DNAse (Sigma-Aldrich), and stained with anti-BrdU Ab (BD Biosciences).
Measurement of cell cycle
Total CD49b+ cells (10 000) and 10 000 B220+, CD27+, or CD27− NK cells from C57BL/6 mice were sorted directly in modified Krishan buffer (0.1% sodium citrate; [Sigma-Aldrich], 0.3% NP-40 [MP Biomedicals], 0.05 mg/mL propidium iodide [BD Biosciences], and 0.02 mg/mL RNAse A [US Biologic]),23,24 vigorously vortexed, and incubated on ice for 15 minutes before data acquisition at low speed with the use of a FACSCalibur (BD Biosciences).
Transcriptome profiling
Spleen cells from 8 to 10 B6.Rag1−/− mice were stained, and B220+ NK cells were sorted on FACS Aria III according to the following phenotype, namely CD11clow B220+ CD122+, whereas CD27+ and CD27− NK-cell subsets were sorted according to B220−CD11c−/lowCD122+ phenotype and are further separated according to CD27 expression. On sorting, cells were immediately centrifuged and resuspended in Trizol reagent (Applied Biosystems). RNA was extracted with the use of the QIAGEN RNeasy kit. Microarray experiments were performed with Illumina Mouse Whole Genome Expression BeadChips Version 2.0, which contain 50-mer probes targeting 42 282 transcripts. Probe data were exported from Illumina BeadStudio as raw data and screened for quality. Gene expression data were analyzed with Bioconductor packages (http://www.bioconductor.org/) and R statistical language (www.r-project.org). Bioconductor limma package was used to log2-transform, quantile-normalize, and filter the probe intensities.25 A filter was applied to filter out probes with low expression and with insufficient variation in expression across all samples tested. Probes retained after this filtering process presented average intensities and variation greater than the median intensity and the median standard variation across all probes in all samples. Probe data were converted to gene data by averaging intensities when > 1 probe was associated with a given gene. The resulting matrix showing genes as rows and samples as columns was used as input for linear modeling with the use of the method available in limma which uses a moderated t statistic to assess significance.25 Two contrasts were evaluated (CD27+ vs B220+, CD27− vs B220+), and P values from the resulting comparison were adjusted for multiple testing according to the method of Benjamini and Hochberg to control the false discovery rate. In addition to the moderated t statistic, limma provides the moderated F statistic that combines the t statistics for all the contrasts into an overall test of significance for a given gene.25 Genes presenting an adjusted P value < .05 for this test and a fold change > 1.5 or lower than −1.5 in 1 of the 2 conditions were kept for clustering analysis. Hierarchical clustering was performed in R Version 2.12.1 and TMeV Version 4.6.2 software on z-transformed data (Euclidean distance with complete linkage).26 Enrichment analysis was performed with the Database for Annotation, Visualization and Integrated Discovery (DAVID; http://david.abcc.ncifcrf.gov/).27 Microarray data have been deposited at the National Center for Biotechnology Information repository for Gene Expression Omnibus under Accession no. GSE34237 (http://www.ncbi.nlm.nih.gov/geo).
Results
B220 does not define an activation marker on mNK cells in vivo
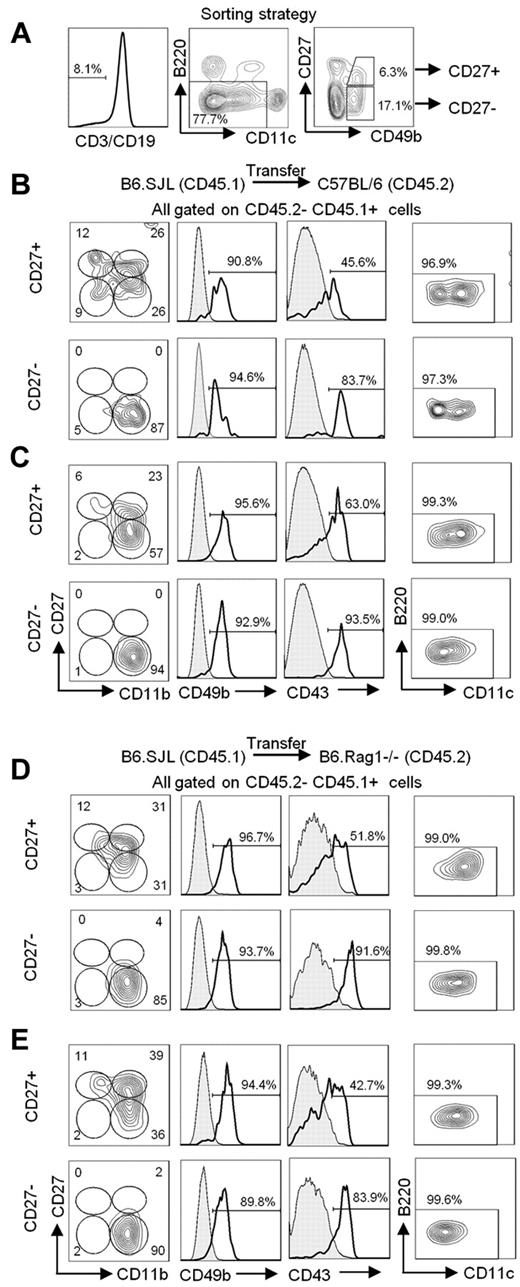
We argued that, if B220+ NK cells (formerly known as IKDCs) occur in vivo as a result of NK-cell activation, the spontaneous occurrence of B220+ NK cells in uninfected mice should be derived in vivo from a mature NK-cell subset responding to endogenous signals. To test this hypothesis, we sorted B220− mNK cells according to CD27 expression, namely CD27+ and CD27− NK cells, from a B6.SJL (CD45.1) mouse and transferred each of these mNK-cell subsets into C57BL/6 (CD45.2) recipient mice (Figure 1A). We opted to select mNK-cell subsets on the basis of CD27 expression because it defines distinct functional maturation stages in both mouse and humans.28-30 Five days after transfer, we found that both mNK-cell subsets had maintained their original cell surface phenotype, although the CD27+ NK cells had begun to down-regulate CD27 expression (Figure 1B), in agreement with their known differentiation process.5 The differentiation of CD27+ NK cells was most evident at 15 days after transfer, when most of the transferred mNK cells exhibited a CD27− phenotype and had up-regulated CD43 expression (Figure 1C).5,6 Surprisingly, neither the CD27+ nor the CD27− transferred NK cells up-regulated B220 within the 15-day time frame, a timeline corresponding to the half-life of NK cells.31 Because only a low proportion of B220+ NK cells is detectable in the spleen of C57BL/6 mice, we opted to evaluate whether the detection of B220 acquisition by mNK cells would be more sensitive in B6.Rag1−/− mice, wherein we find a sizeable proportion of B220+ NK cells as a consequence of the absence of T and B cells (supplemental Figure 1, available on the Blood Web site; see the Supplemental Materials link at the top of the online article). Notwithstanding, as for C57BL/6 mice, neither CD27+ nor CD27− NK cells were found to up-regulate B220 after transfer into B6.Rag1−/− mice (Figure 1D-E). These results suggest that neither CD27+ nor CD27− mNK cells spontaneously acquire B220 expression in vivo during steady state conditions, even if B220+ NK cells can be readily identified in the lymphoid organs.
mNK cells do not acquire B220 expression in vivo. (A) Gating strategy used to sort mNK-cell subsets from the spleen of B6.SJL mice. Sorted cells are CD3− CD19− CD11c−/low B220− CD49b+ and either CD27+ or CD27−. Cell purity was routinely > 93% for each cell type. (B-E) The CD27+ and CD27− mNK-cell subsets sorted from the spleen of B6.SJL (CD45.1) mice were adoptively transferred into (B-C) C57BL/6 (CD45.2) mice or (D-E) B6.Rag1−/− (CD45.2) through tail vein injections. The spleen cells were analyzed (B,D) 5 and (C,E) 15 days after transfer. The expression of CD11b, CD27, CD49b, CD43, CD11c, and B220 on CD45.1+ CD45.2− transferred cells is shown. Bold histograms represent the level of expression of CD49b or CD43 marker on the indicated cell population. Shaded histograms represent the expression level of CD49b on host B cells (B-C) or on host dendritic cells (D-E). Shaded histograms represent the expression level of CD43 on host B cells (B-C) or on host CD11clowB220+CD11b− (D-E). Results are representative of ≥ 3 independent experiments.
mNK cells do not acquire B220 expression in vivo. (A) Gating strategy used to sort mNK-cell subsets from the spleen of B6.SJL mice. Sorted cells are CD3− CD19− CD11c−/low B220− CD49b+ and either CD27+ or CD27−. Cell purity was routinely > 93% for each cell type. (B-E) The CD27+ and CD27− mNK-cell subsets sorted from the spleen of B6.SJL (CD45.1) mice were adoptively transferred into (B-C) C57BL/6 (CD45.2) mice or (D-E) B6.Rag1−/− (CD45.2) through tail vein injections. The spleen cells were analyzed (B,D) 5 and (C,E) 15 days after transfer. The expression of CD11b, CD27, CD49b, CD43, CD11c, and B220 on CD45.1+ CD45.2− transferred cells is shown. Bold histograms represent the level of expression of CD49b or CD43 marker on the indicated cell population. Shaded histograms represent the expression level of CD49b on host B cells (B-C) or on host dendritic cells (D-E). Shaded histograms represent the expression level of CD43 on host B cells (B-C) or on host CD11clowB220+CD11b− (D-E). Results are representative of ≥ 3 independent experiments.
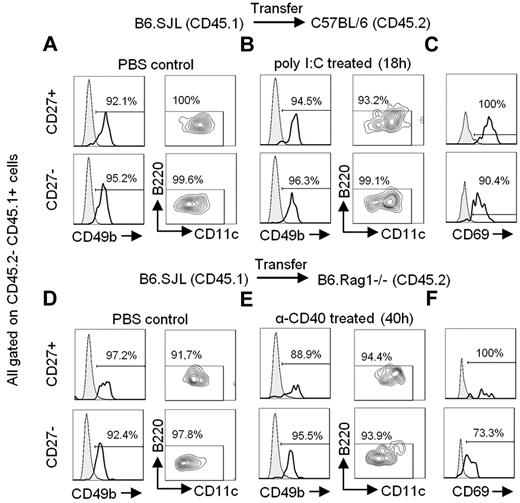
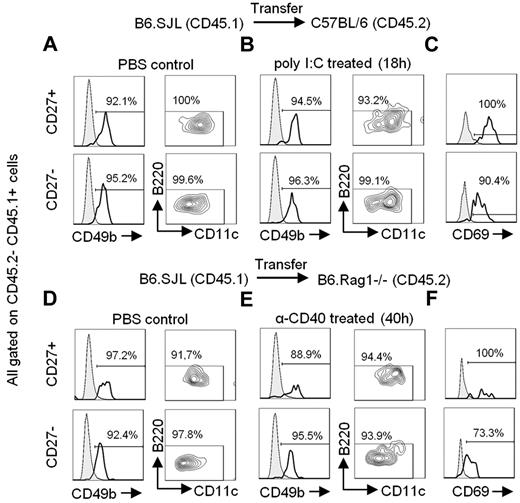
As described by others,9 mNK cells are able to acquire B220 expression after in vitro culture with IL-2 stimulation (supplemental Figure 2). Moreover, a higher proportion of B220-expressing cells of total NK cells can be found after in vivo stimulation (supplemental Figure 3).9 Thus, it has been proposed that mNK cells acquire B220 expression after activation. To investigate this possibility, we transferred sorted B220− mNK cells expressing either CD27+ or CD27− from a B6.SJL mouse into C57BL/6 mice, which were subsequently injected with poly I:C or PBS. Both mNK-cell subsets were efficiently activated after poly I:C treatment as evidenced through the up-regulation of CD69 at the peak of the response (Figure 2C bold), relative to PBS injections (Figure 2C filled). Yet neither mNK subset up-regulated B220 expression (Figure 2A-B; supplemental Figure 5A-B), whereas B220+ NK cells maintained a high level of B220 expression after poly I:C treatment (supplemental Figure 4A-B). Moreover, because anti-CD40 treatment in Rag-deficient mice has also been shown to activate mNK cells,32,33 we transferred B6.SJL CD27+ and CD27− mNK cells into B6.Rag1−/− mice and injected the recipient mice with anti-CD40 or PBS. Again, both mNK-cell subsets exhibited an activated phenotype after in vivo treatment with anti-CD40 (Figure 2F bold) compared with PBS-treated mice (Figure 2F filled), yet neither CD27+ nor CD27− NK cells presented with an up-regulation of B220 expression (Figure 2D-E; supplemental Figure 5C-D), whereas B220+ NK cells maintained B220 expression in these conditions (supplemental Figure 4C-D). Taken together, these results suggest that both CD27+ and CD27− NK cells do not acquire B220 expression in vivo, either during steady state conditions or after poly I:C and anti-CD40 activation, and further suggest that B220+ NK cells are specifically increased in the spleen after in vivo activation.
B220 is not up-regulated on mNK cells even on in vivo activation. CD27+ and CD27− mNK-cell subsets sorted from the spleen of B6.SJL (CD45.1) mice were adoptively transferred into C57BL/6 (CD45.2; A-C) or B6.Rag1−/− (CD45.2; D-F) mice through tail vein injections. The next day, mice were injected intraperitoneally with PBS (A,D), poly I:C (B), or anti-CD40 Ab (E). The expression of CD49b, CD11c, and B220 was analyzed on CD45.1+ CD45.2− cells 18 hours after poly I:C injection (A-B) or 40 hours after anti-CD40 Ab injection (D-E). (C,F) CD69 expression is depicted on CD45.1+ CD45.2− cells from PBS injected (gray filled) or poly I:C or anti-CD40 treated (bold) mice. Results are representative of ≥ 3 independent experiments.
B220 is not up-regulated on mNK cells even on in vivo activation. CD27+ and CD27− mNK-cell subsets sorted from the spleen of B6.SJL (CD45.1) mice were adoptively transferred into C57BL/6 (CD45.2; A-C) or B6.Rag1−/− (CD45.2; D-F) mice through tail vein injections. The next day, mice were injected intraperitoneally with PBS (A,D), poly I:C (B), or anti-CD40 Ab (E). The expression of CD49b, CD11c, and B220 was analyzed on CD45.1+ CD45.2− cells 18 hours after poly I:C injection (A-B) or 40 hours after anti-CD40 Ab injection (D-E). (C,F) CD69 expression is depicted on CD45.1+ CD45.2− cells from PBS injected (gray filled) or poly I:C or anti-CD40 treated (bold) mice. Results are representative of ≥ 3 independent experiments.
B220+ NK cells exhibit a more immature phenotype than CD27+ NK cells
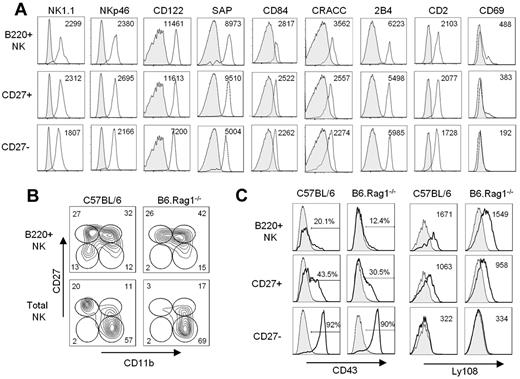
B220+ NK cells are present at variable frequency within various lymphoid organs, including the thymus, spleen, lymph nodes, and BM.13,34,35 To confirm the NK-cell lineage origin of these B220+ cells, we investigated the ex vivo expression of various markers associated with the NK lineage in comparison with CD27+ and CD27− NK-cell subsets (Figure 3A). All 3 subsets exhibited a similar phenotype for the expression of markers associated with the NK lineage, including NK1.1, NKp46, and CD122. Likewise, the SAP, the SLAM-related receptors, CD84, CRACC, and 2B4, as well as the NK-cell adhesion molecule, CD2, were not differentially expressed among the 3 NK-cell subsets. However, CD69 was expressed at low level on both B220+ NK cells and the CD27+ NK-cell subset, whereas it was absent from the CD27− NK-cell subset (Figure 3A). B220+ NK cells also expressed high levels of CD27 and low levels of CD11b relative to total mNK cells (Figure 3B). B220+ NK cells may thus be more closely related to the CD27+ NK-cell subset, as opposed to the CD27− NK-cell subset. Finally, we determined the expression level of CD43 and Ly108, whereby Ly108 is a membrane glycoprotein of the SLAM family that, as opposed to CD43, is down-regulated with NK-cell maturation.6,36,37 As expected, CD43 expression was highest and Ly108 was lowest on the most functionally mature CD27− NK-cell subset relative to the CD27+ NK-cell subset (Figure 3C). In contrast, B220+ NK cells exhibited the lowest level of CD43 and the highest level of Ly108 in comparison to both CD27+ and CD27− NK cells, as observed in both C57BL/6 and B6.Rag1−/− mice (Figure 3C). This result suggests that B220+ NK cells may represent a less differentiated mNK-cell subset. Together, the phenotypic characterization of B220+ NK cells relative to CD27+ and CD27− NK cells hinted that B220+ NK cells are indeed of the NK-cell lineage, but they appear to be a rather less differentiated mNK-cell subset that may precede CD27+ NK cells in the differentiation pathway.
B220+ NK cells are phenotypically similar but not identical to mNK cells. (A) The level of expression of various NK-cell markers from C57BL/6 mice gated on B220+, CD27+, and CD27− NK-cell subsets is depicted. The mean fluorescence intensity is indicated. (B) Expression of CD11b and CD27 expression on B220+ NK cells and total CD49b+CD11clow/−B220− NK cells from both C57BL/6 and B6.Rag1−/− mice are shown. (C) Expression of NK-cell maturation markers, namely CD43 and Ly108, on B220+, CD27+, and CD27− NK-cell subsets from C57BL/6 and B6.Rag1−/− mice is shown. Results are representative of ≥ 3 independent experiments.
B220+ NK cells are phenotypically similar but not identical to mNK cells. (A) The level of expression of various NK-cell markers from C57BL/6 mice gated on B220+, CD27+, and CD27− NK-cell subsets is depicted. The mean fluorescence intensity is indicated. (B) Expression of CD11b and CD27 expression on B220+ NK cells and total CD49b+CD11clow/−B220− NK cells from both C57BL/6 and B6.Rag1−/− mice are shown. (C) Expression of NK-cell maturation markers, namely CD43 and Ly108, on B220+, CD27+, and CD27− NK-cell subsets from C57BL/6 and B6.Rag1−/− mice is shown. Results are representative of ≥ 3 independent experiments.
B220+ NK cells are immediate precursors to mNK-cell subsets
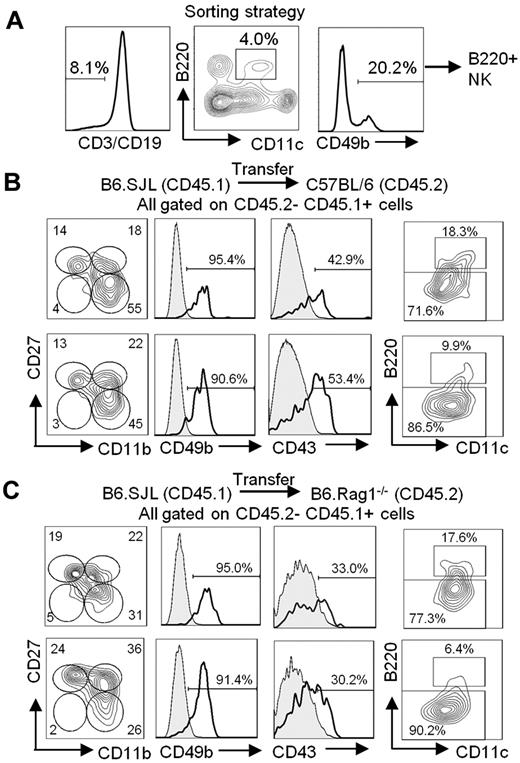
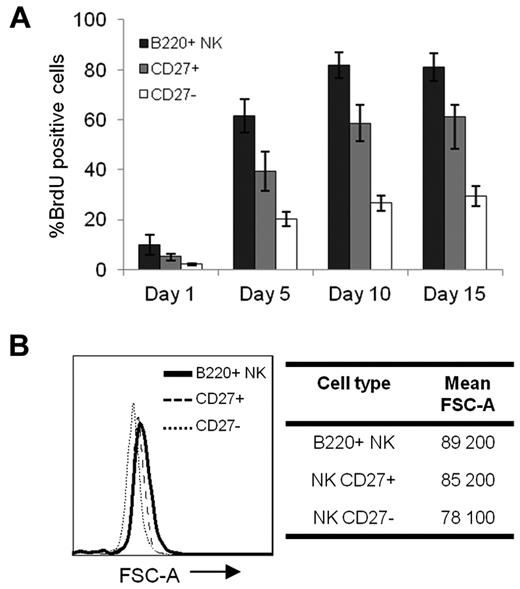
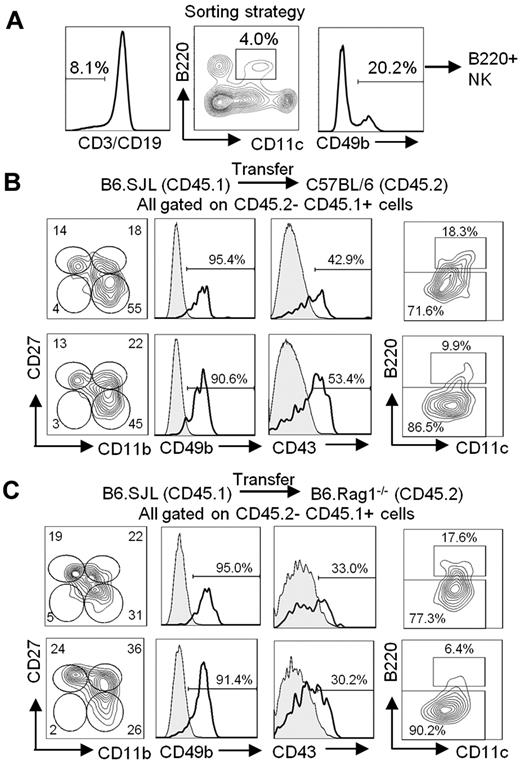
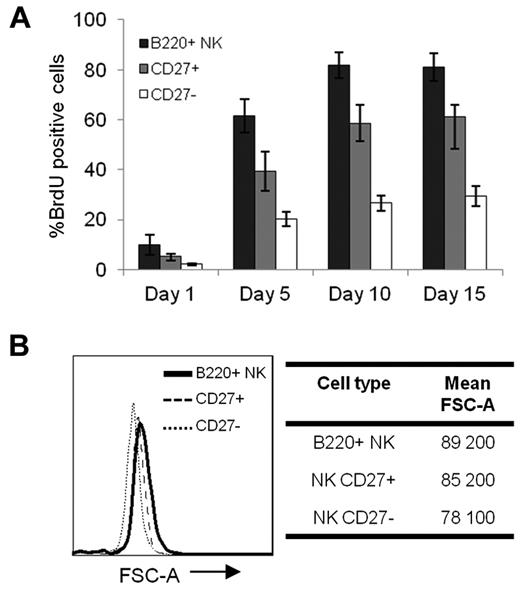
To determine whether B220+ NK cells are able to functionally mature in vivo, we performed in vivo transfer experiments with sorted B220+ NK cells (Figure 4A). Five days after transfer in a C57BL/6 mouse, only 18% of B220+ NK cells had maintained a high level of B220 expression (Figure 4B top). Moreover, although B220+ NK cells are mostly CD27+ and CD43− (Figure 3B-C), nearly one-half of the transferred B220+ NK cells had lost CD27 expression and acquired CD43 expression in agreement with functional maturation (Figure 4B top). This phenotype was further accentuated with time, such that at 15 days after transfer, < 10% of B220+ NK cells retained B220 expression and had begun to lose CD11c expression (Figure 4B bottom). By 25 days after transfer, all B220+ NK cells had completely lost B220 expression and exhibited a CD11cneg/lowCD11b+CD27− phenotype (supplemental Figure 6).15 Of note, the phenotypic changes in B220+ NK cells after in vivo transfer were not attributed to Ab ligation of B220 (data not shown). Similar results were obtained after transfer of B220+ NK cells in B6.Rag1−/− mice, whereby most cells had lost B220 expression and at least one-quarter of the cells acquired a most functionally mature CD11b+CD27− mNK-cell phenotype, along with higher levels of CD43 (Figure 4C). In summary, after transfer, B220+ NK cells rapidly lose B220 expression and acquire phenotypic characteristics of more mature NK cells. These results strongly suggest that B220+ NK cells precede B220− mNK cells in the NK-cell maturation pathway. Moreover, a continuous BrdU-labeling experiment found that B220+ NK cells presented with the highest level of incorporation of BrdU at any given time point, followed by CD27+ and subsequently CD27− NK cells (Figure 5A). The high cycling potential of B220+ NK cells is supported by their larger cell size, as depicted by the forward scatter histograms (Figure 5B). Together, these data support a model wherein B220+ NK cells represent an immediate precursor to B220− mNK-cell subsets and, thus, precede CD27+ NK cells in at least 1 differentiation pathway.
B220+ NK cells acquire an mNK-cell phenotype on in vivo transfer. (A) Gating strategy used to sort B220+ NK cells from the spleen of B6.SJL (CD45.1) mice. Sorted cells are CD3− CD19− CD11clow B220+ CD49b+. Cell purity was routinely > 90%. B220+ NK cells sorted from the spleen of B6.SJL (CD45.1) mice were adoptively transferred into (B) C57BL/6 (CD45.2) or (C) B6.Rag1−/− (CD45.2) mice through tail vein injections. The spleen cells were analyzed 5 (B-C top) and 15 (B-C bottom) days after transfer. The expression of CD11b, CD27, CD49b, CD43, CD11c, and B220 on CD45.1+CD45.2− transferred cells is shown. Results are representative of ≥ 3 independent experiments.
B220+ NK cells acquire an mNK-cell phenotype on in vivo transfer. (A) Gating strategy used to sort B220+ NK cells from the spleen of B6.SJL (CD45.1) mice. Sorted cells are CD3− CD19− CD11clow B220+ CD49b+. Cell purity was routinely > 90%. B220+ NK cells sorted from the spleen of B6.SJL (CD45.1) mice were adoptively transferred into (B) C57BL/6 (CD45.2) or (C) B6.Rag1−/− (CD45.2) mice through tail vein injections. The spleen cells were analyzed 5 (B-C top) and 15 (B-C bottom) days after transfer. The expression of CD11b, CD27, CD49b, CD43, CD11c, and B220 on CD45.1+CD45.2− transferred cells is shown. Results are representative of ≥ 3 independent experiments.
B220+ NK cells are highly cycling relative to mNK cells. (A) The mean percentage of BrdU incorporation on continuous labeling is shown for B220+, CD27+, and CD27− NK-cell subsets. One of 3 representative experiments is shown, with 4 mice/group. (B) Cell size is depicted in the histogram for sorted B220+, CD27+, and CD27− NK cells. The mean FSC-A is indicated for each NK-cell subset. Results are representative of ≥ 3 experiments.
B220+ NK cells are highly cycling relative to mNK cells. (A) The mean percentage of BrdU incorporation on continuous labeling is shown for B220+, CD27+, and CD27− NK-cell subsets. One of 3 representative experiments is shown, with 4 mice/group. (B) Cell size is depicted in the histogram for sorted B220+, CD27+, and CD27− NK cells. The mean FSC-A is indicated for each NK-cell subset. Results are representative of ≥ 3 experiments.
Transcriptome profiles present B220+ NK cells as a rapidly dividing distinct NK-cell subset with close homology to CD27+ NK cells
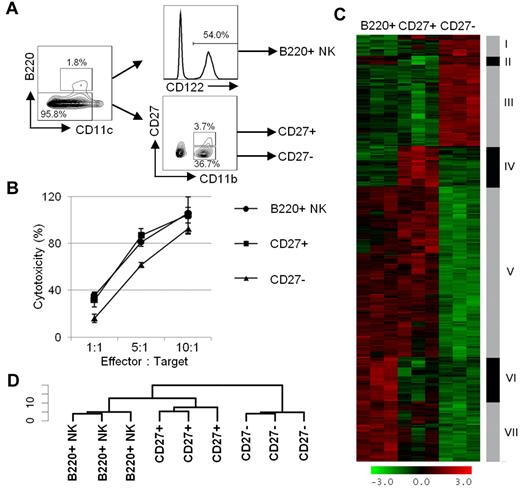
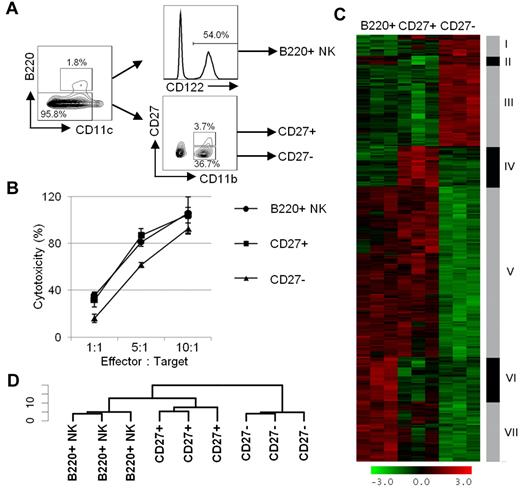
B220+ NK cells differ only modestly in phenotype from CD27+B220− mNK cells (Figure 3). To further delineate the relation among B220+, CD27+, and CD27− NK cells, we subjected the 3 cell subsets to a transcriptome analysis. We opted to isolate B220+ NK cells from the spleen of B6.Rag1−/− mice because the proportion of B220+ NK cells was significantly enhanced relative to C57BL/6 mice, facilitating their isolation (Figure 6A; supplemental Figure 1). For sake of comparison, CD27+ and CD27− NK cells were also isolated from B6.Rag1−/− mice (Figure 6A). The Rag deficiency did not affect mNK-cell function, as shown by their ability to efficiently lyse YAC-1 cells (Figure 6B). A hierarchical cluster analysis of the differentially expressed genes found a close relation between B220+ NK cells and CD27+ NK cells, whereby the transcriptome profile of CD27− NK cells diverged considerably from the 2 other subsets (Figure 6C-D). These results confirm that B220+ NK cells are more closely related to CD27+ NK cells than CD27− NK cells. Moreover, and as expected, all 3 subsets exhibited a similar level of mRNA expression for genes associated with the NK lineage, in agreement with the protein expression profile depicted in Figure 3 (supplemental Figure 7A). In addition, the mRNA expression profile of CD27, CD69, Ly108, CD11b, and CD43 followed their expected pattern of expression within the respective subsets (Figure 3; supplemental Figure 7B).
B220+ NK cells exhibit close homology to CD27+ NK cells. (A) Gating strategy for sorting B220+, CD27+, and CD27− NK-cell subsets from the spleen of B6.Rag1−/− mice. B220+ NK cells are selected as CD11clowB220+CD122+ cells, whereas CD27+ and CD27− NK-cell subsets are CD11c−/lowB220−CD122+ cells and are further separated according to CD27 expression. (B) The function of B220+, CD27+, and CD27− NK-cell subsets from B6.Rag1−/− mice is depicted by their cytotoxic activity toward 51Cr-labeled YAC-1 cells. The percentage-specific lysis is shown for B220+ NK cells (round), CD27+ NK cells (square), and CD27− NK cells (triangle). Results are representative of ≥ 3 experiments. (C-D) Hierarchical clustering of differentially expressed genes among B220+, CD27+, and CD27− NK-cell subsets. Three hundred twenty-six genes with an adjusted P value < .05 and an absolute fold change > 1.5 in any of the 2 comparisons (CD27+ vs B220+; CD27− vs B220+) were considered differentially expressed. (C) Gene clustering heat map is shown with the red-green scale presenting the z-transformed intensities whereby red represents a relative increase in expression and green represents a relative decrease. (D) a sample clustering dendrogram is represented from data in panel C.
B220+ NK cells exhibit close homology to CD27+ NK cells. (A) Gating strategy for sorting B220+, CD27+, and CD27− NK-cell subsets from the spleen of B6.Rag1−/− mice. B220+ NK cells are selected as CD11clowB220+CD122+ cells, whereas CD27+ and CD27− NK-cell subsets are CD11c−/lowB220−CD122+ cells and are further separated according to CD27 expression. (B) The function of B220+, CD27+, and CD27− NK-cell subsets from B6.Rag1−/− mice is depicted by their cytotoxic activity toward 51Cr-labeled YAC-1 cells. The percentage-specific lysis is shown for B220+ NK cells (round), CD27+ NK cells (square), and CD27− NK cells (triangle). Results are representative of ≥ 3 experiments. (C-D) Hierarchical clustering of differentially expressed genes among B220+, CD27+, and CD27− NK-cell subsets. Three hundred twenty-six genes with an adjusted P value < .05 and an absolute fold change > 1.5 in any of the 2 comparisons (CD27+ vs B220+; CD27− vs B220+) were considered differentially expressed. (C) Gene clustering heat map is shown with the red-green scale presenting the z-transformed intensities whereby red represents a relative increase in expression and green represents a relative decrease. (D) a sample clustering dendrogram is represented from data in panel C.
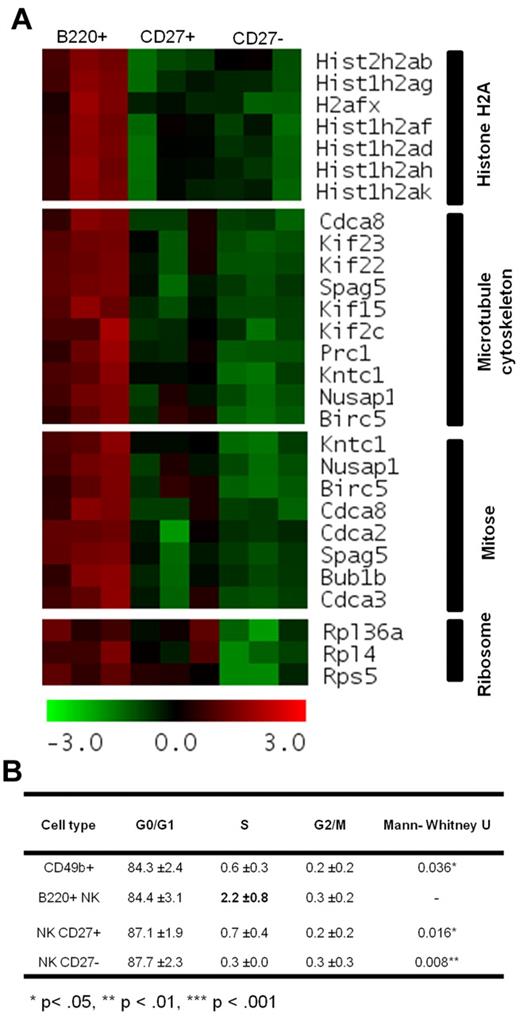
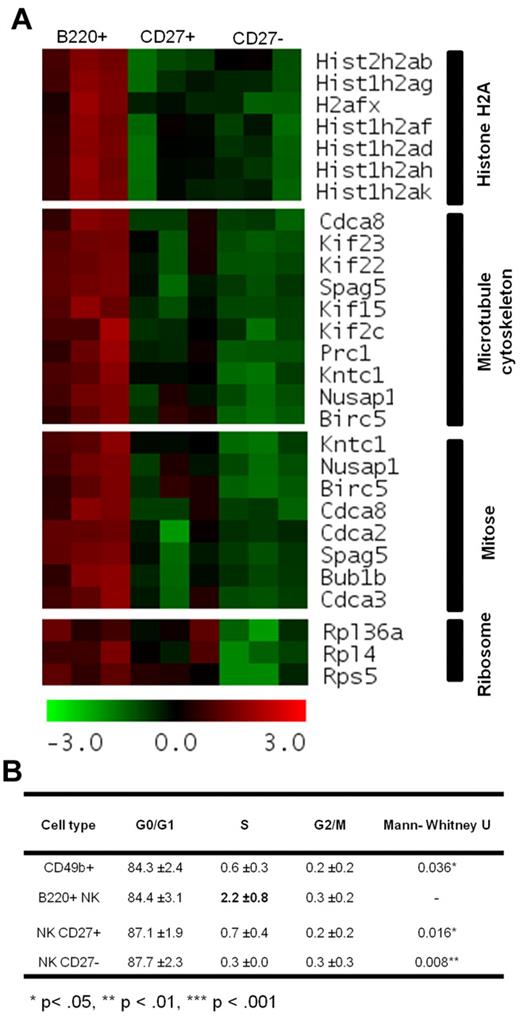
To discern the specific transcriptome profile of B220+ NK cells relative to both CD27+ and CD27− NK cells, we subsequently performed a DAVID functional enrichment analysis of genes included in clusters VI and VII, wherein B220+ NK cells present with a higher level of specific mRNA expression relative to both CD27+ and CD27− NK cells. The DAVID analysis highlighted enrichment in genes associated with cell cycle and microtubule organization (Figure 7A). Cell-cycle analyses confirmed that B220+ NK cells are indeed actively cycling with a greater proportion of cells present in S phase (Figure 7B). Together, these data present B220+ NK cells as an actively dividing cell subset preceding the CD27+ and CD27− subsets in the differentiation of mNK cells.
B220+ NK cells are actively cycling. (A) Heat map of the mRNA expression of the genes from clusters VI and VII on DAVID Functional Enrichment analysis, wherein higher mRNA expression was observed in B220+ NK cells relative to both CD27+ and CD27− NK cells. Z-transformed intensities are visualized by a red-green color scale whereby red represents a relative increase in expression and green a relative decrease. (B) Cell cycle analysis was performed on B220+, CD27+ and CD27− NK cells, as well as total CD49b+ NK cells sorted from the spleen of C57BL/6 mice. The percentage of cells in each phase on the cell cycle is represented. Mann-Whitney U test was applied to obtain P values that compared B220+ NK cells with other cell types (n = 5).
B220+ NK cells are actively cycling. (A) Heat map of the mRNA expression of the genes from clusters VI and VII on DAVID Functional Enrichment analysis, wherein higher mRNA expression was observed in B220+ NK cells relative to both CD27+ and CD27− NK cells. Z-transformed intensities are visualized by a red-green color scale whereby red represents a relative increase in expression and green a relative decrease. (B) Cell cycle analysis was performed on B220+, CD27+ and CD27− NK cells, as well as total CD49b+ NK cells sorted from the spleen of C57BL/6 mice. The percentage of cells in each phase on the cell cycle is represented. Mann-Whitney U test was applied to obtain P values that compared B220+ NK cells with other cell types (n = 5).
Discussion
In the present study, we redefine B220+ NK cells (formerly IKDCs) as a novel intermediate in NK-cell differentiation. Indeed, we find that after in vivo transfer B220+ NK cells rapidly lose B220 expression. In contrast, neither CD27+ nor CD27− NK cells acquired B220 expression after in vivo transfer, even in the presence of potent activating stimuli, suggesting that B220+ NK cells do not arise from the activation of mNK cells. With the use of the CD45 allotypic marker for cell tracking, we were further able to show that B220+ NK cells adopted an mNK-cell phenotype and underwent functional maturation after in vivo transfer. Moreover, we show that B220+ NK cells are actively cycling, a characteristic associated with precursor cell populations. Together these results indicate that B220+ NK cells are an immediate precursor to CD27+ NK cells.
Previous reports have suggested that B220+ NK cells compose cells of the NK lineage presenting with few, if any, properties in common with the DC lineage.9,16,18 Similarly, we find that B220+ NK cells exhibit phenotypic properties similar to both CD27+ and CD27− NK subsets. Indeed, B220+ NK cells express the NK-cell pan-specific marker, NKp46, along with comparable levels of intracellular SAP relative to both mNK subsets, for which the expression has not been observed in DCs.38 In addition, B220+, CD27+ and CD27− NK cells exhibit a similar level of expression of various SLAM proteins, namely CD84, CRACC, and 2B4. Furthermore, the transcriptome profile of B220+ NK cells is highly homologous to the CD27+ NK-cell subset, such that CD27+ NK cells exhibit a greater homology to B220+ NK cells than to CD27− NK cells. Together, these findings further support the view that B220+ NK cells exhibiting the IKDC phenotype are indeed part of the NK lineage, in agreement with previous reports.9,16,18
Yet the exact lineage relationship of B220+ NK cells in relation with other mNK-cell subsets had not been extensively examined. It had been proposed that B220 on NK cells merely reflect an activated phenotype,9 because in vitro activation of B220− NK cells leads to an up-regulation of B220 expression. We further investigated whether B220 expression discerned a unique NK-cell subset or whether its expression correlated with NK-cell activation. Surprisingly, we found that B220+ NK cells do not define activated mNK cells in vivo. Neither the CD27+ nor the CD27− NK-cell subset acquired B220 expression after in vivo transfer in steady state conditions. In addition, B220 expression was not enhanced on transfer of mNK subsets in Rag1−/− mice, whereby Rag-deficiency allows a low level of homeostatic proliferation of NK cells.39 Finally, in vivo activation of transferred mNK-cell subsets either with poly I:C, which activates mNK cells both directly through IFNαR and indirectly through enhancing the transpresentation of IL-15,40 or with anti-CD40 treatment32,33 still did not promote B220 expression on CD27+ and CD27− NK cells. This contrasts with previous in vivo experiments wherein a high proportion of B220+ NK cells was detected on activation with either poly I:C or CpG.9 The discrepancy between these results may be explained by the fact that, in the latter experiment, the effect of poly I:C or CpG was analyzed on total endogenous NK cells, which include a substantial proportion of endogenous B220+ NK cells. Indeed, after adoptive transfer of B220+ NK cells, we found that both poly I:C and anti-CD40 treatments enabled B220+ NK cells to retain high levels of B220 expression. It is thus possible that in vivo stimulation with either poly I:C or CpG might have allowed for the accumulation of endogenous B220+ NK cells, as opposed to inducing B220 expression on B220− mNK cells. In agreement with this postulate, we find that, after activation, the proportion of B220+ cells is globally enhanced on total endogenous mNK cells but not on the transferred B220− NK cells. Still, our results do not preclude the fact that in other inflammatory settings, such as in viral or bacterial infections, mNK cells may be able to up-regulate B220 expression. Nonetheless, our results support the view that B220 may be used as a reliable marker to identify B220+ NK cells in steady state conditions and on poly I:C or anti-CD40 stimulation, the latter representing 2 distinct potent modes of NK-cell activation.
Because B220+ NK cells are part of the NK lineage and because B220 expression on NK cells does not reflect the activation status of mNK cells, we aimed to determine the role of B220+ NK cells relative to other mNK subsets. We exploited an in vivo system because in vitro assays for NK cells most often rely on the use of specific cytokines, such as IL-2 and IL-15, which may modulate the expression of various markers, including B220.9,22 First and foremost, we found that B220+ NK cells exhibit an immature phenotype relative to mNK cells, in that they presented with a low level of CD43 expression and a high level of Ly108. Moreover, after in vivo transfer, we found that B220+ NK cells rapidly acquire characteristics of mNK-cell subsets, including up-regulation of CD11b and CD43 expression along with a decrease in CD27 expression and complete loss of B220. The rapid turnover of B220+ NK cells relative to mNK cells was further supported by the rate of incorporation of BrdU on a population level. Cell precursor populations are often characterized by a high level of cell division. Accordingly, B220+ NK cells are highly proliferating, as depicted by their larger cell size, by the enrichment of genes associated with cell cycle in the DAVID analysis, and by the highest proportion of cells in S phase in the cell cycle profile. We, thus, define B220+ NK cells as rapidly cycling cells relative to mNK cells and immediate precursors to CD27+ NK cells in at least 1 differentiation pathway.
Immune cell types are most often named for the function they exhibit rather than for their phenotype. More importantly, B220 expression can be acquired on NK cells after in vitro culture, and a low proportion of CD49b− iNK cells also express B220.9 As such, the name “B220+ NK cell” is imprecise. Thus, we propose to rename B220+ NK cells according to their functional attributes, noting the rapidly cycling nature of B220+ NK cells as well as their precursor relation to CD27+ NK cells. Consequently, by homology to pre-B cells and pre-DCs,41,42 we suggest that B220+ NK cells could be referred to as pre-mNK cells, defined phenotypically as CD3− CD19− CD49b+ CD122+ NKp46+ CD11clow B220+ CD27+ CD11blow cells, in relation to its mNK-cell lineage.
Where do pre-mNK cells fit along the NK-cell maturation pathway? The first step in NK-cell differentiation occurs in the BM, where NKP cells are thought to differentiate into iNK cells. Interestingly, a low proportion of iNK cells express B220.9 We suggest that B220 expression by iNK cells occurs en route to becoming a B220+ pre-mNK cell. Indeed, pre-mNK cells express CD49b, in agreement with a more mature NK-cell phenotype than CD49b− iNK cells, thus placing pre-mNK cells downstream of iNK cells in at least 1 of the NK-cell differentiation pathways. The pre-mNK cells then differentiate into B220−CD27+ NK cells and subsequently into the CD27− NK-cell subset. A notable argument against a direct route from NKP to iNK to pre-mNK to mNK cells comes from the study of BM progenitors, whereby mNK cells and pre-mNK cells were shown to arise from different BM progenitors.19 Indeed, Welner et al showed that pre-mNK cells, which they referred to as IKDCs, were efficiently generated from L-selectin+ lymphoid progenitors, whereas NK cells were efficiently produced from L-selectin lymphoid progenitors, early lymphoid progenitors, and common lymphoid progenitors.19 However, a parallel pathway of thymic NK-cell differentiation has been described.43,44 It is, thus, possible that early lymphoid progenitors and common lymphoid progenitors migrate to the thymus and generate thymic-derived CD127+ NK cells, whereas LSPs would generate pre-mNK cells. In that regard, it should be noted that CD11b−CD27− NK cells may be of thymic origin because they are shown to precede the CD11blowCD27+ phenotype in the functional maturation pathway, express CD127, and appear to be absent in B6.Rag1−/− mice (Figure 3B).5,44 Moreover, Fathman et al have recently shown that intrathymic injection of NKPs, or even earlier NK-committed precursors termed pre-NKPs, does not yield mNK cells, further supporting 2 distinct differentiation pathways for NK cells,4 a thymic-dependent and a thymic-independent pathway. Additional mouse models, wherein NK-cell differentiation is impeded at different stages, are needed to decipher the sequential steps of NK-cell differentiation, as well as to define the molecular underpinnings of this differentiation process. To that effect, an accumulation of B220+ NK cells has been documented in 3 different gene-targeted mouse models, including Gata3-, Tbet-, and Bcll1b-deficient mice.45,46 The exact pathway by which these and other transcription factors promote the accumulation of pre-mNK cells remains to be defined.
In addition to gene-targeted mouse models, we have previously shown that the proportion of pre-mNK cells is regulated, at least in part, by genetic polymorphisms encoded within the distal region of mouse chromosome 7.34 Of interest, 5 mouse cancer quantitative trait loci (http://tumor.informatics.jax.org) and ≥ 5 of the quantitative trait loci linked to the most frequent human cancers are syntenic to this same distal region of mouse chromosome 7.47-49 Because pre-mNK cells exhibit a prominent antitumoral potential,14,20,21 it is tempting to speculate that genes defining the proportion of pre-mNK cells also contribute toward defining cancer susceptibility. Indeed, on a per cell basis, the in vivo antitumoral activity of pre-mNK cells is more efficient than mNK cells,14,16,20-22 probably because of the fact that, as an immediate precursor population, pre-mNK cells can generate a vast number of mNK cells. Alternatively, pre-mNK cells may themselves exhibit a unique and prominent antitumoral potential. Additional studies are required to fully grasp the antitumoral potential of pre-mNK cells, which may have broad applications in the application of cancer immunotherapy.
There is an Inside Blood commentary on this article in this issue.
The online version of this article contains a data supplement.
The publication costs of this article were defrayed in part by page charge payment. Therefore, and solely to indicate this fact, this article is hereby marked “advertisement” in accordance with 18 USC section 1734.
Acknowledgments
The authors thank Ms Guyon and the animal house staff for curating the mouse colonies, and Dr Labrecque, Dr Guimond, and Ms Hillhouse for critical review of the manuscript.
This work was supported by Canadian Institutes of Health Research (CIHR) and Canadian Cancer Society Research Institute (A.V.); and by the Foundation of the Maisonneuve-Rosemont Hospital, Canadian Foundation for Innovation, and Natural Sciences and Engineering Research Council of Canada (S.L.). F.G.-D. is a recipient of a CIHR PhD scholarship, and S.L. holds a CIHR New Investigator scholarship.
Authorship
Contribution: F.G.-D. performed all the experiments, designed experiments, analyzed data, prepared figures, and wrote the manuscript; G.B. analyzed data and prepared figures; M.D. designed experiments; Z.D. and A.V. proposed experiments; and S.L. proposed experiments and wrote the manuscript.
Conflict-of-interest disclosure: The authors declare no competing financial interests.
Correspondence: Sylvie Lesage, 5415 boul del'Assomption, Montreal, QC, H1T 2M4, Canada; e-mail: sylvie.lesage@umontreal.ca.


