IL-6 signaling can be enhanced through transsignaling by the soluble IL-6 receptor (sIL-6r), allowing for the pleiotropic cytokine to affect cells it would not ordinarily have an effect on. Serum levels of sIL-6r can be used as an independent prognostic indicator and further stratify the GEP 70-gene low-risk group to identify an intermediate-risk group in multiple myeloma (MM). By analyzing more than 600 MM patients with ELISA, genotyping, and gene expression profiling tools, we show how the combination of 2 independent molecular genetic events is related to synergistic increases in sIL-6r levels. We also show that the rs2228145 minor allele is related to increased expression levels of an IL-6r splice variant that purportedly codes exclusively for a sIL-6r isoform. Together, the SNP rs2228145 minor allele C and amplification of chromosome 1q21 are significantly correlated to an increase in sIL-6r levels, which are associated with lower overall survival in 70-gene low-risk disease, and aid in identification of the intermediate-risk MM group.
Introduction
IL-6 signaling was originally found to be associated with T cells more than 45 years ago,1 and the signaling pathway's involvement in multiple myeloma (MM) was first described by Kawano et al.2 Since then, IL-6 signaling has consistently been shown to be related to inflammatory diseases and neoplasia.3,,–6
The IL-6 receptor (IL-6r, also known as CD126, gp80, and IL-6rα) is part of the ligand-binding domain for IL-6. IL-6r is able to form a signal complex by binding IL-6 and the transmembrane signal-transducing molecule gp130 (also known as CD130 and IL6ST). Signal activation can be transduced by the intracellular domain of gp130 when the IL-6–IL-6r–gp130 complex is formed. Pathways that have been shown to be associated with IL-6 signaling include Jak/STAT, Ras/Raf/MAPK, PI3K, and NF-κB.
IL-6r has been shown to exist in both membrane-bound and soluble forms. Possible mechanisms by which the soluble form can be generated have been discussed previously.7,,–10 The IL-6r may become soluble by 2 modes: proteolytic cleavage (shedding) or transcription of a splice variant. The splice variant is thought to be translated exclusively into the soluble isoform of IL-6r (sIL-6r); however, the shedding mechanism has been suggested to yield the majority of sIL-6r.10,,–13
The missense single-nucleotide polymorphism (SNP) rs2228145 (also known as rs8192284) located on exon 9 of the IL-6r gene on chromosome 1q21 has been shown to be highly correlated with serum sIL-6r levels.11,14,15 The rs2228145 SNP may increase the affinity of a specific proteinase to enzymatically cleave the membrane-bound receptor, or it may make the membrane-bound receptor more susceptible to cleavage by more than 1 proteinase. We show for the first time that the rs2228145 minor allele C is related to significantly increased expression levels of the IL-6r splice variant.
The significance of sIL-6r is that it can allow for IL-6 signaling in cells that do not express the receptor. By convention, any cell that expresses the gp130 receptor may be receptive to IL-6 in the presence of sIL-6r. This form of IL-6 signaling, known as transsignaling, has been shown to be of significant prognostic importance in MM12,16,17 but seems to be of utmost significance within a subset of the 626 MM patients analyzed in this study.
By using different sample types and various analytical tools, we are able to demonstrate how 2 unrelated molecular genetic events can combine to influence serum sIL-6r levels. Furthermore, these data suggest that MM CD138+ plasma cells (MMPCs) are important contributors of sIL-6r in the group with significantly high levels. Although we acknowledge sIL-6r is not exclusively produced by the plasma cells (PCs), as evidenced in the non–MM serum samples, these data do provide a strong PC-sIL6r relationship in a subset of MM. We also show that serum sIL-6r levels relate to overall survival and aid in subgrouping the 70-gene low-risk group18 of MM.
Methods
Research subjects
Subjects with MM (n = 626) used for the analysis were enrolled in the National Institutes of Health–sponsored Total Therapy protocols UARK 98-026, UARK 2003-33, UARK 2006-66, UARK 2008-01, and UARK 2008-02. Soluble IL-6r concentrations were analyzed from baseline bone marrow aspirate serum samples, and germ line genotype was determined by analysis of DNA isolated from peripheral blood stem cell (PBSC) samples. In brief, PBSCs were harvested after mobilization for use in autologous transplant. A small aliquot of the PBSC collection was reserved for research purposes, per patient consent. Loss of heterozygosity analysis of MM patients' primary tumor was performed on DNA isolated from MMPCs. Gene expression profiling (GEP) analysis for IL-6r expression levels and virtual karyotyping analysis (vCA) were performed on RNA isolated from MMPCs, as described previously.19
The subjects with monoclonal gammopathy of undetermined significance or PC proliferative disorders (n = 153) used for this analysis were enrolled in the Southwest Oncology Group study 0120 (SWOG 0120). These patients are generally considered asymptomatic and do not receive chemotherapy. Convention says that the disorders in approximately 1% to 2% of these patients will convert to MM per year. Concentrations of sIL-6r in these patients were analyzed from baseline peripheral blood serum samples.
For the normal donor subjects (n = 44) used in this analysis, sIL-6r concentrations were analyzed from peripheral blood serum samples, and genotyping was performed on DNA isolated from PBMCs.
All subjects provided written informed consent approving use of their samples for research purposes in accordance with the Declaration of Helsinki. All protocols were reviewed and approved by the Institutional Review Board at the University of Arkansas for Medical Sciences.
Determination of sIL-6r protein concentrations
ELISA kits (R&D Systems) were used to determine soluble IL-6r protein concentrations according to the manufacturer's procedures. All samples were plated in duplicate, and average concentrations were used for further analysis.
Genotyping of rs2228145 SNP
DNA for genotyping was isolated with the QIAamp DNA kit (QIAGEN), and the rs2228145 SNP genotypes were determined with a TaqMan-based PCR assay (Applied Biosystems). Reactions, using 20 ng of DNA per reaction, were performed in triplicate with the ABI Prism 7000 sequence detection system (Applied Biosystems). The PCR thermal cycle was performed with an initial 10-minute hold at 95°C, and 40 cycles at 92°C for 15 seconds and 60°C for 1 minute. After PCR was performed, the intensities of the 2 probes were plotted on x- and y-axes. The scatter plot was used to determine the 3 possible genotypes (see Figure 3). The following primers and probes were used: forward primer, TCTCCATATTCTCCTCTTCCTCCTCTA; reverse primer, GGAATGTGGGCAGTGGTACT; VIC reporter probe, CTAGTGCAAGATTCTTC; and FAM reporter probe, TAGTGCAAGCTTCTTC. All procedures were performed in accordance with the manufacturers' protocols.
Sequencing IL-6r splice variant
RNA from MMPCs was isolated with an RNeasy kit (QIAGEN) according to the manufacturer's protocol. Complementary DNA was synthesized with 1μg of RNA with the SuperScript III kit (Invitrogen), according to the manufacturer's protocol with oligo(dT) primers. PCR was performed with GoTaq Flexi DNA Polymerase and supplied reagents (Promega), using primers as described previously.8 PCR was performed for 35 cycles at 94°C for 1 minute, at 58°C for 20 seconds, and at 72°C for 30 seconds. PCR reactions were electrophoresed in a 1% agarose gel, excised, and purified with the Wizard SV Gel and PCR Clean-Up system (Promega). Sequencing was performed at the University of Arkansas for Medical Sciences DNA Sequencing Core Facility.
Quantification of IL-6r splice-variant expression
Isolation of RNA and synthesis of cDNA according to manufacturers' protocols were performed as described in “Sequencing IL-br splice variant,” and a TaqMan-based PCR assay was designed to specifically target the differentially spliced IL-6r (DS–IL-6r) transcript variant. The primers and probes used were as follows: forward primer, TCTTCAGAGATTCTGCAAATGCGA; reverse primer, CGCAGCTTCCACGTCTTC; and reporter probe, AAGCCTCCCAGGTTCAA. RNA (1 μg) from MMPCs was reverse transcribed, and the cDNA was diluted 25× with water. Then, 5 μL of the dilution was used for quantitative reverse-transcriptase PCR (qRT-PCR), and all samples were plated in duplicate. The glyceraldehyde-3-phosphate dehydrogenase (GAPDH) TaqMan assay Hs99999905_m1 (Applied Biosystems) was used as the endogenous control, and the ΔΔCt formula was used to calculate relative gene expression values.
Virtual karyotyping and GEP analyses
The vCA algorithm is derived from the GEP analysis of PC cDNA hybridized to the U133 Plus 2.0 array (Affymetrix). GEP sample processing and sample procurement has been described previously.18 The chromosome 1q21 amplification status of MMPCs is based on a novel vCA algorithm (Y.Z., Q.Z., O.W.S., C. Heuck, E.T., J. Sawyer, M.-A. Cartron-Mizeracki, B.B., J.D.S., Prediction of cytogenic abnormalities with gene expression profiles, manuscript submitted October 2011). This validated model is shown to accurately represent a karyotype based on mRNA levels. The probe set ID 217489_s_at was used for IL-6r expression analysis by GEP.
Statistical analyses
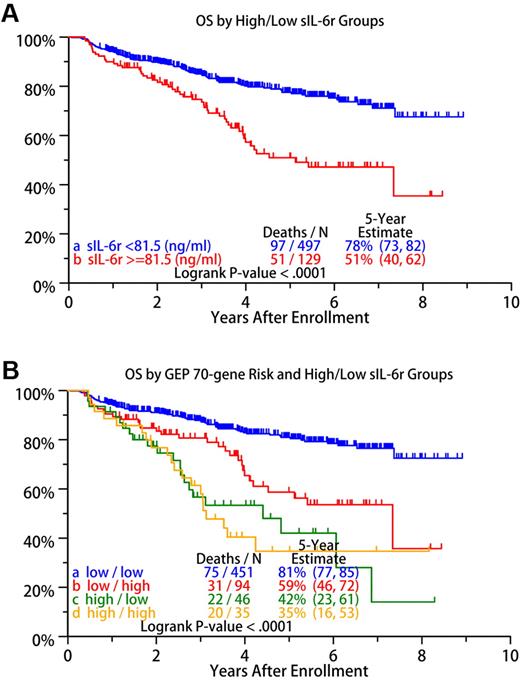
An optimal cut point of 81.5 ng/mL for sIL-6r was identified with the running log-rank test. Patients with sIL-6r concentrations ≥ 81.5 ng/mL were assigned to the sIL-6r high-risk group, and those with concentrations < 81.5 ng/mL to the sIL-6r low-risk group in terms of overall survival. Survival probabilities between the low- and high-risk sIL-6r groups were significantly different (P < .001; see Figure 7A), with the 5-year survival estimates for groups being 78% and 51%, respectively.
To examine the independent prognostic power of sIL-6r concentrations, we performed multivariate stepwise Cox regression analysis on the high- versus low-risk sIL-6r scores, along with other prognostic factors. We included all variables with a univariate P value < .15, except for the GEP 70-gene model, in the multivariate analysis, and sIL-6r concentration was significant (P = .026; see Table 4).
P values given for Table 1 and Figures 1, 3, and 4 through 6 and in supplemental Methods (available on the Blood Web site; see the Supplemental Materials link at the top of the online article) were calculated by t test. Asterisks in the box plot figures represent the highest outlier (above whisker), the lowest outlier (below whisker), or both.
Results
sIL-6r concentrations are significantly different among normal donors, asymptomatic myeloma, and overt MM
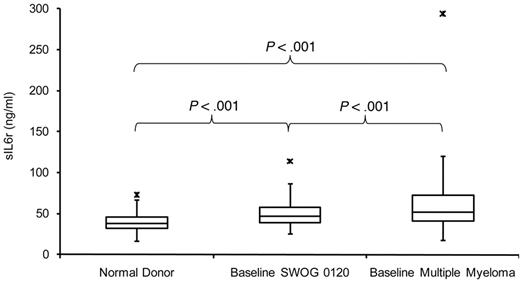
Serum sIL-6r concentrations were tested in normal donors (NDs; n = 44), SWOG 0120–enrolled subjects who had monoclonal gammopathy of undetermined significance or a PC proliferative disorder (n = 153), and patients with MM (n = 626) to gauge differences among the groups. Concentrations of sIL-6r in the MM group were significantly higher (P < .001) than in the ND and SWOG 0120 groups on the basis of the t test. In addition, the same test revealed that the SWOG 0120 group had significantly higher sIL-6r levels than the ND group (P < .001; Figure 1).
Serum sIL-6r concentrations. Serum sIL-6r concentrations in NDs, baseline SWOG 0120–enrolled subjects, and baseline MM patients.
Serum sIL-6r concentrations. Serum sIL-6r concentrations in NDs, baseline SWOG 0120–enrolled subjects, and baseline MM patients.
Because the ND and SWOG 0120 serum samples were taken from the periphery and the MM samples from the bone marrow, we tested whether this variable made a significant difference in sIL-6r values. Paired serum samples taken from the periphery and from bone marrow of 21 untreated patients were analyzed (R2 = 0.959); supplemental Figure 1). Levels of sIL-6r were not significantly different when compared between serum taken from the periphery or from bone marrow in these 21 subjects (P = .539).
We also analyzed the MM group for racial and gender differences that may relate to sIL-6r variability. This cohort of MM subjects does not have a significant number of African American subjects (n = 38) to clearly address racial discrepancies. Notwithstanding the low number of African American subjects, we compared sIL-6r levels to those of the white group (n = 572) by t-test (P = .045). sIL-6r levels between the 231 female and 395 male subjects also were compared by t test (P = .076).
SNP rs2228145 minor allele C correlates with higher sIL-6r concentrations but not IL-6r expression
The SNP rs2228145 is located on exon 9 of the IL-6r gene at chromosome 1q21.3. This SNP lies within the transmembrane-domain coding region, and the minor allele C translates for the missense mutation Asp358Ala.
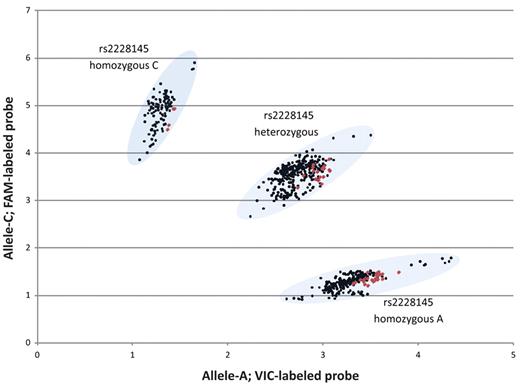
The MM and ND groups were screened for the rs2228145 SNP (Figure 2). Eleven DNA samples were sequenced to validate the PCR-based allelic discrimination results, and all were confirmed (data not shown). Allele frequencies in the MM group were as follows: AA, 35.1% (n = 220); AC, 47.8% (n = 299); and CC, 17.1% (n = 107; Table 2). Allele frequencies in the ND group were as follows: AA, 52.3% (n = 23); AC, 38.6% (n = 17); and CC, 9.1% (n = 4).
Scatter plot of TaqMan-based allelic discrimination of the IL-6r SNP rs2228145. The genotypes of 626 MM PBSC samples are shown in black, and 44 normal donor PBMC samples are shown in red.
Scatter plot of TaqMan-based allelic discrimination of the IL-6r SNP rs2228145. The genotypes of 626 MM PBSC samples are shown in black, and 44 normal donor PBMC samples are shown in red.
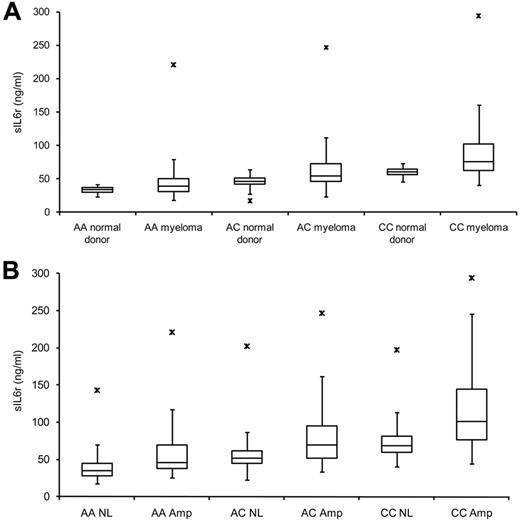
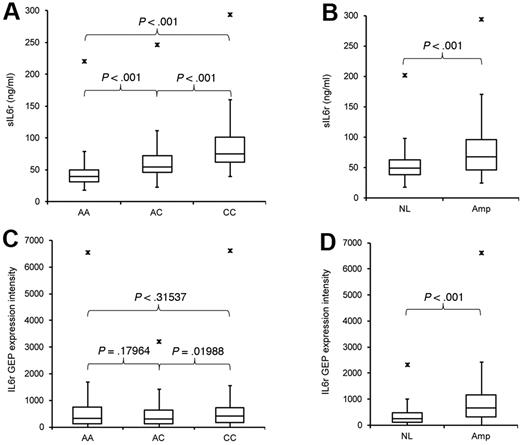
ELISA and genotyping results were combined, and a significant difference in sIL-6r levels was seen among the allele groups in ND subjects (Table 1, ELISA P; ND) and MM subjects (Table 1, ELISA P; MM) by t test (Figures 3A and 4A). But when individual allele groups from ND and MM were compared, the highly significant differences were lost (Table 1, ELISA P; ND vs MM). This finding is further examined in the following section. The rs2228145 SNP is significantly related to sIL-6r protein concentrations (Figure 4A) but not to IL-6r expression (Figure 4C), pointing to its importance as an independent variable of sIL-6r concentration.
Serum sIL-6r concentration in relation to rs2228145 genotype and chromosome 1q21 status. (A) sIL-6r levels increase from homozygous A to homozygous C groups in ND and MM subjects. (B) sIL-6r in 626 MM subjects segregated based on rs2228145 allele and MMPC chromosome 1q21 status.
Serum sIL-6r concentration in relation to rs2228145 genotype and chromosome 1q21 status. (A) sIL-6r levels increase from homozygous A to homozygous C groups in ND and MM subjects. (B) sIL-6r in 626 MM subjects segregated based on rs2228145 allele and MMPC chromosome 1q21 status.
Serum sIL-6r concentration and MMPC IL-6r expression in relation to rs2228145 genotype and MMPC 1q21 status in 626 MM patients. (A) Serum sIL-6r concentrations with respect to rs2228145 status. (B) Serum sIL-6r concentrations with respect to 1q21 status. (C) MMPC IL-6r expression levels with respect to rs2228145 status. (D) MMPC IL-6r expression levels with respect to 1q21 status.
Serum sIL-6r concentration and MMPC IL-6r expression in relation to rs2228145 genotype and MMPC 1q21 status in 626 MM patients. (A) Serum sIL-6r concentrations with respect to rs2228145 status. (B) Serum sIL-6r concentrations with respect to 1q21 status. (C) MMPC IL-6r expression levels with respect to rs2228145 status. (D) MMPC IL-6r expression levels with respect to 1q21 status.
Combination of rs2228145 minor allele and chromosome 1q21 amplification is related to significantly increased serum sIL-6r levels
To investigate whether sIL-6r levels among the 3 allele groups of MM patients could be further stratified, we annotated the 626 MM patients by chromosome 1q21 status of MMPCs (NL, no amplification; Amp, amplification) to reveal the 6 MM groups: AA NL, AA Amp, AC NL, AC Amp, CC NL, and CC Amp.
Further subgrouping the subjects offered clearer insight into the fine-tuning of sIL-6r concentrations. The compounding effects that rs2228145 genotype and 1q21 status have on serum concentrations of sIL-6r in MM are seen incrementally as groups move from homozygous A without 1q21 amplification to homozygous C with 1q21 amplification (Figure 3B; Table 1). The association of high sIL-6r levels and PC 1q21 amplification suggests that the overproduction of this protein is significantly contributed by MMPCs. However, it remains unclear exactly how much of the total sIL-6r is supplied by MMPCs.
In this cohort of 626 MM patients, amplification of chromosome 1q21 in MMPCs was related to an increase in IL-6r expression and sIL-6r protein levels (Table 1, NL-Amp; Figure 4B,D). Expression levels of IL-6r were significantly different when 1q21 status was compared among like allele groups (Table 1, GEP P; like genotype, different 1q21 status), but expression levels were not significantly different compared with similar 1q21 status of dissimilar alleles (Table 1, GEP P; different genotype, like 1q21 status), indicating that rs2228145 genotype is unrelated to expression of the consensus IL-6r transcript.
Two MM comparison groups (AA Amp/AC NL) and (AC Amp/CC NL) were significantly different by GEP but not by ELISA (Table 1). The 2 groups seemed to have a plateau effect of sIL-6r levels as groups transitioned from AA to AC and from AC to CC allele groups. The plateau of sIL-6r levels in the transition groups also can be seen in Figure 3B that shows that there is not a linear progression but an incremental stair step succession of sIL-6r levels across groups.
As mentioned previously, the difference in sIL-6r concentrations between ND and MM subjects with the same rs2228145 allele was not as significant as ND and MM groups alone (Table 1, ELISA P; ND vs MM). To better refine the comparison between ND, MM, and allele groups, we further segregated MM based on 1q21 status (Table 1, ELISA P; ND vs MM: 1q21 status and genotype). MM subjects with normal 1q21 status did not have significantly different sIL-6r levels from ND participants of the same allele group. These results suggest that the rs2228145 SNP plays a role in normal human variation of sIL-6r levels and amplification of chromosome 1q21 in MMPCs acts to intensify these normal differences.
These analyses suggest that neither 1q21 amplification nor rs2228145 minor allele can alone account for the significantly high sIL-6r levels. There seems to be a strong synergistic effect on sIL-6r levels by the combination of rs2228145 genotype and MMPC 1q21 status. However, there are probably other factors involved in regulation of sIL-6r protein concentrations not taken into account with these analyses as evidenced by some MM subjects with low sIL-6r levels while harboring the C allele and 1q21 amplification.
rs2228145 C allele is related to higher splice-variant expression levels and may further contribute to serum sIL-6r concentrations
A DS–IL-6r transcript variant has been putatively described as being translated directly into the soluble form of IL-6r.7 The splice variant lacks a 94-bp sequence that codes in part for the transmembrane domain that prevents the isoform from becoming membrane-bound, resulting in the production of a counterpart to sIL-6r that has been enzymatically shed.
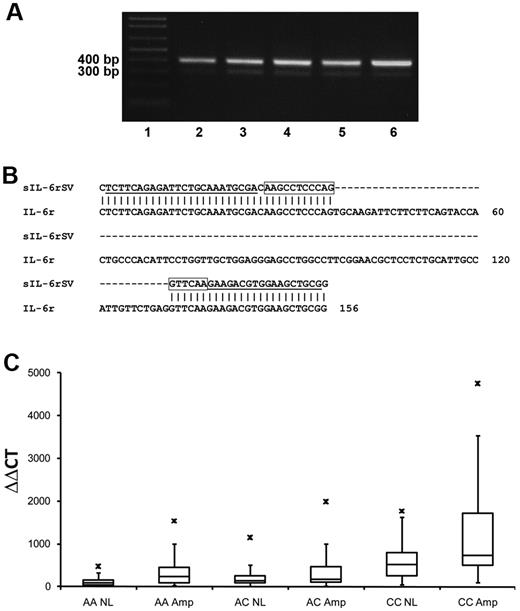
To test whether the DS–IL-6r is transcribed in all 3 allele groups, 5 MMPC samples were chosen based on rs2228145 status. The splice variant (NCBI accession NM_181359) was confirmed by PCR (Figure 5A) with the use of primers previously described8 and the distinctive 304-bp fragment was sequenced in all 5 cases (Figure 5B). The 398-bp consensus IL-6r fragment (NCBI accession NM_000565) also is seen in Figure 5A.
Analysis of DS–IL-6r in MMPC by RT-PCR, sequencing, and qRT-PCR. (A) RT-PCR fragments of the consensus IL-6r (398 bp) and DS–IL-6r (304 bp) in MMPCs from 5 untreated patients. Lane 1, 100-bp DNA ladder (Invitrogen); lane 2, rs2228145 homozygous A patient; lane 3, rs2228145 homozygous C patient; lane 4, rs2228145 heterozygous patient; lane 5, rs2228145 homozygous C patient; and lane 6, rs2228145 homozygous C patient. (B) Alignment of partial sequences from RT-PCR fragments of the DS–IL-6r and the consensus IL-6r transcripts. The deleted 94-bp region can be seen in the alignment. Underlined sequences represent primer targets, and boxed sequences represent reporter target for qRT-PCR of DS–IL-6r. (C) qRT-PCR of DS–IL-6r expression in 106 baseline MM PCs. The rs2228145 allele C and chromosome 1q21 amplification are associated with higher DS–IL-6r expression levels.
Analysis of DS–IL-6r in MMPC by RT-PCR, sequencing, and qRT-PCR. (A) RT-PCR fragments of the consensus IL-6r (398 bp) and DS–IL-6r (304 bp) in MMPCs from 5 untreated patients. Lane 1, 100-bp DNA ladder (Invitrogen); lane 2, rs2228145 homozygous A patient; lane 3, rs2228145 homozygous C patient; lane 4, rs2228145 heterozygous patient; lane 5, rs2228145 homozygous C patient; and lane 6, rs2228145 homozygous C patient. (B) Alignment of partial sequences from RT-PCR fragments of the DS–IL-6r and the consensus IL-6r transcripts. The deleted 94-bp region can be seen in the alignment. Underlined sequences represent primer targets, and boxed sequences represent reporter target for qRT-PCR of DS–IL-6r. (C) qRT-PCR of DS–IL-6r expression in 106 baseline MM PCs. The rs2228145 allele C and chromosome 1q21 amplification are associated with higher DS–IL-6r expression levels.
On the basis of the 304bp DS–IL-6r sequences (Figure 5B), a TaqMan assay was designed to quantify the transcript by relative qRT-PCR. Expression levels of DS–IL-6r were quantified in 106 baseline MMPC samples. All MMPC samples were positive for DS–IL-6r, and expression levels were significantly different with respect to 1q21 amplification status (P = .008). When qRT-PCR levels were further segregated according to rs2228145 allele status (Figure 5C), the plot revealed a resemblance to protein levels in Figure 3B. The AC group (n = 52) was insignificantly higher than the AA group (n = 29; P = .0567). But the CC group (n = 25) was significantly higher than the AA and AC groups (P < .001). A comparison of DS–IL-6r expression levels of homozygous groups of like 1q21 status revealed significant differences as well. Expression levels were significantly higher in the CC-NL group (n = 13) than the AA-NL group (n = 14; P = .003) and significantly higher in the CC-Amp group (n = 12) than the AA-Amp group (n = 15; P < .001). DS–IL-6r expression levels significantly increase not only with amplification of 1q21 but also with incidence of rs2228145 allele C.
The GEP probe set used for IL-6r expression analysis targets both consensus and variant transcripts. A correlation between the C allele and variant expression (by TaqMan) but not overall IL-6r expression (by GEP) is seen and may indicate that the DS–IL-6r transcripts are synthesized posttranscriptionally, influenced by the rs2228145 minor allele. The rs2228145 minor allele may be associated with alternative splicing of the IL-6r precursor mRNA (pre-mRNA), possibly by augmenting exonic splicing. A possible explanation of these findings may be that the percentage of IL-6r pre-mRNA spliced into DS–IL-6r changes with respect to rs2228145 genotype (Figure 5C), whereas the overall IL-6r expression levels do not change with respect to rs2228145 genotype (Figure 4C). This could clarify why we see expression levels of DS–IL-6r but not consensus IL-6r change with respect to the rs2228145 minor allele C.
Although we see significant differences in variant transcripts of IL-6r mRNA with respect to the rs2228145 minor allele, it remains unclear whether these differences are seen by protein analysis as well. It has been reported that the DS–IL-6r protein is detectable by the ELISA kit used in this study20 ; therefore, we were unable to address differences in sIL-6r isoform concentrations with respect to the rs2228145 minor allele.
Amplification of chromosome 1q21 can result in loss of heterozygosity at the rs2228145 locus
Because of the incidence of 1q21 amplification, we tested whether loss of heterozygosity could further differentiate protein levels within the heterozygous group. We speculated that patients with a gain of allele C (loss of allele A) would exhibit higher sIL-6r levels than those with a gain of allele A (loss of allele C). We also speculated that significant differences in sIL-6r levels between the group with a gain of allele C and the group without 1q21 gain would be more significant than levels between the group with gain of allele A and the group without 1q21 gain. Furthermore, we wanted to investigate the possibility of there being a preferential gain of 1 of the alleles.
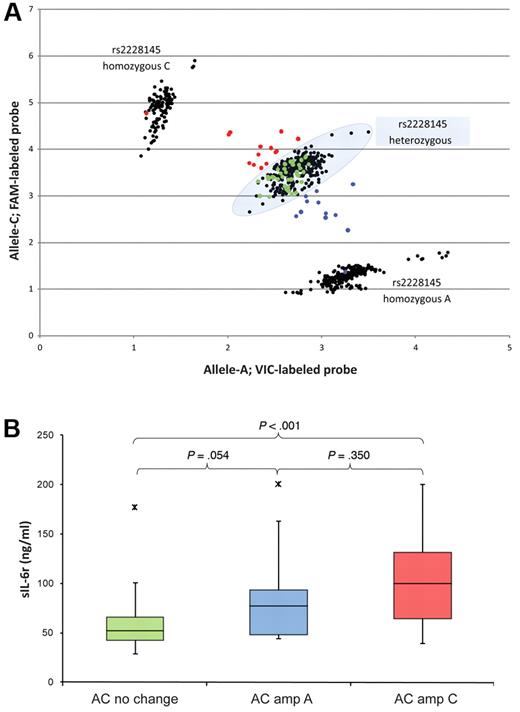
To test our hypothesis, we analyzed DNA isolated from MMPCs of 64 patients. These patients were genotyped as heterozygous for the rs2228145 SNP in their PBSC DNA. The entire heterozygous group (n = 299) was defined by segregation within a strict boundary (Figure 6A shaded oval), and the PC allelic discrimination data (n = 64) were compared relative to the entire PBSC heterozygous group. The PC data points were called according to where they graphed in relation to the preset boundary: samples within the oval boundary (green points) were deemed to have no allele change, samples shifting toward the CC group (red points) were deemed to have a gain of C, and samples shifting toward the AA group (blue points) were deemed to have a gain of A. Our data suggested that there is not a preferential gain of either allele.
Effects on serum sIL-6r concentrations by LOH in 64 baseline MM patients. (A) Scatter plot of rs2228145 genotype in 626 PBSC (black) and 64 PC (red, green, and blue) samples; the heterozygous group is identified by the shaded oval. The 64 patients used for loss of heterozygosity analysis were identified as heterozygous in germ line samples. Of the 64 PC samples, 38 showed no sign of allele change by scatter plot (green; AC–No change), 14 showed a gain of allele C (red; AC–Amp C), and 12 showed a gain of allele A (blue; AC–Amp A). (B) Serum sIL-6r levels in the 64 patients, segregated by allele change and color-coded to match panel A.
Effects on serum sIL-6r concentrations by LOH in 64 baseline MM patients. (A) Scatter plot of rs2228145 genotype in 626 PBSC (black) and 64 PC (red, green, and blue) samples; the heterozygous group is identified by the shaded oval. The 64 patients used for loss of heterozygosity analysis were identified as heterozygous in germ line samples. Of the 64 PC samples, 38 showed no sign of allele change by scatter plot (green; AC–No change), 14 showed a gain of allele C (red; AC–Amp C), and 12 showed a gain of allele A (blue; AC–Amp A). (B) Serum sIL-6r levels in the 64 patients, segregated by allele change and color-coded to match panel A.
We then compared sIL-6r levels of the 64 MM patients on the basis of their PC rs2228145 allele status (Figure 6B). The rs2228145 allelic discrimination plot (Figure 6A) and sIL-6r concentrations (Figure 6B) of the 64 MM patients are color-coded: green points/box represent no allele shift (AC–No change), blue points/box represent a shift toward allele A (AC–Amp A), and red points/box represent a shift to allele C (AC–Amp C). The red and blue (AC–Amp) samples were called amplification by vCA in 20/26 (76.9%) cases. The green (AC–No change) samples were called no amplification by vCA in 29/38 (76.3%) cases.
The AC–Amp C group had significantly higher sIL-6r levels than the AC-No change group (P < .001). This result fit well with our hypothesis and model of 626 MM patients. However, the AC–Amp A group had insignificantly higher sIL-6r levels than those of the AC–No change group (P = .054). This result also fit with the model of 626 MM patients where insignificant differences were seen in sIL-6r levels between the transition group (AA Amp/AC NL). This plateau effect was seen between the AA Amp and AC NL groups, as well as between the AC Amp and CC NL groups. Differences in sIL-6r concentrations between the AC–Amp A and the AC–Amp C groups were insignificant (P = .350). This result did not fit with our hypothesis or the model. Possible explanations may include the fact that both groups have 1q21 amplification and the possibility of other factors influencing sIL-6r levels not taken into consideration with these experiments.
Baseline serum sIL-6r levels are prognostically significant in MM patients
The optimal survival cut point for sIL-6r concentrations was defined in the cohort of 626 MM patients as 81.5 ng/mL by the running log-rank test. Patients with concentrations greater than or equal to 81.5 ng/mL were assigned to the sIL-6r high-risk group, and patients with concentrations less than 81.5 ng/mL to the sIL-6r low-risk group. High sIL-6r levels point to negative prognostic indicators (Table 3). Univariate and multivariate analyses pointed to baseline sIL-6r levels greater than or equal to 81.5 ng/mL as being significantly relevant with respect to hazard ratio and overall survival (Table 4). High sIL-6r concentrations were associated with higher levels of β2-microglobulin, creatinine, and lactate dehydrogenase, a higher incidence of cytogenetic abnormalities, and lower hemoglobin levels (Table 3).
GEP-associated factors related to sIL-6r levels (Tables 3,Table 4–5) included the GEP 70-gene high-risk, proliferation index, and MM molecular subgroups described by Zhan et al.21 MM molecular subgroups associated with high sIL-6r values included LB, MF, and PR (Tables 3 and 5). Molecular subgroups CD-2 and HY are more likely to have low sIL-6r levels (Table 3). Kaplan–Meier analysis revealed a significant difference in overall survival between the high- and low-risk sIL-6r groups (P < .0001; Figure 7A).
OS of 626 MM patients. (A) Overall survival (OS) based on high- versus low-risk sIL-6r groups defined by the 81.5 ng/mL cut point. (B) OS based on a combination of the 70-gene GEP model of high- and low-risk disease with the high/low risk conferred by sIL-6r level: a indicates low risk by the 70-gene model and low risk by sIL-6r level; b, low risk by the 70-gene model and high risk by sIL-6r level; c, high risk by the 70-gene model and low risk by sIL-6r level; and d, high risk by the 70-gene model, and high risk by sIL-6r level.
OS of 626 MM patients. (A) Overall survival (OS) based on high- versus low-risk sIL-6r groups defined by the 81.5 ng/mL cut point. (B) OS based on a combination of the 70-gene GEP model of high- and low-risk disease with the high/low risk conferred by sIL-6r level: a indicates low risk by the 70-gene model and low risk by sIL-6r level; b, low risk by the 70-gene model and high risk by sIL-6r level; c, high risk by the 70-gene model and low risk by sIL-6r level; and d, high risk by the 70-gene model, and high risk by sIL-6r level.
Combining sIL-6r levels with the GEP 70-gene risk model identifies an intermediate-risk group
The risk status of a validated 70-gene risk model has been reported to be an independent predictor of outcome in MM.18 This model uses the expression profile of 70 genes in MMPCs to generate a risk score. Given the significance of overall survival lent by sIL-6r levels and the 70-gene risk model, we integrated the 2 models to identify 4 groups of patients: (1) low risk by both the 70-gene model and sIL-6r level; (2) low risk by the 70-gene model and high risk by sIL-6r level; (3) high risk by the 70-gene model and low risk by sIL-6r level; and (4) high risk by both the 70-gene model and sIL-6r level. Incidence of rs2228145 allele status, 1q21 status and sIL-6r concentrations of the 4 risk groups are shown in Table 6. Overall survival of the 4 groups is shown in Figure 7B.
High-risk MM as defined by the 70-gene model has an inherently low survival rate. The addition of sIL-6r status does not significantly subgroup the 70-gene high-risk patients (P = .84). However, the 70-gene low-risk group is significantly stratified by inclusion of sIL-6r risk status (P < .001).
Discussion
Although the sIL-6r has been implicated in overall survival of MM, it has not been completely apparent how extraordinarily high circulating serum levels accumulate or to what extent MMPCs contribute to sIL-6r concentrations. It has been suggested that sIL-6r is not related to tumor burden in MM.22 Gaillard et al showed that sIL-6r levels remained stable and consistent regardless of whether patients relapsed or entered remission by following 4 MM patients for up to 760 days with serial serum sIL-6r testing.22 We do not suggest that sIL-6r is an indicator of MM tumor burden, because only ∼ 20% of the 626 patients in our cohort had high-risk sIL-6r levels of greater than or equal to 81.5 ng/mL. In fact, more than 75% of the patients in this study had sIL-6r levels less than or equal to the highest normal control of 73.1 ng/mL.
We show 2 specific molecular genetic events, rs2228145 minor allele and chromosome 1q21amplification, working in concert to raise sIL-6r levels and lower prognostic outcome in a subset of MM. Furthermore, combining the GEP 70-gene risk model with sIL-6r levels identifies an intermediate-risk group (low 70-gene risk, high sIL-6r risk).
An increase in copy number of the 1q21 locus has been reported to be a negative prognostic indicator in MM,23 and chromosomal aberrations of chromosome 1q have been linked to various acquired24 and inherited25,26 diseases and disorders. Univariate analysis in this cohort of 626 MM patients reconfirms that amplification of chromosome 1q21 as determined by vCA is a significant prognostic factor; however, multivariate analysis revealed serum sIL-6r concentrations to be a better independent prognostic indicator than 1q21 amplification as determined by vCA (Table 4).
The report by Aladzsity et al on the incidence of the rs2228145 SNP in myelodysplasia and MM found the following allele frequencies in MM: AA, 37%; AC, 50%; and CC, 13%.27 These frequencies closely resemble our findings (Table 2). Aladzsity et al showed no significant difference between the 2 disease groups and normal controls27 ; taken at face value, these results suggest that the SNP is not related to MM or outcome. However, we have shown that the rs2228145 SNP and its association with survival in MM patients are not so straightforward, given the additional variable of 1q21 amplification in MM. We do not propose that harboring the rs2228145 SNP minor allele predisposes to MM or any other disease, but it may represent one “hit” as suggested by the Knudson hypothesis.
The missense mutation Asp358Ala caused by the rs2228145 SNP minor allele may yield a cleavage site that is common to several ADAMs. Chesneau et al showed that the metalloproteinases ADAM19, TACE, ADAM28, and ADAM10 could all cleave myelin basic protein between the amino acid residues A–S.28 This is the same sequence formed by the missense Asp358Ala polymorphism, suggesting that the Asp358Ala mutation could be susceptible to more than one metalloproteinase. It has been suggested elsewhere that ADAM1013 and TACE29 are contributors to IL-6r shedding; however, these studies do not experimentally take the IL-6r Asp358Ala amino acid change into account.
We show for the first time an association between the rs2228145 SNP minor allele and expression levels of the DS–IL-6r transcript. The rs2228145 minor allele may be associated with alternative splicing of the IL-6r pre-mRNA, possibly by augmenting exonic splicing. Hull et al have described splicing patterns determined by SNPs located within flanking introns or exons, pointing to SNPs as a culprit of cis-acting splice regulation.30 SNP rs2228145 is the seventh nucleotide of exon 9 of the IL-6r gene. It remains unclear whether shedding or pre-mRNA splicing is the major contributor to serum sIL-6r levels in MM; nevertheless, the rs2228145 SNP minor allele and chromosome 1q21 amplification are strongly related to high serum sIL-6r levels. It is possible that the mechanism(s) of sIL-6r production (shedding and splicing) can vary among individuals, as well as in an individual over time.
Our results in Figure 7B suggest that serum sIL-6r levels are yet 1 more layer of the molecular genetic chaos that make up MM. Figure 7B reconfirms the strength of survival prediction by the GEP 70-gene risk score, with sIL-6r levels simply aiding in survival stratification of low-risk disease. Because sIL-6r levels cannot significantly stratify the 70-gene high-risk group, it is suggestive that the mechanism(s) driving the 70-gene high-risk group are more powerful at lowering survival than that of sIL-6r.
The highest percentage of the low bone (LB) disease class of MM is seen in the 70-gene low-risk/high-sIL6r group (Table 5). Features of LB include the low incidence of bone lesions, lower DKK1 expression, and high IL-6r expression.31 The highest percentage of CD-2 class are seen in the 70-gene low-risk/low-sIL6r group (Table 5). CD-2 is characterized by the translocation t(11;14), a translocation that has been associated with lower IL-6r levels.32 The proliferation (PR) class, associated with lower survival rates, is seen in ∼ 41% of the 70-gene high-risk group and ∼ 7% of the 70-gene low-risk group of this cohort (Table 5).
It has been shown that IL-6 can protect MM cells from spontaneous,33 and from drug-induced apoptosis.34,35 It has been suggested that an autocrine IL-6 loop is functional in preplasma cells of MM but the mature myeloma PCs are not targeted by IL-6 signaling. In the same report it was shown that MM cells from only 68% of patients express IL-6r, and among them expression is restricted to the less mature CD45+ cells.36 It also has been shown that IL-6 signaling has a major role in proliferation of bone marrow plasmablasts.37
Of the 545 70-gene low-risk MM patients in this study, ∼ 17% (94/545) have high sIL-6r concentrations. This intermediate-risk group represents ∼ 15% (94/626) of all patients in this study. By revealing the layers and further subgrouping MM, we may be able to form a clearer picture of the interworkings of this disease. The emergence of an intermediate-risk group derived from the 70-gene low-risk group based on high sIL-6r levels may offer insight into cases of low-risk MM with poor outcome. The subclassification of MM partially based on sIL-6r may aid in identifying a tailored therapy and provide opportunities to specifically treat those 70-gene low-risk/high-sIL-6r patients.
The 626 MM serum samples represent patients enrolled in several protocols; therefore, further analysis is needed to determine whether protocol-specific cut points for sIL-6r levels are informative. Log-rank and survival analysis of sIL-6r by individual protocols may help reveal how different therapeutic regimens affect the intermediate-risk patients. Future and ongoing studies involve analysis of sIL-6r with respect to specific MM therapy protocols, MM progression, involvement in the bone marrow microenvironment, and biology of IL-6r isoforms in MM.
The online version of the article contains a data supplement.
The publication costs of this article were defrayed in part by page charge payment. Therefore, and solely to indicate this fact, this article is hereby marked “advertisement” in accordance with 18 USC section 1734.
Acknowledgments
This work was supported by National Cancer Institute grant PO1CA055819, the Nancy and Stephen Grand Philanthropic Foundation, and the LeBow Fund to Cure Myeloma.
National Institutes of Health
Authorship
Contribution: O.W.S. designed and performed experiments, analyzed data, and wrote the paper; Q.Z. analyzed data, edited the paper, and developed vCA model; P.Q. performed statistical analysis; Y.Z. edited the paper and developed vCA model; S.C. analyzed data; E.T. provided helpful discussion; D.R.W. managed sample procurement; J.E. provided SWOG 0120 serum samples and helpful discussion; and B.B. and J.D.S. conceptualized and supervised research and analyzed data.
Conflict-of-interest disclosure: J.D.S. is a founder and has an ownership stake in Signal Genetics, LLC, a biotechnology company that has licensed said technology from the University of Arkansas for purposes of commercial development purposes. J.D.S. holds patents, or has submitted patent applications, on the use of GEP in cancer medicine. J.D.S. receives royalties related to patent licenses from Genzyme, Novartis, and Signal Genetics. J.D.S. has received research funding from Celgene, Millennium, and Novartis. J.D.S. has advised Celgene, Genzyme, Millennium, and Novartis and has received speaking honoraria from Celgene, ArrayBioPharma, Centocor Ortho Biotech, Genzyme, Millennium, and Novartis. B.B. has received research funding from Celgene and Novartis; he is a consultant to Celgene and Genzyme and has received speaking honoraria from Celgene and Millennium. B.B. is a coinventor on patents and patent applications related to use of GEP in cancer medicine. The remaining authors declare no competing financial interests.
Correspondence: John D. Shaughnessy Jr, 4301 West Markham, Little Rock, AR 72205; e-mail: jdsjr@me.com.

