Abstract
Regulatory T cells (CD4+CD25hiCD127loFOXP3+ T cells [Tregs]) are a population of lymphocytes involved in the maintenance of self-tolerance. Abnormalities in function or number of Tregs are a feature of autoimmune diseases in humans. The ability to expand functional Tregs ex vivo makes them ideal candidates for autologous cell therapy to treat human autoimmune diseases and to induce tolerance to transplants. Current tests of Treg function typically take up to 120 hours, a kinetic disadvantage as clinical trials of Tregs will be critically dependent on the availability of rapid diagnostic tests before infusion into humans. Here we evaluate a 7-hour flow cytometric assay for assessing Treg function, using suppression of the activation markers CD69 and CD154 on responder T cells (CD4+CD25− [Tresp]), compared with traditional assays involving inhibition of CFSE dilution and cytokine production. In both freshly isolated and ex vivo expanded Tregs, we describe excellent correlation with gold standard suppressor cell assays. We propose that the kinetic advantage of the new assay may place it as the preferred rapid diagnostic test for the evaluation of Treg function in forthcoming clinical trials of cell therapy, enabling the translation of the large body of preclinical data into potentially useful treatments for human diseases.
Introduction
Immunologic tolerance to self-components is critically dependent on a balance between regulatory T cells (CD4+CD25hiCD127lo FOXP3+ [Tregs]) and inflammatory T helper (Th) 1 and Th17 lineages, which are associated with autoimmune diseases and transplant rejection.1-3 This balance is suggested by abnormalities of Treg number or function in human autoimmune diseases1,4-8 and by the induction of autoimmune diseases in animal models through excess Th1 and/or Th17 in the absence of defective Tregs.9-12 Because broad-spectrum immunosuppressive drugs target both Th1 and Th17 cells nonspecifically and have unacceptable long-term adverse effects,13-15 a more viable therapeutic intervention is cell therapy with autologous Tregs.16 Autologous or adoptive cell therapy with Tregs for the treatment of autoimmune diseases or the induction of tolerance to transplanted tissues is now a realistic possibility, facilitated by the fact that freshly isolated Tregs can be selected and expanded in vitro under good manufacturing practice (GMP) conditions and retain their function before infusion into humans.16-18 Indeed, small-scale trials have demonstrated beneficial outcomes in the prevention or treatment of human GVHD after bone marrow transplantation.17,19
Two approaches to Treg cell therapy are possible: either local administration of freshly isolated Tregs from patients or parenteral infusion of cells that have undergone several rounds of expansion in vitro. With both approaches, a successful program of cell therapy relies critically on accurate assessment of the suppressive capability of Tregs immediately before administration into patients. The gold standard methods for assessment of suppressive function, inhibition of proliferation, or cytokine production in coculture with responder T cells (CD4+CD25− [Tresp]) involve 4- to 5-day in vitro culture. This represents a distinct kinetic disadvantage because Tregs intended for therapy will be 4 to 5 days older by the time results from are available. As ex vivo expanded Tregs have finite life spans, maintaining suppressive function for a maximum of 4 to 6 weeks in vitro (our observations), successful cell therapy will require a rapid test of suppressive efficacy, available within 12 hours of setting up the assay.
T-cell activation is followed within hours by increased expression of surface markers, such as CD25, CD69, CD71, and CD154. CD69, a C-type lectin, is an early activation marker that can be reliably detected by flow cytometry.20 CD154 (CD40 ligand) is a costimulatory molecule expressed on activated T cells that engages CD40 on antigen-presenting cells, resulting in antigen-presenting cell activation and T-cell help to B cells.21,22 However, because CD154 is only transiently expressed on the cell surface,23,24 detection of CD154 expression in short-term cultures by flow cytometry can be achieved only by addition of fluorochrome-conjugated anti-CD154 monoclonal antibody to the cell culture, as CD154-bound antibody remains cell associated even if CD154 is internalized.25,26 In antigen-specific cultures using Staphylococcus enterotoxin B as an antigen, CD154 is maximally expressed by antigen-responsive TCR-Vβ12 CD4+ T cells within 4 to 12 hours, and high expression is maintained up to 24 hours.25,26 CD154 expression identifies activated CD4+ cells as evidenced by both subsequent cytokine production and cell proliferation. In this model, CD69 is also highly expressed on CD154-expressing cells at 6 hours. Consequently, staining for both CD154 and CD69 allows estimation of Tresp activation in short-term T-cell cultures, and inhibition of this activation by Tregs can act as an early readout for Treg-mediated suppression.
Here, we independently validate a novel flow-based assay of Treg function that takes advantage of Treg-mediated inhibition of expression of CD154 and CD69 on Tresps stimulated with anti-CD3/CD28 beads and can be assessed 7 hours after coculture. Suppression of Tresp surface marker expression at 7 hours by both freshly isolated CD4+CD25hiCD127lo Tregs and in vitro expanded GMP-compliant Tregs (GMP-Tregs) is compared with inhibition of CFSE dilution and cytokine production at 4 days, demonstrating significant correlation between the novel and gold standard assays of Treg function. These data are then used to develop critical values for the 7-hour assay as a “diagnostic test” of fresh and GMP-Treg function. Finally, we propose that this assay should be incorporated into the protocols of forthcoming clinical trials of Tregs in blood, renal and liver transplantation, and autoimmune disease, where it will improve patient safety by dramatically shortening the time required for functional testing of cellular products, enabling assessment and infusion of GMP-Tregs on the same day.
Methods
Patient samples
PBMCs were obtained from anonymized human leukocyte cones supplied by the United Kingdom Blood Transfusion Service, after institutional review board approval (Hammersmith, Queen Charlotte's & Chelsea Research Ethics Committee, reference 09/H0707/86). Freshly isolated CD4+CD25hiCD127lo Tregs were evaluated from 10 independent donors using autologous Tresps. GMP-Treg lines were evaluated from 4 independent donors.
CD4+ T-cell enrichment
PBMCs were obtained from cones (National Blood Transfusion Center, United Kingdom) by density centrifugation over Lymphocyte Separation Medium LSM 1077 (PAA Laboratories) and enriched for CD4+ lymphocytes by negative selection using a MACS CD4+ T cell isolation kit II (Miltenyi Biotec) according to the manufacturer's instructions. Enrichment was typically to more than 90% CD4+ lymphocytes.
FACS
Cell sorting was carried out using a Human Regulatory T Cell Sorting Kit (BD Biosciences), according to the manufacturer's instructions. Briefly, enriched CD4+ cells were labeled with anti–CD4-PerCP-Cy5.5 (clone L200), anti-CD25–PE (clone 2A3), and anti-CD127–AlexaFluor 647 (clone 40131.111) before FACS sorting to CD4+CD25hiCD127Lo Tregs and CD4+CD25− Tresps on a FACSAria (BD Biosciences). Sorting purity was more than 95%, and viability was confirmed by microscopy with trypan blue stain.
Assessment of CD69 and CD154 expression in lymphocytes
The BD FastImmune Human Regulatory T Cell Function Kit (BD Biosciences) was used according to the manufacturer's instructions to determine the cell surface expression of CD69 and CD154, and the suppression of same during coculture with Tregs. Briefly, 5 × 10⁴ Tresps per well were cultured either alone or in coculture with Tregs at Tresp:Treg ratios titrated from 1:1 to 32:1 (constant Tresp numbers) in 96-well U-bottomed plates (Nunc) in a total volume of 220 μL of complete medium (RPMI 1640 medium, PAA; supplemented with 10mM HEPES, Fisher Scientific; 2mM l-glutamine, 100 U/mL penicillin, 100 μg/mL streptomycin, 1mM sodium pyruvate, 0.1mM MEM nonessential amino acids, and 10% human AB serum, Biosera). Tresps were stimulated with anti-CD3/CD28–coated beads (Dynabeads) at a bead/Tresp ratio of 0.2. Anti-CD154–allophycocyanin (clone 89-76) antibody was added at time 0 to capture transient cell surface expression of CD154 during Tresp activation.25 Appropriate controls were included, such as unstained unstimulated, stained unstimulated, and stained stimulated Tresp conditions. After incubation at 37°C/5% CO2 for 7 hours, cells were stained as required with an antibody cocktail of anti–CD3-PerCP–Cy5.5 (SK7), CD4-FITC (SK3), CD25-PE (2A3), and CD69-PE–Cy7 (L78) and acquired on an LSR II cytometer (BD Biosciences) running FACSDiva 6.1.3 software. The gating strategy for analysis of suppression of CD69 and CD154 frequency in Tresps is shown in supplemental Figure 1A through D (see the Supplemental Materials link at the top of the article). As Tregs also express CD69 and CD154 on activation, Tregs were excluded from the analysis by gating on only CD4+CD25− events, obviating the need to label Tregs or Tresps with a fluorescent dye, which may itself affect T-cell function. To validate this approach, we confirmed that gating on CD25− Tregs compared with all Tresps (by labeling the Tregs) yields identical results (supplemental Figure 1E-F). Optimum activation conditions were identified by titration of anti-CD3/CD28 coated microbeads, confirming suboptimal expression of CD69 and CD154 on Tresps at bead/Tresp ratios less than 0.2 (data not shown). As a result, all experiments were carried out at a bead/Tresp ratio of 0.2. In all cases, percentage suppression (S) of marker frequency was calculated using the after formula:
where a is percentage positive in the presence of Tregs and b is percentage positive in the absence of Tregs.
Proliferation assay
Tresps were labeled with 1μM CFSE (Celltrace, Invitrogen) according to standard protocols and cultured alone or in coculture with Tregs at Tresp/Treg ratios titrated from 1:1 to 32:1 (constant Tresp numbers). Tresps were stimulated with anti-CD3/CD28–coated beads at bead/Tresp ratios of 0.02. Assessment of proliferation by flow cytometry was performed at 96 hours. Cells were acquired in a total volume of 300 μL containing 30 μL counting beads (CountBright; Invitrogen). Acquisition was limited by gating on counting beads, collecting at least 5000 events per sample. Dead cells were stained with propidium iodide (Invitrogen) or Live/Dead Yellow (Invitrogen) according to the manufacturer's instructions and excluded from analysis. The numbers of nonproliferating cells (events in the first peak) and precursors of proliferating cells were calculated using standard formulas.27 Percentage suppression (S) of proliferation was calculated using the after formula:
where c is percentage proliferating precursors in the presence of Tregs and d is percentage proliferating precursors in the absence of Tregs.
Estimation of cytokine concentrations
Cytokine concentrations were estimated in culture supernatants using the BD Cytometric Bead Array Human Th1/Th2/Th17 Cytokine Kit (BD Biosciences), according to manufacturer's instructions. Briefly, 50 μL of culture supernatant was incubated with cytokine capture beads and PE detection reagent for 3 hours at room temperature in the dark, before washing and acquisition on a Fortessa cytometer (BD Biosciences). Cytokine concentrations were interpolated from contemporaneously acquired standard curves.
Ex vivo expansion of Tregs
CD4+ lymphocytes were obtained from human buffy coats as described in “CD4+ T-cell enrichment” and then enriched for CD25 by positive MACS selection (CD25 microbeads II, Miltenyi Biotec). Enriched CD4+CD25+ cells were typically more than 95% CD25hiFOXP3+ (data not shown). Cells were plated at 106/mL in X-VIVO 15 medium (Lonza) supplemented with 5% pooled AB human serum (Biosera), with 100nM rapamycin28,29 (LC Laboratories). Cells were activated with anti-CD3/CD28–coated beads at a 1:1 bead:cell ratio. Human recombinant IL-2 (1000 IU/mL; Proleukin, Novartis) was added to the culture at day 2 and replenished every second day. Every 10 days, beads were removed by magnetic adherence and cells were restimulated with new anti-CD3/CD28 beads at a 1:1 ratio. Fresh rapamycin and IL-2 were added at the same time. Autologous CD4+CD25− Tresps were obtained at the same time and stored at −80°C for later use in suppression assays. The suppressive function of ex vivo expanded Treg lines was assessed after 28 days of culture.
Data analysis and statistics
Flow cytometric data were analyzed with FlowJo (TreeStar) or FACSDiva (BD Biosciences). Statistical analysis was performed using GraphPad Prism 5.0d for Mac OSX (GraphPad Software). Statistical analysis of the performance of CD69 and CD154 suppression at 7 hours as a “diagnostic test” for suppression of proliferation at 96 hours was performed using XLSTAT (Addinsoft) and Microsoft Excel 2011 (Microsoft Corp).
Continuous data are presented as mean plus or minus SD or median (interquartile range [IQR]) for parametric and nonparametric data, respectively. Comparison of central tendency was performed using paired parametric (t tests) and nonparametric (Wilcoxon signed rank test) tests as appropriate. Similarly, multiple means (or ranks) were compared by 1-way ANOVA or Kruskal-Wallis test, as appropriate. Linear variables were compared using linear regression, yielding a regression coefficient (R2) and P value. Linear variables were compared with nonlinear variables (eg, 2-fold dilutions of Treg concentrations in coculture with Tresps) using semilogarithmic regression, yielding a regression coefficient (R2) alone.
The performance of CD69 and CD154 suppression at 7 hours as a “diagnostic test” for critical values of suppression of proliferation at 96 hours was examined using Bland-Altman plots30 and receiver operating characteristic (ROC) curves. The Youden index (sensitivity + specificity − 1)31 was used as a continuous variable to determine the range over which suppression of CD69 and CD154 performed optimally as a test to identify suppression of proliferation. The proportion of true-positive, false-positive, true-negative, and false-negative results was calculated and tabulated for critical values of CD69 and CD154 suppression in identifying critical values of suppression of proliferation. A P value of less than .05 was considered statistically significant throughout.
Results
In vitro suppressive effect of freshly isolated human Tregs at 7 hours
After optimizing the culture conditions for detection of the early activation markers CD69 and CD154 on Tresps (“Assessment of CD69 and CD154 expression in lymphocytes”; and supplemental Figures 1-4), we sought to determine whether freshly isolated Tregs could suppress cell surface expression of CD69 and CD154 at 7 hours. FACS-sorted Tresps were cultured both alone and together with autologous freshly isolated Tregs at Tresp/Treg ratios of 1:1 to 32:1 in the presence of anti-CD3/CD28–coated microbeads.
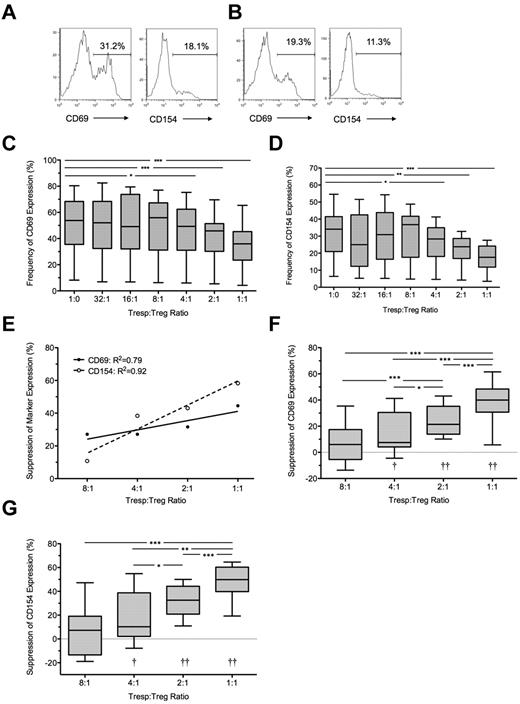
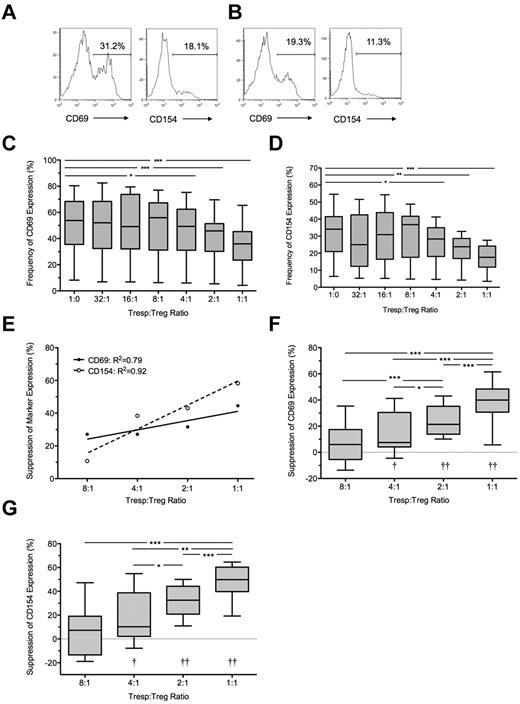
At 7 hours, the median frequency of CD69 and CD154 expression in unstimulated Tresps was 2.0% (IQR = 1.5%-2.6%, n = 10) and 1.8% (IQR = 0.8%-2.0%, n = 10), respectively (data not shown) and in anti-CD3/CD28–stimulated Tresps 54.1% (IQR = 34.5%-64.5%, n = 10) and 34.7% (IQR = 19%-40%, n = 10), respectively (Figure 1A-D). CD69 expression in stimulated Tresps was consistently higher than CD154 expression (P < .001; Figure 1C-D). The addition of autologous Tregs at a 1:1 ratio reduced median frequencies of CD69+ and CD154+ events in Tresps to 35.9% (IQR = 23.5%-45.3%, n = 10) and 17.6% (IQR = 11.8%-24.2%, n = 10) respectively, median suppression of 40% and 50%, respectively (P < .001 for both comparisons; Figure 1B,E-G). Percentage suppression correlated with the Tresp:Treg ratio, and statistically significant suppression could only be seen at a ratio of 4:1 (median = 7.5%, IQR = 4.1%-39.5%; and median = 10.2%, IQR = 2.1%-38.8% for CD69 and CD154, respectively, n = 10), 2:1 (median = 21.4%, IQR = 13.9%-35.2% and 32.5%, IQR 20.9%-44.2% for CD69 and CD154, respectively, n = 10), and 1:1. At higher dilutions, freshly isolated Tregs did not suppress the percentage of CD69+ or CD154+ Tresps (Figure 1E-G).
Suppression of CD69 and CD154 expression on Tresps by autologous freshly isolated Tregs. (A-B) Representative examples of CD69 and CD154 expression on Tresps either cultured alone (A) or cocultured with Tregs (B, here at a 1:1 Tresp:Treg ratio). (C-D) Box-and-whisker plots of pooled data from 10 independent experiments. (E,G) Percentage suppression of CD69 and CD154 on Tresps by Tregs showing a representative experiment (E) and box-and-whisker plots (F-G) of pooled data from 10 independent experiments. *P < .05, **P < .01, ***P < .001. †P < .05, ††P < .001 with respect to Tresp alone cultures (Tresp:Treg ratio of 1:0).
Suppression of CD69 and CD154 expression on Tresps by autologous freshly isolated Tregs. (A-B) Representative examples of CD69 and CD154 expression on Tresps either cultured alone (A) or cocultured with Tregs (B, here at a 1:1 Tresp:Treg ratio). (C-D) Box-and-whisker plots of pooled data from 10 independent experiments. (E,G) Percentage suppression of CD69 and CD154 on Tresps by Tregs showing a representative experiment (E) and box-and-whisker plots (F-G) of pooled data from 10 independent experiments. *P < .05, **P < .01, ***P < .001. †P < .05, ††P < .001 with respect to Tresp alone cultures (Tresp:Treg ratio of 1:0).
Under all conditions, a significant linear relationship was seen between both expression of CD69 and CD154 (R2 = 0.85; P < .0001) and percentage suppression of these markers by Tregs (R2 = 0.94; P < .0001).
Freshly isolated Treg-mediated suppression at 7 hours predicts suppression of proliferation at 96 hours
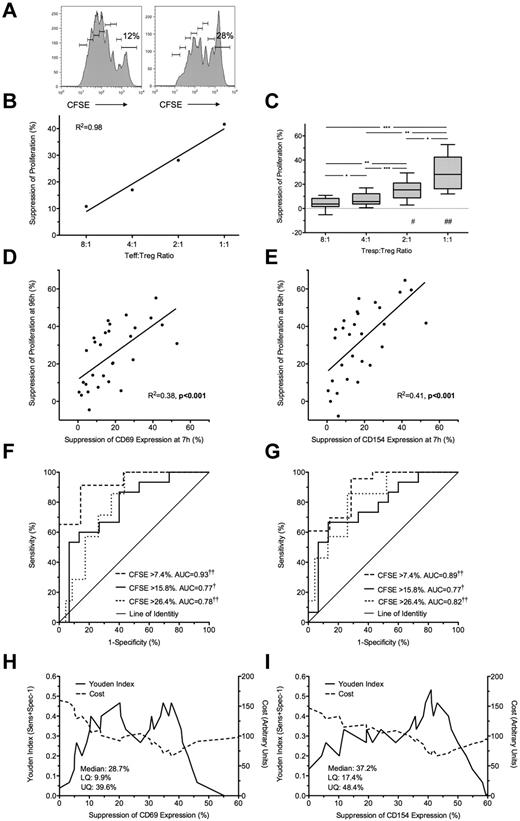
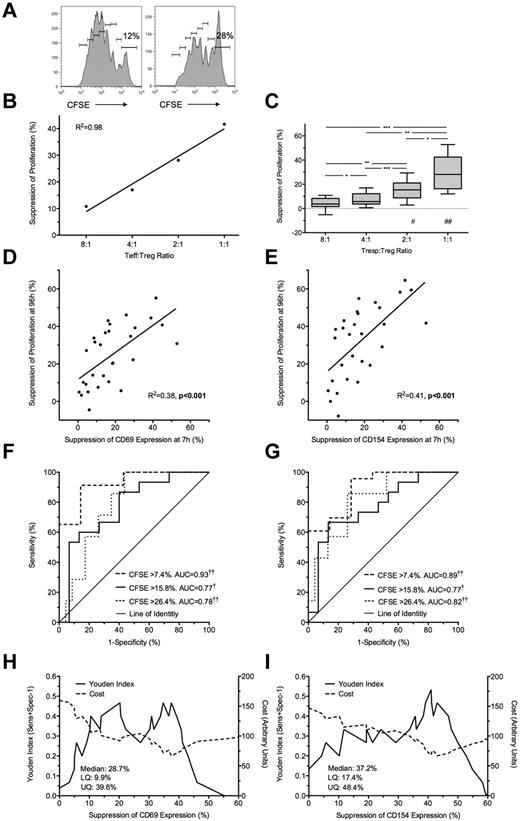
Freshly isolated Tregs were cultured with autologous (unlabeled and CFSE-labeled) Tresp at Tresp/Treg ratios of 1:1 to 32:1 and stimulated with anti-CD3/CD28 beads. Treg-induced inhibition of Tresp proliferation at 96 hours (Figure 2A-C) was compared with Treg-induced inhibition of CD69 and CD154 expression at 7 hours. The addition of Tregs at a 1:1 ratio was associated with a median of 28.2% (IQR = 16.3%-42.5%; n = 10) suppression of Tresp proliferation (Figure 2C). Significant suppression of proliferation was not seen at Tresp:Treg ratios more dilute than 4:1. Bland-Altman plots suggested that suppression of marker expression at 7 hours tended to overestimate suppression of proliferation at 96 hours by (mean ± SD) 6.1% ± 13.7% for CD69 and 11.9% ± 19.7% for CD154 (supplemental Figure 1G-H).
Suppression at 7 hours predicts suppression of proliferation at 96 hours. (A) Representative example of a 96-hour CFSE dilution assay, gated on live Tresps, cultured alone (left) or at a 1:1 Tresp:Treg ratio (right). (B-C) Suppression of proliferation at 96 hours at increasing Tresp/Treg ratios from a representative experiment (B) and pooled data from 10 independent experiments (C). (D-E) Comparison of suppression of CD69 (D) and CD154 (E) expression at 7 hours with paired suppression of autologous Tresp proliferation at 96 hours, with regression lines. (F-G) ROC curves illustrating the performance of CD69 suppression (F) and CD154 suppression (G) at correctly identifying suppression of Tresp proliferation at 96 hours, for 3 critical values of the CFSE dilution assay. (H-I) Performance of CD69 (H) and CD154 suppression (I) at correctly identifying median suppression of proliferation. Median and distribution statistics for each marker are also given. The left and right y-axes illustrate the Youden index for threshold values and arbitrary cost of threshold values, penalizing for false positives, respectively. (D-I) Pooled data from Tresp/Treg ratios 4:1 to 1:1 from 10 independent experiments. *P < .05, **P < .01, ***P < .001, †P < .005, ††P < .0001. UQ indicates upper quartile; and LQ, lower quartile. #P < .005, ##P < .0001 with respect to Tresp alone cultures (Tresp:Treg ratio of 1:0).
Suppression at 7 hours predicts suppression of proliferation at 96 hours. (A) Representative example of a 96-hour CFSE dilution assay, gated on live Tresps, cultured alone (left) or at a 1:1 Tresp:Treg ratio (right). (B-C) Suppression of proliferation at 96 hours at increasing Tresp/Treg ratios from a representative experiment (B) and pooled data from 10 independent experiments (C). (D-E) Comparison of suppression of CD69 (D) and CD154 (E) expression at 7 hours with paired suppression of autologous Tresp proliferation at 96 hours, with regression lines. (F-G) ROC curves illustrating the performance of CD69 suppression (F) and CD154 suppression (G) at correctly identifying suppression of Tresp proliferation at 96 hours, for 3 critical values of the CFSE dilution assay. (H-I) Performance of CD69 (H) and CD154 suppression (I) at correctly identifying median suppression of proliferation. Median and distribution statistics for each marker are also given. The left and right y-axes illustrate the Youden index for threshold values and arbitrary cost of threshold values, penalizing for false positives, respectively. (D-I) Pooled data from Tresp/Treg ratios 4:1 to 1:1 from 10 independent experiments. *P < .05, **P < .01, ***P < .001, †P < .005, ††P < .0001. UQ indicates upper quartile; and LQ, lower quartile. #P < .005, ##P < .0001 with respect to Tresp alone cultures (Tresp:Treg ratio of 1:0).
Because suppression of marker expression was only seen at a Tresp:Treg ratios of more than or equal to 4:1, further comparisons were limited to these experimental conditions. A statistically significant linear relationship was found between suppression of marker expression at 7 hours and proliferation at 96 hours for both CD69 (R2 = 0.38, P < .001; Figure 2D) and CD154 (R2 = 0.41, P < .001; Figure 2E).
Next, to determine the usefulness of marker suppression at 7 hours as a “diagnostic test” for suppression of proliferation at 96 hours, quartiles of suppression of proliferation (median = 15.8%, upper and lower quartiles of 7.4% and 26.4%) were used as critical values to generate ROC curves (Figure 2F-G). CD69 showed good discrimination with an area under the curve (AUC) of 0.93 (95% CI, 0.86-0.99; P < .0001) for suppression of proliferation more than or equal to 7.4%, AUC of 0.77 (0.61-0.93; P < .005) for suppression of proliferation more than or equal to 15.8%, and AUC of 0.78 (0.64-0.93; P < .0001) for suppression of proliferation more than or equal to 26.4% (Figure 2F). CD154 showed similarly good discrimination with AUC for suppression of proliferation more than or equal to 7.4% of 0.89 (0.79-1.00; P < .0001), AUC of 0.77 (0.62-0.93; P < .005) for suppression of proliferation more than or equal to 15.8%, and AUC of 0.82 (0.68-0.96; P < .0001) for suppression of proliferation more than or equal to 26.4% (Figure 2G).
The Youden index was then calculated for each critical value of CD69 and CD154 suppression and graphed to illustrate the range of each assay maximizing discrimination: approximately 33% to 39% suppression for CD69 and 38% to 46% suppression for CD154 (Figure 2H-I). An arbitrary cost was then assigned to each critical value to severely penalize the assay for false positives as false-positive results will be the most deleterious to programs of cell therapy. Threshold values of 37.4% and 43% suppression for CD69 and CD154, respectively, minimize the arbitrary cost of the assay and effectively exclude false positives (Figure 2H-I). The diagnostic characteristics of threshold values of CD69 and CD154 suppression at 7 hours in correctly identifying median suppression of proliferation at 96 hours are shown in Table 1.
Ex vivo expanded GMP-compatible Tregs mediate suppression of CD69 and CD154 on Tresps at 7 hours that predicts 96-hour regulation of proliferation
To determine whether suppression of CD69 and CD154 can be used as a test of the suppressive function of Tregs that have been expanded in vitro under GMP conditions (GMP-Tregs), Tregs were expanded from healthy donors and then used in coculture experiments with autologous Tresp. GMP-Tregs suppressed both CD69 and CD154 at 7 hours (Figure 3) and proliferation at 96 hours (Figure 4).
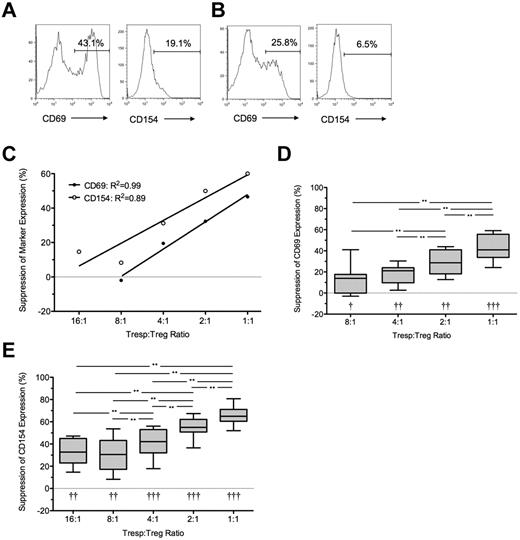
Suppression of CD69 and CD154 expression on Tresps by ex vivo expanded Tregs. (A-B) Representative examples of CD69 and CD154 expression on Tresps either cultured alone (A) or cocultured with ex vivo expanded Tregs (B, here at a 1:1 Tresp:Treg ratio). (C-E) Percentage suppression of CD69 and CD154 expression on Tresps by Tregs, showing a representative experiment (C) and box-and-whisker plots of pooled data from 8 independent experiments (D-E). Please note that the regression line for CD69 extends only from the 8:1 to 1:1 conditions as suppression was barely visible below the 4:1 ratio. **P < .01. †P < .05, ††P < .001, †††P < .0001 with respect to Tresp alone cultures (Tresp:Treg ratio of 1:0).
Suppression of CD69 and CD154 expression on Tresps by ex vivo expanded Tregs. (A-B) Representative examples of CD69 and CD154 expression on Tresps either cultured alone (A) or cocultured with ex vivo expanded Tregs (B, here at a 1:1 Tresp:Treg ratio). (C-E) Percentage suppression of CD69 and CD154 expression on Tresps by Tregs, showing a representative experiment (C) and box-and-whisker plots of pooled data from 8 independent experiments (D-E). Please note that the regression line for CD69 extends only from the 8:1 to 1:1 conditions as suppression was barely visible below the 4:1 ratio. **P < .01. †P < .05, ††P < .001, †††P < .0001 with respect to Tresp alone cultures (Tresp:Treg ratio of 1:0).
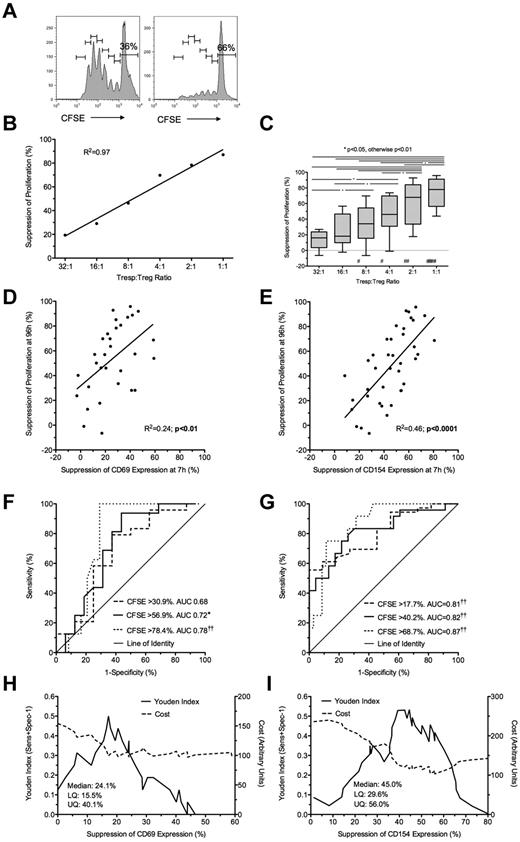
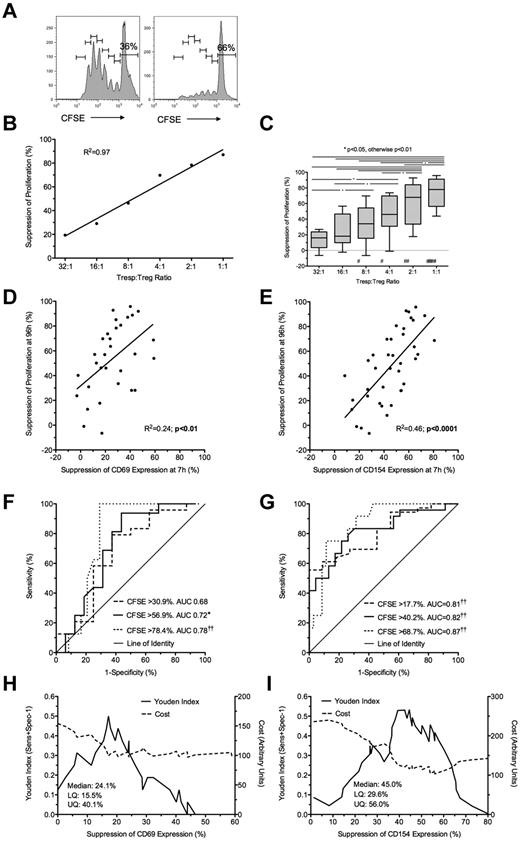
Suppression at 7 hours by ex vivo expanded Tregs predicts suppression of proliferation at 96 hours. (A) Representative example of a CFSE dilution assay showing Tregs cultured alone (left) or in coculture with Tregs at 1:1 Tresp:Treg ratio (right). (B-C) Suppression of proliferation at 96 hours at increasing Tresp:Treg ratios, showing a representative experiment (B) and pooled data from 8 independent experiments (C). (D-E) Comparison of suppression of CD69 (D) and CD154 (E) expression at 7 hours with paired suppression of Tresp proliferation at 96 hours, with regression lines. (F-G) ROC curves illustrating performance of CD69 (F) and CD154 suppression (G) at correctly identifying suppression of Tresp proliferation at 96 hours, for 3 critical values of the CFSE dilution assay. (H-I) Graphs illustrating the performance of CD69 (H) and CD154 suppression (I) at correctly identifying median suppression of proliferation. Median and distribution statistics for each marker are also given. The left and right y-axes illustrate the Youden index for threshold values and arbitrary cost of threshold values, penalizing for false positives, respectively. (C-I) Pooled data from 8 independent experiments from Tresp:Treg ratios 8:1 to 1:1 for CD69 and 16:1 to 1:1 for CD154. *P < .05, ††P < .0001. #P < .05, ##P < .01, ###P < .0001 with respect to Tresp alone cultures (Tresp:Treg ratio of 1:0).
Suppression at 7 hours by ex vivo expanded Tregs predicts suppression of proliferation at 96 hours. (A) Representative example of a CFSE dilution assay showing Tregs cultured alone (left) or in coculture with Tregs at 1:1 Tresp:Treg ratio (right). (B-C) Suppression of proliferation at 96 hours at increasing Tresp:Treg ratios, showing a representative experiment (B) and pooled data from 8 independent experiments (C). (D-E) Comparison of suppression of CD69 (D) and CD154 (E) expression at 7 hours with paired suppression of Tresp proliferation at 96 hours, with regression lines. (F-G) ROC curves illustrating performance of CD69 (F) and CD154 suppression (G) at correctly identifying suppression of Tresp proliferation at 96 hours, for 3 critical values of the CFSE dilution assay. (H-I) Graphs illustrating the performance of CD69 (H) and CD154 suppression (I) at correctly identifying median suppression of proliferation. Median and distribution statistics for each marker are also given. The left and right y-axes illustrate the Youden index for threshold values and arbitrary cost of threshold values, penalizing for false positives, respectively. (C-I) Pooled data from 8 independent experiments from Tresp:Treg ratios 8:1 to 1:1 for CD69 and 16:1 to 1:1 for CD154. *P < .05, ††P < .0001. #P < .05, ##P < .01, ###P < .0001 with respect to Tresp alone cultures (Tresp:Treg ratio of 1:0).
Coculture with GMP-Tregs at a 1:1 ratio resulted in median suppressions of 41% and 65% for CD69 and CD154 expression, respectively (P < .01 compared with Tresps alone for both comparisons; Figure 3A-C). As before, percentage suppression correlated with the Tresp:Treg ratio, although suppression of CD69 was not seen at Tresp:Treg dilutions less than 8:1 (Figure 3D), in contrast to suppression of CD154, which was observed down to a dilution of 16:1 (Figure 3E). GMP-Tregs potently suppressed Tresp proliferation (median [IQR] suppression of 77.9% [56.3%-91.1%; n = 8] at 1:1 ratio; Figure 4A-C), with significant suppression of proliferation observed at all Tresp:Treg dilutions down to 16:1 (Figure 4B-C), agreeing with our previous experience that ex vivo expanded Tregs are stronger suppressors than freshly isolated Tregs.
Bland-Altman plots suggested that suppression of CD69 expression at 7 hours tended to underestimate regulation of proliferation at 96 hours by (mean ± SD) 17.5% ± 27.2% for CD69 (supplemental Figure 1I). However, better agreement was seen between suppression of CD154 and suppression of proliferation (0.6% ± 21.9%; supplemental Figure 1J). Because inhibition of marker expression was not seen at Tresp:Treg ratios less than 8:1 for CD69 and less than 16:1 for CD154, further comparisons were limited to the 8:1 to 1:1 and 16:1 to 1:1 conditions for these markers, respectively. A statistically significant linear relationship was found between suppression of CD69 expression at 7 hours and proliferation at 96 hours (R2 = 0.24, P < .01; Figure 4D). However, the linear relationship between suppression of CD154 expression and suppression of proliferation was stronger (R2 = 0.46, P < .0001; Figure 4E).
To determine the usefulness of marker suppression at 7 hours as a “diagnostic test” for suppression of proliferation at 96 hours, quartiles of suppression of proliferation (median = 56.9%, IQR = 30.9%-78.4% for CD69 tests; and median = 40.2%, IQR = 17.7%-68.7% for CD154) were used as critical values to generate ROC curves (Figure 4F-G). CD69 showed poor discrimination with an AUC of 0.68 (95% CI, 0.44-0.92; P = not significant) for suppression of proliferation more than or equal to 30.9%, AUC of 0.72 (0.54-0.89; P < .05) for suppression of proliferation more than or equal to 56.9%, and AUC of 0.78 (0.64-0.92; P < .0001) for suppression of proliferation more than or equal to 78.4%. In contrast, CD154 showed good discrimination with AUC for suppression of proliferation more than or equal to 17.7% of 0.81 (0.69-0.93; P < .0001), AUC of 0.82 (0.71-0.93; P < .001) for suppression of proliferation more than or equal to 40.2%, and AUC of 0.87 (0.78-0.96; P < .0001) for suppression of proliferation more than or equal to 68.7%.
The Youden index was also calculated for each critical value of CD69 and CD154 suppression to illustrate the range of each assay maximizing discrimination, which turned out to be approximately 15% to 20% suppression for CD69 and 37% to 57% suppression for CD154 (Figure 4H-I). A threshold value of 54% for suppression of CD154 minimized the arbitrary cost of the assay and effectively excluded false positives. In contrast, suppression of CD69 was poor at excluding false positives, only doing so at a threshold of 43.8%. The characteristics of threshold values of CD69 and CD154 suppression at 7 hours in correctly identifying median suppression of proliferation at 96 hours are shown in Table 2.
Treg-mediated suppression of CD69 and CD154 measured at 7 hours predicts suppressed Tresp cytokine production at 96 hours
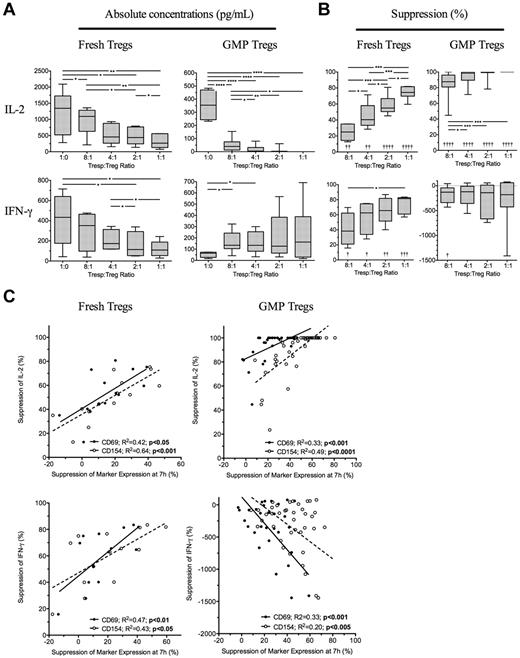
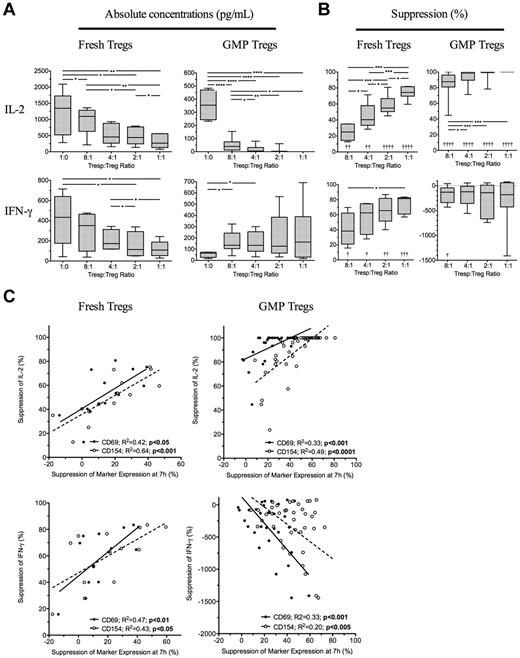
Because suppression of Tresp cytokine production may be as important than suppression of proliferation, we next determined the effectiveness of the 7-hour assay to predict inhibition of cytokine production at 96 hours. Four freshly isolated and ex vivo expanded GMP-Tregs were cultured together with autologous Tresps and 7 hours suppression of CD69 and CD154 compared with supernatant concentrations of IL-2, IFN-γ, IL-10, and IL-17 measured at 96 hours. As expected, freshly isolated Tregs inhibited production of IFN-γ and IL-2 (Figure 5A-B left panels), but not IL-10 nor IL-17 (data not shown). Suppression of both CD69 and CD154 expression on Tresps at 7 hours correlated with regulation of IL-2 (R2 = 0.42, P < .05 and R2 = 0.64, P < .001, respectively) and IFN-γ (R2 = 0.47, P < .01 and R2 = 0.64, P < .05, respectively) by fresh Tregs (Figure 5C left panels). GMP-Tregs potently suppressed IL-2 but increased IFN-γ on activation in vitro (Figure 5A-B); as we have previously shown, GMP-Tregs can produce IFN-γ both in vitro and in vivo (C.S., unpublished observations). Therefore, no suppression of IFN-γ was seen in vitro with GMP-Tregs. With GMP-Tregs, inhibition of CD69 and CD154 at 7 hours both correlated with suppression of IL-2 (R2 = 0.33, P < .001 and R2 = 0.49, P < .0001, respectively). However, an inverse relationship was observed between suppression of CD69 and CD154 on Tresps and IFN-γ concentrations in supernatants of cultures containing GMP-Tregs (R2 = 0.33, P < .001 and R2 = 0.20, P < .005, respectively; Figure 5C right panels), supporting the notion that IFN-γ production is required for effective Treg-mediated suppression of target cells. ROC curves constructed to determine the usefulness of marker suppression at 7 hours as a “diagnostic test” for median values of IL-2 suppression at 96 hours showed excellent discrimination for both fresh Tregs (AUC of 0.92, 95% CI, 0.87-0.97; P < .0001; and AUC of 0.98, 0.85-1.0; P < .0.0001 for CD69 and CD154 suppression, respectively) and ex vivo expanded GMP-Tregs (AUC of 0.79, 95% CI, 0.64-0.95; P < .0001; and AUC of 0.97, 0.84-0.99; P < .0001; for CD69 and CD154 suppression, respectively). ROC curve analysis for usefulness of CD69 and CD154 suppression as a test for median IFN-γ suppression was less useful for fresh Tregs (AUC of 0.74, 95% CI, 0.46-1; P = not significant; and AUC of 0.71, 0.44-0.99; P = not significant; for CD69 and CD154 suppression, respectively) and was not carried out for GMP-Tregs.
Suppression of cytokine production at 96 hours is predicable at 7 hours. (A) Absolute concentrations of IL-2 and IFN-γ in 96-hour supernatants of Tresps cultured alone or together with freshly isolated or GMP-Tregs at various ratios. (B) Suppression of IL-2 and IFN-γ in supernatants by Tregs. (C) Relationship between suppression of CD69 and CD154 expression at 7 hours and inhibition of IL-2 and IFN-γ at 96 hours. (A-C) Cumulative data from 4 independent experiments with each type of Treg showing freshly isolated Tregs (left panels) and GMP-Tregs (right panels). *P < .05, **P < .01, ***P < .001, ****P < .0001. †P < .05, ††P < .01, †††P < .001, and ††††P < .001 with respect to Tresp alone cultures (Tresp:Treg ratio of 1:0).
Suppression of cytokine production at 96 hours is predicable at 7 hours. (A) Absolute concentrations of IL-2 and IFN-γ in 96-hour supernatants of Tresps cultured alone or together with freshly isolated or GMP-Tregs at various ratios. (B) Suppression of IL-2 and IFN-γ in supernatants by Tregs. (C) Relationship between suppression of CD69 and CD154 expression at 7 hours and inhibition of IL-2 and IFN-γ at 96 hours. (A-C) Cumulative data from 4 independent experiments with each type of Treg showing freshly isolated Tregs (left panels) and GMP-Tregs (right panels). *P < .05, **P < .01, ***P < .001, ****P < .0001. †P < .05, ††P < .01, †††P < .001, and ††††P < .001 with respect to Tresp alone cultures (Tresp:Treg ratio of 1:0).
Overall, these data suggest that suppression of IL-2 at 96 hours can be predicted by suppression of CD69 and CD154 at 7 hours for both freshly isolated and GMP-Tregs.
Discussion
Tregs are highly promising agents for the induction of tolerance to transplanted antigens and for the treatment of autoimmune diseases in humans.16 This position is supported not only by murine data demonstrating these predicates in vivo but also by published evidence that human Tregs can be expanded in large numbers in vitro while retaining their suppressive and phenotypic characteristics.16,18 Recent publications, including small-scale clinical trials of Treg cell therapy for the prophylaxis of GVHD19,32 and a case series of Treg therapy for the treatment of acute and chronic human GVHD,17 suggest that large-scale Treg therapy is probably safe and efficacious. Recently, we and others have demonstrated in “humanized” mouse models that in vitro expanded Tregs can prolong survival of human skin transplants33,34 and prevent transplant arteriosclerosis,35 suggesting that clinical Treg cell therapy in solid organ transplantation and autoimmunity is probably a successful strategy for inducing tolerance and minimizing the burden of immunosuppression. The lack of availability, until now, of a simple, rapid diagnostic test to assess Treg function before infusion into humans has been a significant disadvantage in the planning of trials of cell therapy because freshly isolated or in vitro expanded Tregs are 4 to 5 days older by the time results from traditional assays of suppression are available, with no guarantee that their suppressive function and phenotype is the same as it was 5 days earlier.
Here we have independently validated a rapid flow cytometry-based assay for the determination of Treg-mediated suppression and have shown excellent correlation between this assay and contemporaneous gold standard 4-day tests of suppression of proliferation and IL-2 production set up in parallel. Correlation analysis, Bland-Altman plots, and ROC curve analysis all demonstrate that inhibition of CD69 and CD154 expression predicts 4-day suppression of proliferation and cytokine production. Because the translation of quantitated in vitro suppression to qualitative clinical outcomes is unknown, we arbitrarily defined 3 critical values for suppression of proliferation based on statistical criteria (the median, lower and upper quartiles of pooled data from multiple experiments) to assess the performance of the CD69 and CD154 assays. ROC curve analysis based on these criteria showed excellent performance of the 7-hour assay relative to proliferation, although CD69 performed less well as a predictive test for GMP-Tregs compared with their freshly isolated counterparts. Because clinical therapy is probably most deleterious in the face of false-positive tests of suppression, we determined the critical values to effectively exclude false-positive results. For freshly isolated Tregs, the critical values of CD69 and CD154 suppression to minimize false-positive results were 37.4% and 43%, respectively. These values for GMP-Tregs were 43.8% and 54%, respectively. The short assay was highly predictive of gold standard assays of suppression and performed well in comparison.
By providing a standardized checkpoint for quality control (QC) of Treg cellular products and facilitating assessment and infusion of cells on the same working day, the 7-hour assay may dramatically change the management of forthcoming trials of regulatory T cells. The “cut-off” values derived above are deliberately conservative to exclude false-positive results, as “making the cut” at 7 hours will lead to Treg infusion the same day, while failing to “make the cut” will require completion of the 96-hour CFSE dilution assay, before a clinical decision on cell infusion. Because protocols to grow and assess GMP-Tregs may vary from institution to institution, individual centers may have to determine the optimum critical values for their own Treg cellular products. However, these data can be quickly obtained by incorporating the 7-hour assay into QC protocols during in-house development of GMP-Tregs, and such an approach will also strengthen QC and safety data for the registration of subsequent clinical trials.
GMP-grade Tregs expanded ex vivo were clearly stronger suppressors than their freshly isolated counterparts, both in the 7-hour and 4-day assays, and produced significant amounts of IFN-γ. This is an observation we have made both in vitro and in vivo in “humanized” mouse models with respect to ex vivo expanded Tregs (C.S. et al, unpublished observations). Far from compromising Treg function, IFN-γ production by Tregs has been shown to be both necessary for their function36 and for their ability to suppress Th1 responses in vivo.37 Thus, the relationship observed here between higher IFN-γ concentrations in supernatant of GMP-Tregs and greater suppression of CD69 and CD154 on Tresps is particularly interesting. In addition, as we have previously shown,38 human Tregs do not have an impact on IL-17 production in vitro.
In conclusion, the 7-hour assay of CD154 and CD69 suppression on Tresp by Tregs was predictive of suppressive ability at 4 days and performed very well in comparison. We contend that the kinetic advantages of the 7-hour assay ideally places it as the rapid assessment tool of choice for forthcoming programs of cell therapy. As a safety precaution, we propose that a minimum cut-off for suppression at 7 hours for CD69 and CD154, respectively, of 37.4% and 43% in fresh and 43.8% and 54% in GMP-Tregs should be adopted before infusing Tregs into patients to effectively exclude false-positive readouts. These thresholds should be reviewed once more data from pilot studies of Treg therapy in patients become available.
This article contains a data supplement.
The publication costs of this article were defrayed in part by page charge payment. Therefore, and solely to indicate this fact, this article is hereby marked “advertisement” in accordance with 18 USC section 1734.
Acknowledgments
This work was supported by the National Institute for Health Research (J.B.C., B.A., and G.M.L.), Medical Research Council (B.A., M.P.H.-F., and G.L.), the Academy of Medical Sciences/Wellcome Trust (B.A.), the British Heart Foundation and Guy's and St Thomas' Charity (J.B.C., M.P.H.-F., G.M.L., and G.L.), the Department of Health via the National Institute for Health Research comprehensive Biomedical Research Center award to Guy's & St Thomas' National Health Service (NHS) Foundation Trust in partnership with King's College London and King's College Hospital NHS Foundation Trust, and the MRC Center for Transplantation.
Authorship
Contribution: J.B.C. and B.A. designed and executed the experiment, analyzed the data, and wrote the manuscript; C.S., H.F., and F.C.E. designed and executed the experiment and wrote the manuscript; T.T.M. provided intellectual input and wrote the manuscript; M.P.H.-F., G.L., and G.M.L. designed the experiment, interpreted data, and wrote the manuscript; and G.M.L. conceived of the project and initiated the experimental strategy.
Conflict-of-interest disclosure: King's College London and Guy's and St Thomas' NHS Foundation Trust have a strategic partnership with BD Biosciences in the context of the National Institute for Health Research Comprehensive Biomedical Research Centre that seeks to translate advances in scientific discovery for the benefit of patients. The authors declare no competing financial interests.
Correspondence: Graham M. Lord, Medical Research Council Centre for Transplantation, 5th floor, Tower Wing, Guy's Hospital, London SE1 9RT, United Kingdom; e-mail: graham.lord@kcl.ac.uk.
References
Author notes
J.B.C. and B.A. contributed equally to this study and are joint first authors.


