Abstract
Mantle cell lymphoma (MCL), an aggressive subtype of non-Hodgkin lymphoma, is characterized by the hallmark translocation t(11;14)(q13;q32) and the resulting overexpression of cyclin D1 (CCND1). Our current knowledge of this disease encompasses frequent secondary cytogenetic aberrations and the recurrent mutation of a handful of genes, such as TP53, ATM, and CCND1. However, these findings insufficiently explain the biologic underpinnings of MCL. Here, we performed whole transcriptome sequencing on a discovery cohort of 18 primary tissue MCL samples and 2 cell lines. We found recurrent mutations in NOTCH1, a finding that we confirmed in an extension cohort of 108 clinical samples and 8 cell lines. In total, 12% of clinical samples and 20% of cell lines harbored somatic NOTCH1 coding sequence mutations that clustered in the PEST domain and predominantly consisted of truncating mutations or small frame-shifting indels. NOTCH1 mutations were associated with poor overall survival (P = .003). Furthermore, we showed that inhibition of the NOTCH pathway reduced proliferation and induced apoptosis in 2 MCL cell lines. In summary, we have identified recurrent NOTCH1 mutations that provide the preclinical rationale for therapeutic inhibition of the NOTCH pathway in a subset of patients with MCL.
Introduction
Mantle cell lymphoma (MCL) comprises 5% to 7% of all lymphomas.1 The clinical course of this disease is highly variable and ranges from indolent forms with classic morphology to aggressive variants with blastoid or pleomorphic appearance.2 Yet the natural history of MCL is characterized by almost inevitable relapses and increasing resistance to chemotherapy over time. Current treatment strategies include rituximab in combination with standard anthracycline-based or high-dose chemotherapy followed by autologous stem cell transplantation.1 Although the prognosis for newly diagnosed patients has improved over the last decades,3 the median overall survival (OS) time of 4 to 5 years compares unfavorably with the more frequent non-Hodgkin lymphomas, such as follicular lymphoma and diffuse large B-cell lymphoma.
Most negative prognostic markers in MCL are related to proliferation. They include, for example, Ki-67 staining by standard immunohistochemistry4,5 and the proliferation signature based on gene-expression profiling.6 On the other hand, indolent MCL may be identified by a non-nodal presentation and low expression of the transcription factor SOX11.7 Although targeted therapies are emerging in MCL,8 we currently lack reliable markers that identify those patients with aggressive disease who might benefit from novel treatment approaches and, alternatively, patients with indolent disease who might be best initially observed without intervention.
With regard to its pathogenesis, MCL is thought to arise from naive pregerminal center B cells of the inner mantle zone and is characterized on the molecular level by the t(11;14)(q13;q32) and the resulting overexpression of cyclin D1 that deregulates cell- cycle progression.2 Overexpression of cyclin D1 is insufficient, however, to induce lymphomagenesis in murine models9,10 and probably requires secondary genetic alterations, such as chromosomal rearrangements, copy number changes, and gene mutations that presumably disrupt additional critical pathways.2 For example, the CDKN2A locus that encodes INK4A, an inhibitor of CD4K, and ARF, a stabilizer of p53, is lost in 10% to 36% of all cases.2 The TP53 tumor suppressor gene is targeted by copy number losses and by inactivating mutations in 21% to 45% and 7% to 20% of all cases, respectively.2 Together, these findings suggest that most MCLs are genetically unstable, in keeping with frequent deletions or inactivating mutations of the ataxia-telangiectasia mutated (ATM) gene (40%-75% of cases) that is a key effector of the DNA damage response pathway.11–13 Some MCLs also harbor deletions or point mutations in the 3′-untranslated region (UTR) of the cyclin D1a mRNA isoform that result in increased mRNA stability and higher levels of cyclin D1.14 This finding is associated with poor survival and suggests that the expression of cyclin D1 can be targeted by genetic alterations in addition to the t(11;14)(q13;q32).
However, our current knowledge of MCL does not adequately account for the wide spectrum of clinical manifestations, responses to treatment, and prognosis. In this study, we sought to identify novel somatic single nucleotide variants (SNVs) that would enhance our understanding of the biology of MCL and potentially provide novel targets for therapy. To achieve this goal, we applied whole transcriptome shotgun sequencing (RNAseq) to 18 primary tissue samples and 2 cell lines and discovered recurrent somatic mutations in NOTCH1, the majority of which truncate the PEST domain of NOTCH1. The pattern and frequency of NOTCH1 mutations that we observed were strikingly similar to what has recently been described in chronic lymphocytic leukemia (CLL), but different from T-cell acute lymphoblastic leukemia (T-ALL) where NOTCH1 mutations arise in more than 50% of cases and target the heterodimerization and/or the PEST domains of NOTCH1.15 We further showed that inhibition of the NOTCH pathway induces growth arrest and apoptosis in a subset of MCL cell lines. Our approach highlights the power of next-generation sequencing technology to identify deregulated pathways and potential therapeutic targets.
Methods
Materials and patient samples
The discovery cohort consisted of 18 clinical samples (11 diagnostic and 7 progression biopsies) and 2 MCL-derived cell lines (Mino and Jeko-1) that were analyzed by RNAseq. To study the frequencies of observed mutations, we assembled an extension cohort of 103 diagnostic patient samples and 8 additional cell lines (Rec-1, SP-49, Z-138, Maver-1, JVM-2, Granta-519, HBL-2, and UPN-1). The tumor specimens were collected between 1983 and 2011 as part of a research project approved by the University of British Columbia–British Columbia Cancer Agency Research Ethics Board. The cell lines Mino, Jeko-1, Rec-1, Z-138, and Maver-1 were obtained from ATCC through the Mantle Cell Lymphoma Consortium of the Lymphoma Research Foundation. The cell lines SP-49, Granta-519, UPN-1, and HBL-2 were kindly provided by Dr Samir Parekh (Albert Einstein College of Medicine, NY).
In total, constitutional DNA was available for 6 cases of the discovery cohort and for 3 cases of the extension cohort. DNA was extracted from peripheral blood of 4 patients who had a normal blood smear and no bone marrow involvement as assessed by a trephine biopsy. For 5 patients not meeting these criteria, we flow-sorted lymphoma cell suspensions and extracted DNA from the CD3+ population using the Gentra Puregene Tissue Kit (QIAGEN), followed by whole-genome amplification using the GenomPlex Complete Whole Genome Amplification Kit (Sigma-Aldrich).
Whole transcriptome paired-end sequencing (RNAseq) and Sanger sequencing
RNA was extracted from fresh frozen tissue or cell suspensions using the Allprep DNA/RNA Mini Kit (QIAGEN). Whole transcriptome shotgun sequencing was performed as previously described.16 Briefly, polyadenylated RNA was selected after DNAseI treatment and used as a template for double-stranded cDNA synthesis. The 200- to 300-bp fraction was then isolated, amplified, and libraries were constructed using the Illumina Genome Analyzer paired end library protocol (Illumina). Sequencing was performed on an Illumina GAii using one lane of a flow cell per sample and generating 50-bp long reads.
Short sequence reads were aligned to the human reference genome (hg18) file that had been augmented with a set of all exon-exon junction sequences using the the Burrows-Wheeler Aligner Version 0.5.4.17 We used an in-house version of Burrows-Wheeler Aligner that is modified to allow spliced alignments. Candidate SNVs were identified using SNVMix2,18 a probabilistic binomial mixture model that takes into account base and mapping qualities of aligned reads. SNV predictions were discarded if they had an SNVMix2 probability of less than 0.7 or were assessed to be polymorphisms (SNPs). For SNP filtering, we used dbSNP and the 1000 genomes SNPs19 as well as positions that were found as variable in 9 RNAseq control libraries (from centroblasts of benign tonsils). Candidate mutations were subsequently reviewed visually in the integrative genomics viewer (IGV).20
To validate SNVs by an orthogonal platform, we performed targeted sequencing of CCND1 and NOTCH1 using standard dye-terminator sequencing. For that purpose, we amplified regions of interest with M13-tagged primers (supplemental Table 1, available on the Blood Web site; see the Supplemental Materials link at the top of the online article) and sequenced amplicons with M13 forward and/or reverse primers on an Applied Biosystems 3130xl Genetic Analyzer (Applied Biosystems).
Western blotting
Protein lysates were obtained by lysis of 5 to 15 million pelleted cells using the M-PER Reagent (Thermo Electron) while adding proteinase inhibitor. Protein concentration was determined using the Micro BCA Protein Assay Kit (Thermo Electron). A total of 45 μg of protein was loaded per lane on a NuPage 4% to 12% Bis-Tris Gel (Invitrogen) and transferred to a nitrocellulose membrane that was blocked for 1 hour in 5% milk. The membrane was probed with a polyclonal rabbit antibody against C-terminal NOTCH1 in a 1:2000 dilution (sc-6014-R; Santa Cruz Biotechnology), a polyclonal rabbit antibody against the Val1744 residue of active intracellular NOTCH1 in a 1:800 dilution (Cell Signaling Technology), and a monoclonal mouse antibody against β-actin in a 1:10 000 dilution (Sigma-Aldrich).
Cell culture and drug treatment
The cell lines Rec-1, SP-49, Maver-1, JVM-2, Granta-519, HBL-2, and UPN-1 were grown in RPMI medium 1640 (Invitrogen) supplemented with 10% FBS (Invitrogen); Mino in RPMI with 15% FBS; Jeko-1 in RMPI with 20% FBS, 1% penicillin/streptomycin, and 1% nonessential amino acids; and Z-138 in Iscove Modified Dulbecco Medium (Invitrogen) with 10% FBS.
For γ-secretase inhibition, cells were plated out at a concentration of 50 000 to 75 000 cells/mL and incubated for 5 to 7 days with a final concentration of either 1μM of compound E (γ-secretase inhibitor XXI; Calbiochem) in 0.1% dimethyl sulfoxide (DMSO) or 10μM of DAPT (γ-secretase inhibitor IX; Calbiochem) in 0.04% DMSO. In the control wells, cells were incubated with 0.1% and 0.04% DMSO, respectively. Medium and γ-secretase inhibitor or mock were added every other day.
Proliferation and apoptosis assays
Cell proliferation was assessed with a 5-ethynyl-2′-deoxyuridine (EdU) or a 5-bromo-2′-deoxyuridine (BrdU) incorporation assay. For the former, cells were incubated for 2 hours with 10μM EdU, fixed overnight in 2% paraformaldehyde, and permeabilized with the Click-iT saponin-based permeabilization and wash reagent (Click-iT; Invitrogen). Cells were then incubated for 30 minutes with the Click-iT reaction cocktail containing AlexaFluor-488 azide, washed, incubated for another 30 minutes with FxCycle Far Red Stain (Invitrogen), and run on a BD FACSCalibur (BD Biosciences). For cell proliferation analysis after lentiviral transduction, we used a BrdU incorporation assay (BrdU Flow Kit, BD Biosciences). Briefly, cells were labeled for 2 hours with 10μM BrdU, fixed and permeabilized, DNase treated, incubated for 30 minutes with an AlexaFluor-647 anti-BrdU antibody (Invitrogen), washed, and stained with 7-amino-actinomycin D. Samples were similarly run on a BD FACSCalibur (BD Biosciences)
For the detection of apoptosis, cells were harvested from duplicate cultures at day 6, washed, resuspended in binding buffer, and stained with annexin V–FITC or annexin V–allophycocyanin (BD Biosciences) and propidium iodide (PI; Sigma-Aldrich). Samples were analyzed within an hour on a BD FACSCalibur (BD Biosciences).
Lentiviral transduction
Dominant negative Mastermind-like 1 (DN-MAML1) was expressed in Rec-1 and SP-49 cells by transduction with a lentiviral vector (pCCL-MNDU3-DnMAMGFP) expressing DN-MAML1 as a fusion protein with green fluorescent protein (GFP). For the control groups, we used a vector expressing GFP alone (pCCL-MNDU3-GFP). Replication-defective, helper-free lentivirus was produced by transient cotransfection of the pCCL vector along with packaging plasmids (pCMV-dR8.74, pCMV-VSV-G, pRSV-Rev) into 293T/FT cells by calcium phosphate transfection. Supernatant was collected at 48 and 72 hours after transfection and used directly for transduction of Rec-1 and SP-49 cells after 0.45μM filtration and after adding 5 μg/mL polybrene.
Gene-expression profiling
Three cell lines (Mino, Rec-1, and SP-49) were incubated in duplicate cultures with 1μM compound E or 0.1% DMSO (Mock) for 24 hours before RNA extraction. Gene-expression profiles were generated on GeneChip Human Genome U133 Plus Version 2.0 arrays (Affymetrix). Data have been deposited in the National Center for Biotechnology Information Gene Expression Omnibus (accession number GSE34602). Expression data were normalized using the Robust Multi-array Average algorithm. We ranked genes by fold-change of expression levels between treatment groups that was calculated with the “limma” package in R.21 Network analysis was performed using Ingenuity Pathway Analysis (Ingenuity Systems; www.ingenuity.com) and association of our set of differentially expressed genes with known NOTCH targets was done using the “globaltest” package in R.22
Quantitative real-time RT-PCR
For determination of mRNA levels, we used the same RNA samples as for gene-expression profiling. Quantitative RT-PCR was performed using a TaqMan Gene Expression Assay with probes for HES1 (Hs00172878_m1) and MYC (Hs00905030_m1) on a 7900HT Fast Real-Time PCR System (Applied Biosystems). Ct values were normalized against Ct values of ACTB.
Statistical analysis
Group comparisons were done with Student t test, the χ2 test, or Fisher exact test, as appropriate. Time-to-event analyses were carried out in 113 patients with diagnostic biopsies using the Kaplan-Meier method, and curves were compared with the log-rank test in GraphPad Prism Version 5.03. OS was defined as the time elapsing from diagnosis to death because of any cause. Progression-free survival (PFS) was defined as the time from diagnosis to progression (relapse after primary treatment, initiation of new, previously unplanned treatment, or death from any cause). For patients who were initially observed, the initiation of treatment was considered to represent lymphoma progression. Cox regression analysis was used for multivariate analysis with the “survival” package in R.
Results
Confirmation of known mutational targets in MCL
The average total number of reads generated was 22 380 412 per sequencing library, and the average number of mapped reads was 18 305 458 per library. As a preliminary quality check of our results, we looked for genes that are known to be mutated in MCL and found that TP53 and ATM were predicted to be mutated in 5 (25%) and in 3 (15%) of our 20 libraries, respectively (supplemental Table 2), which is in line with published frequencies.11–13,23,24 We could further detect SNVs in the 3′-UTR of CCND1 in a clinical case of blastoid MCL (HS1518) and in the Jeko-1 cell line, similar to what has been reported by Wiestner et al.14 No nonsynonymous SNVs were predicted in TNFAIP3, a negative regulator of the NF-κB pathway that is the target of biallelic inactivation by frequent deletions or rare mutations in MCL.25
CCND1 mutations
The aim of the present study was to identify novel nonsynonymous and recurrent somatic SNVs. The most frequent predictions in our discovery cohort were variants in exon 1 of CCND1. A total of 6 nonsynonymous changes were predicted in 4 of 20 libraries (20%). As they clustered tightly in exon 1, we sequenced this exon and the adjacent 5′-UTR and intron 1 in patients from our extension cohort. We found 20 additional nonsynonymous SNVs in 13 of 70 patients (18.6%). In total, 17 of 90 samples (18.8%) harbored nonsynonymous SNVs in the 5′-UTR or exon 1 of CCND1, and the number of SNVs per case ranged from 1 to 4 (average, 1.6). We could confirm the somatic nature of CCND1 SNVs in 3 cases. Among all nonsynonymous SNVs in CCND1, we observed 9 transversions and 16 transitions. This ratio was suggestive of somatic hypermutation, which generates twice as many transitions than transversions.26 A second argument in support of this hypothesis was the location of CCND1 SNVs at the 5′-end of the gene as aberrant somatic hypermutation preferentially targets a region of 2 kb downstream from the transcription initiation site.27 Thus, these SNVs in CCND1 seemed to have arisen in a similar fashion to the somatic mutations that have been described in the translocated MYC gene in Burkitt lymphoma.28
NOTCH1 mutations
In our RNAseq cohort, 3 cases (2 patients and the Mino cell line) were predicted to harbor a single nucleotide substitution in NOTCH1, a finding that was confirmed by Sanger sequencing. Two of these 3 variants inserted a stop codon in the coding sequence of the PEST domain. The remaining variant substituted a serine for a glycine residue in exon 20 and was predicted to be probably damaging according to the PolyPhen-2 algorithm.29 We decided to perform targeted Sanger sequencing of the coding sequences of the heterodimerization domain (exons 26 and 27) and the PEST domain (part of exon 34) as these regions constitute the hotspots for NOTCH1 mutations in T-ALL.15 This approach revealed an additional dinucleotide deletion in the PEST domain sequence of case HS1523 in our discovery cohort. In the extension cohort, NOTCH1 alterations were found in 9 of 103 diagnostic samples and in the Rec-1 cell line.
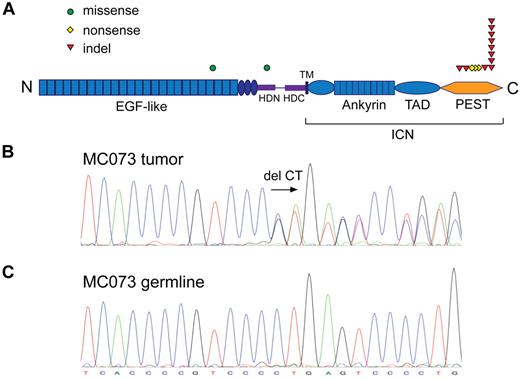
Combining the frequencies of NOTCH1 mutations in the discovery and the extension cohorts, 14 of 121 patient samples (12%) and 2 of 10 cell lines (20%) harbored nonsynonymous NOTCH1 coding-sequence SNVs (Table 1). Twelve of 14 of these mutations (86%) lay in exon 34, which encodes the PEST domain of NOTCH1 and consisted of either small frameshift-causing indels (12 cases) or nonsense mutations (2 cases; Figure 1A). Thus, the majority of NOTCH1 mutations were predicted to cause truncations of the C-terminal PEST domain. Intriguingly, a dinucleotide deletion at position chromosome 9:138510470-71 (P2514Rfs*4) served as hotspot for NOTCH1 alterations as 8 of a total of 16 mutations occurred at this location (Figure 1B). We could confirm its somatic nature by sequencing germline DNA for 2 cases (HS1523 and MC073; Figure 1C). This deletion is also the most common NOTCH1 alteration in CLL30,31 and the most recurrent NOTCH1 PEST domain mutation in T-ALL.15 In contrast to T-ALL, but similarly to CLL, heterodimerization domain mutations are infrequent in MCL as only 1 case had an exon 26 mutation in our cohort (case MC039).
NOTCH1 is recurrently mutated in MCL. (A) NOTCH1 nonsynonymous single nucleotide substitutions and indels. ICN indicates intracellular NOTCH1; TAD, transactivation domain; HD-N and HD-C, N-terminal and C-terminal halves of the heterodimerization domain; and TM, transmembrane domain. (B) Chromatogram of a heterozygous CT coding sequence deletion at position chromosome 9:138510470-71. (C) Matching germline DNA sequence.
NOTCH1 is recurrently mutated in MCL. (A) NOTCH1 nonsynonymous single nucleotide substitutions and indels. ICN indicates intracellular NOTCH1; TAD, transactivation domain; HD-N and HD-C, N-terminal and C-terminal halves of the heterodimerization domain; and TM, transmembrane domain. (B) Chromatogram of a heterozygous CT coding sequence deletion at position chromosome 9:138510470-71. (C) Matching germline DNA sequence.
Patient characteristics and outcome correlation
We next sought to determine whether NOTCH1 mutations are associated with specific clinical or disease characteristics. As illustrated in Table 2, NOTCH1-mutated and NOTCH1 wild-type cases were similar with regard to age at diagnosis, sex, histology, stage, International Prognostic Index (IPI), and treatment. In our complete cohort of 123 cases, 10 biopsies were taken at the time of progression of MCL but were not found to be enriched for NOTCH1 mutations (1 of 10; 10%). This is in contrast to CLL where NOTCH1 mutations were described to be associated with chemorefractory disease or Richter transformation.30
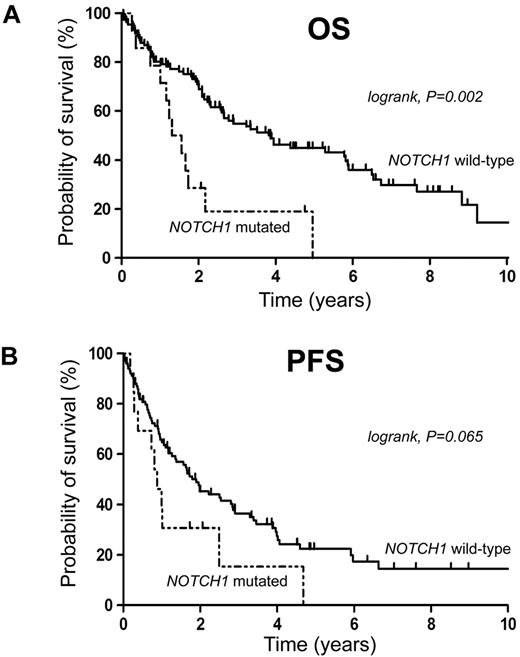
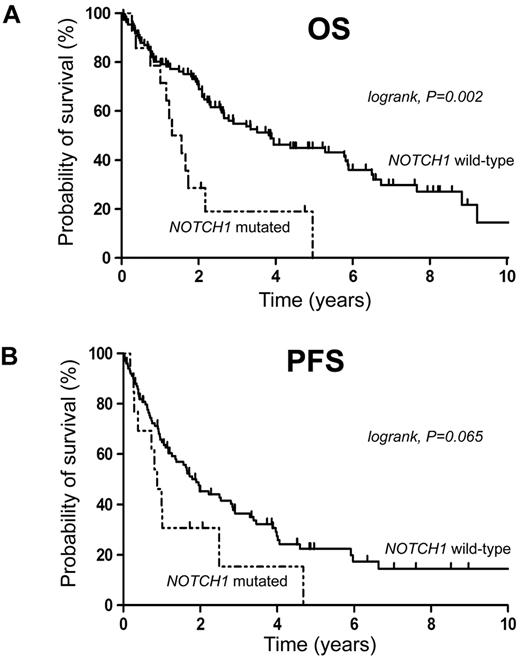
The median follow-up of living patients was 47 months. Survival analysis in our cohort showed that NOTCH1 mutations were associated with poor OS (median OS, 1.43 years in NOTCH1-mutated cases vs 3.86 years in NOTCH1 wild-type patients, P = .002), but not with significantly shortened PFS in the univariate analysis (median PFS, 0.88 years in NOTCH1-mutated cases vs 1.90 years in NOTCH1 wild-type patients, P = .065; Figure 2). 5′-CCND1 mutations were not associated with outcome (supplemental Figure 1). In a multivariate Cox regression model, including NOTCH1 mutational status, IPI, and histology, NOTCH1 mutations maintained a significant impact on survival (Table 3). The hazard ratio of dying when a NOTCH1 mutation was present was 2.82 (95% CI, 1.43-5.57, P = .003). Thus, NOTCH1 mutations were found to be an independent negative prognostic biomarker in our patient series. However, a final conclusion with regard to outcome can only be suggested because of the retrospective nature of the present study and heterogeneity of treatments given.
NOTCH1 mutations are associated with adverse outcome. Kaplan-Meier curves for estimates of (A) overall survival and (B) PFS.
NOTCH1 mutations are associated with adverse outcome. Kaplan-Meier curves for estimates of (A) overall survival and (B) PFS.
NOTCH inhibition decreases proliferation and increases apoptosis in the Rec-1 and SP-49 cell lines
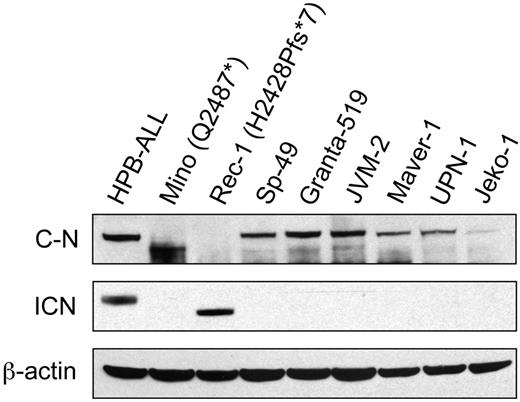
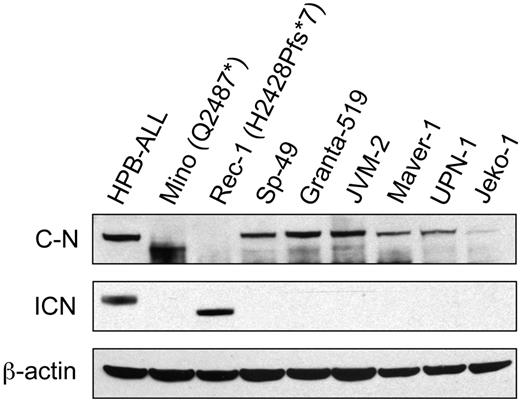
We confirmed expression of NOTCH1 in all MCL cell lines that were tested by Western blotting and were able to confirm the predicted truncations of NOTCH1 in the lysates from Mino and Rec-1 (Figure 3). The Val1744 antibody detected active intracellular NOTCH1 expression in the Rec-1 cell line and in the HPB-ALL control, but not in the Mino nor in the SP-49 cell lines.
Western blot of protein lysates from 8 MCL cell lines. The same blot has been probed with an antibody against an epitope lying between residues 2410 and 2460 of C-terminal NOTCH1 (sc-6014-R; top panel), an antibody against the Val1744 residue of active intracellular NOTCH1 (middle panel), and an antibody against β-actin (bottom panel). We used the T-ALL cell line HPB-ALL as a positive control. C-N indicates C-terminal NOTCH1; and ICN, intracellular NOTCH1.
Western blot of protein lysates from 8 MCL cell lines. The same blot has been probed with an antibody against an epitope lying between residues 2410 and 2460 of C-terminal NOTCH1 (sc-6014-R; top panel), an antibody against the Val1744 residue of active intracellular NOTCH1 (middle panel), and an antibody against β-actin (bottom panel). We used the T-ALL cell line HPB-ALL as a positive control. C-N indicates C-terminal NOTCH1; and ICN, intracellular NOTCH1.
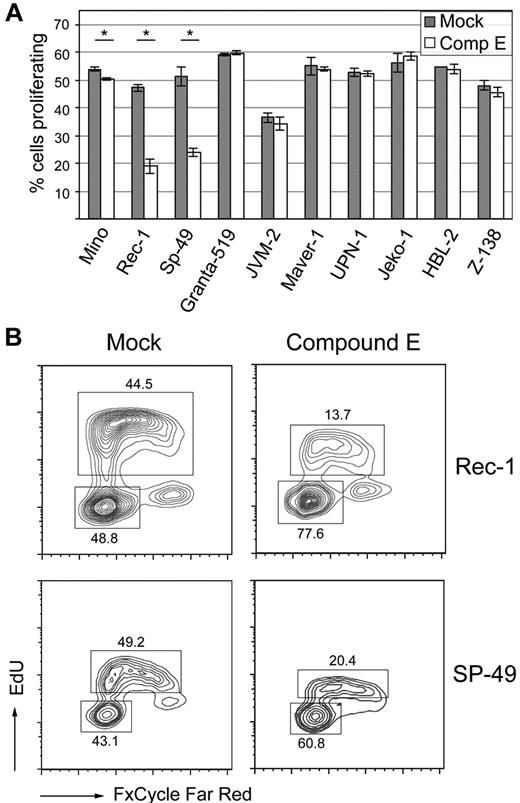
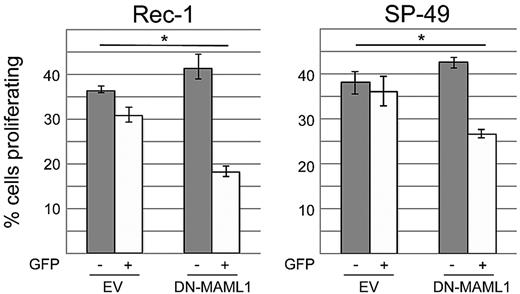
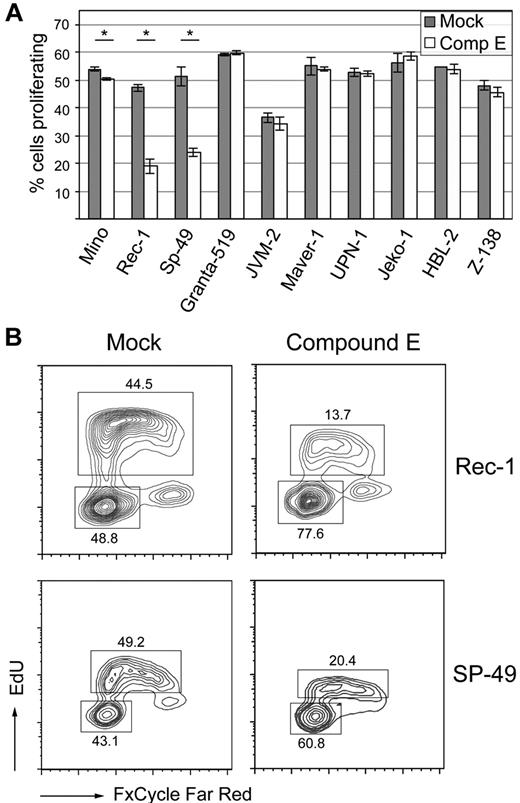
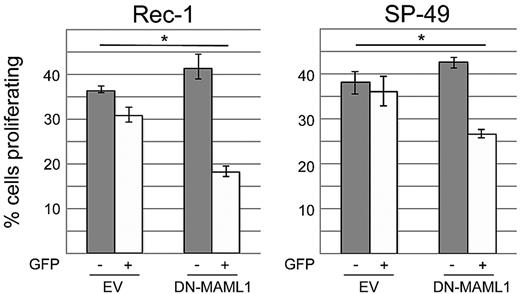
We then sought to test whether or not the NOTCH pathway provides indispensable signals for survival in MCL cell lines. Activation of NOTCH receptors occurs after ligand stimulation and successive cleavages by ADAM metalloproteases and the γ-secretase complex, which are necessary steps for the release of intracellular active NOTCH.32 We first inhibited the NOTCH pathway by incubating our cell lines with 1μM of compound E, an inhibitor of γ-secretase (Figure 4A). Among the 2 cell lines that harbored NOTCH1 mutations, a striking effect on proliferation was observed in Rec-1 (mean percentage of EdU-incorporating cells decreasing from 47.2% to 18.9%, P < .001), whereas Mino showed only a minimal decrease in proliferation (from 53.9% to 50.4%, P = .002). The SP-49 cell line responded to compound E (mean percentage of proliferating cells decreasing from 51.1% to 24.0%, P < .001), although our sequencing approach had not revealed a NOTCH1 mutation. We confirmed the sensitivity of SP-49 cells to NOTCH inhibition by incubation with the less potent γ-secretase inhibitor DAPT (mean percentage of proliferating cells decreasing from 54.3% to 50.4%, P = .016; supplemental Figure 2). All other cell lines did not respond to γ-secretase inhibition. Cell-cycle analysis showed that compound E induced a G0/G1 arrest in Rec-1 and SP-49 cells (Figure 4B). We then transduced these 2 cell lines with a dominant negative, N-terminal truncated form of Mastermind-like 1 (DN-MAML1), which binds to NOTCH1/CSL but is deficient in coactivation, resulting in inhibition of the transcriptional activity of NOTCH.15 Using a BrdU incorporation assay, we observed a decrease of the fraction of proliferating cells in GFP+ versus GFP− cells that was significantly higher than in the cultures transduced with empty vector (Figure 5). This result confirmed that Rec-1 and SP-49 cells rely on NOTCH signaling and that the effect of γ-secretase inhibition is NOTCH-specific.
γ-secretase inhibition for 5 to 7 days with compound E reduces proliferation in the Mino, Rec-1, and SP-49 cell lines. (A) Cells were incubated in triplicate with 1μM of compound E or mock, and proliferation was assessed by flow cytometry after EdU incorporation and staining with AlexaFluor-488 azide. *Statistical significance at the .05 level (2-sided t test). Error bars represent SD. (B) Cell-cycle analysis of the Rec-1 and SP-49 cell lines after γ-secretase inhibition. In addition to detection of EdU incorporation with AlexaFluor-488 azide, cells were stained with FxCycle Far Red. Labels indicate mean percentages of cells in given populations.
γ-secretase inhibition for 5 to 7 days with compound E reduces proliferation in the Mino, Rec-1, and SP-49 cell lines. (A) Cells were incubated in triplicate with 1μM of compound E or mock, and proliferation was assessed by flow cytometry after EdU incorporation and staining with AlexaFluor-488 azide. *Statistical significance at the .05 level (2-sided t test). Error bars represent SD. (B) Cell-cycle analysis of the Rec-1 and SP-49 cell lines after γ-secretase inhibition. In addition to detection of EdU incorporation with AlexaFluor-488 azide, cells were stained with FxCycle Far Red. Labels indicate mean percentages of cells in given populations.
Inhibition of the NOTCH pathway with dominant negative Mastermind-like 1 decreases proliferation in Rec-1 and SP-49. Cells were transduced in triplicate with a construct expressing dominant negative Mastermind-like 1 (DN-MAML1), which inhibits the transcriptional activity of NOTCH. Proliferation was assessed by incorporation of BrdU that was detected by flow cytometry with an AlexaFluor-647 antibody. To determine the effect of NOTCH inhibition, we compared the difference of proliferation in GFP+ and GFP− cells in the DN-MAML1 versus the empty vector (EV) group. *Statistical significance at the .05 level (2-sided t test). Error bars represent SD.
Inhibition of the NOTCH pathway with dominant negative Mastermind-like 1 decreases proliferation in Rec-1 and SP-49. Cells were transduced in triplicate with a construct expressing dominant negative Mastermind-like 1 (DN-MAML1), which inhibits the transcriptional activity of NOTCH. Proliferation was assessed by incorporation of BrdU that was detected by flow cytometry with an AlexaFluor-647 antibody. To determine the effect of NOTCH inhibition, we compared the difference of proliferation in GFP+ and GFP− cells in the DN-MAML1 versus the empty vector (EV) group. *Statistical significance at the .05 level (2-sided t test). Error bars represent SD.
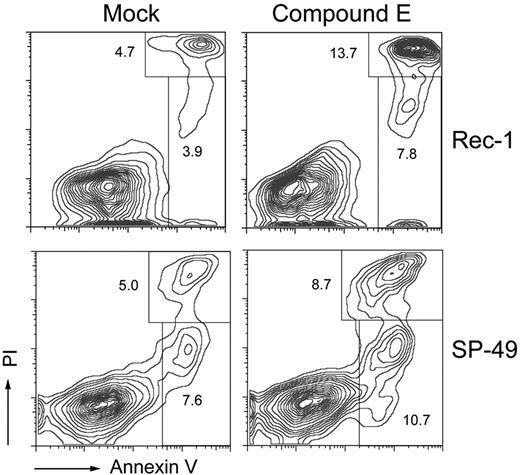
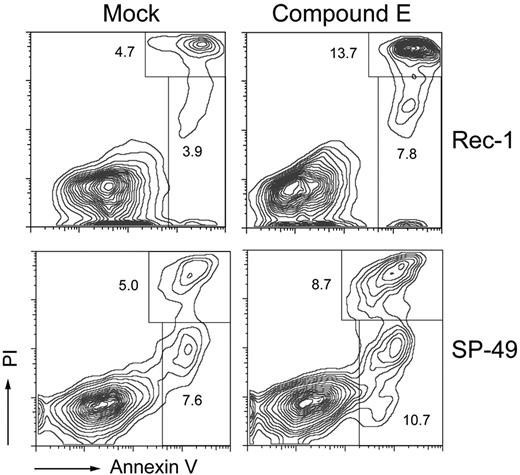
Further, we tested whether cell-cycle arrest in Rec-1 and SP-49 was accompanied by apoptosis. After 6 days of γ-secretase inhibition, the percentage of annexin V–positive and PI-negative cells increased from 3.9% to 7.8% in Rec-1 (P = .011) and from 7.6% to 10.7% in SP-49 (P = .006), demonstrating an increase in the early apoptotic fraction. Similarly, the percentage of annexin V–positive and PI-positive cells increased from 4.7% to 13.7% in Rec-1 (P = .001) and from 5.0% to 8.7% in SP-49 (P = .005), showing an increase in the late apoptotic or necrotic fraction (Figure 6).
γ-Secretase inhibition induces apoptosis in Rec-1 and SP-49. Cells were incubated for 6 days in duplicate with 1μM of compound E. Apoptosis was assessed by flow cytometry after staining with an allophycocyanin- or FITC-labeled antibody against annexin V and PI. Labels indicate mean percentages of cells in given populations.
γ-Secretase inhibition induces apoptosis in Rec-1 and SP-49. Cells were incubated for 6 days in duplicate with 1μM of compound E. Apoptosis was assessed by flow cytometry after staining with an allophycocyanin- or FITC-labeled antibody against annexin V and PI. Labels indicate mean percentages of cells in given populations.
Gene-expression profiling of γ-secretase and mock-treated cells
On activation, intracellular NOTCH shuttles to the nucleus and forms a complex with Mastermind and the DNA-binding protein CSL (CBF1/RBPjκ/Su(H)/Lag-1), leading to transcriptional activation.32 The output of NOTCH pathway activation, however, is highly dependent on species and the precise cellular context, reflecting that NOTCH is implicated in processes as diverse as development, cell fate determination, and oncogenesis.
To assess genes that are transcriptionally regulated by NOTCH signaling in an MCL context, we compared gene-expression profiles of γ-secretase and mock-treated Mino, Rec-1, and SP-49 cells. At a cut-off for differential expression of 1.5-fold change of log2-transformed expression levels, we detected 0, 18, and 107 differentially expressed probe sets in Mino, SP-49, and Rec-1, respectively. The absence of differential gene expression in Mino correlated with the low sensitivity to γ-secretase inhibition. We then grouped gene-expression profiles of γ-secretase–treated Rec-1 and SP-49 cells and compared them with their mock-treated counterparts. Applying the same threshold as used previously, 406 genes showed differential expression (supplemental Tables 3 and 4), of which the majority (348 of 406; 85.7%) were down-regulated on γ-secretase inhibition, illustrating the role of NOTCH as a transcriptional activator. Using Ingenuity Pathway Analysis, the top network was related to gene expression and proliferation, as expected (supplemental Table 5). The list of 406 differentially expressed genes included known NOTCH targets, such as HES1, HEY1, HES4, and MYC. A significant decrease in expression of HES1 in Rec-1 and of MYC in Rec-1 and SP-49 could be confirmed by quantitative RT-PCR (supplemental Figure 3). We used globaltest to compare our results with a published list of genes that are both direct NOTCH targets and down-regulated on γ-secretase inhibition in a T-ALL context33 (supplemental Figure 10). The resulting P value was borderline significant (.06). These results support the notion that the phenotypic change of the Rec-1 and SP-49 cells on γ-secretase inhibition is a specific effect of NOTCH pathway inhibition.
CCND1 has been described as a NOTCH target in various malignancies.34,35 In our experimental model, however, the 2 probe sets for CCND1 did not pass our threshold for differential expression (fold change of 0.679 for 208711_s_at and 0.022 for 208712_at), suggesting that CCND1 is not regulated by NOTCH in MCL. This finding is in keeping with an overriding effect of the translocation t(11;14) on transcriptional regulation of CCND1.
Discussion
Our transcriptome-wide sequencing approach revealed recurrent somatic mutations in NOTCH1 in a subset of patients with MCL (12%). Although not the most frequent alteration in our series, we decided to focus on this finding given the association with poor outcome and previous reports of NOTCH1 mutations in T-ALL and CLL. In our cohort, the majority of NOTCH1 mutations (14 of 16; 88%) resulted in truncation of the NOTCH1 C-terminus, an alteration that has been associated with increased oncogenic activity of NOTCH1 as it removes sites of recognition for the E3 ligase FBW7 that targets NOTCH1 for ubiquitin-mediated proteasomal degradation.36,37 A specific 2-bp deletion in the PEST domain encoding sequence (P2514Rfs*4) accounted for half of all NOTCH1 alterations that we observed. Thus, the frequency and the pattern of NOTCH1 mutations in MCL are strikingly similar to what has recently been reported in CLL, the other major CD5-positive B-cell malignancy.30,31 But, although NOTCH1 mutations have been described as occurring at high frequency in chemorefractory CLL (21% of cases) and in Richter's transformation of CLL (31% of cases), we could not find an association of NOTCH1 mutations affecting progression of MCL; yet this was not systematically studied. The pattern of NOTCH1 mutations in MCL and CLL differs from T-ALL where NOTCH1 mutations occur at a higher frequency (∼ 50%) and target not only the PEST domain but also the heterodimerization domain, accounting for spontaneous activation of the NOTCH1 pathway.15
The NOTCH pathway is highly conserved among metazoans and enables signaling between adjacent cells.32 Although it intervenes in a myriad of physiologic processes, such as cell proliferation, cell death, and differentiation, its deregulation is implicated in developmental disorders and oncogenesis. In solid tumors, NOTCH may display oncogenic or tumor suppressive functions and has also been associated with resistance to therapy.38 In MCL, NOTCH1 has recently been described to be hypomethylated and its expression to be up-regulated.39 Our findings suggest a tumor-promoting role of NOTCH1 mutations, in keeping with T-ALL. Indeed, inhibition of the NOTCH pathway by either compound E or a dominant-negative Mastermind-like 1 construct resulted in reduced proliferation and/or increased apoptosis in 2 of 10 MCL cell lines. NOTCH1 mutations, however, do not seem to be a perfect surrogate marker for sensitivity to NOTCH pathway inhibition as illustrated by the differential results on the Mino, Rec-1, and SP-49 cell lines.
Earlier observations showed that NOTCH1 promotes T-cell differentiation and blocks B-cell lymphopoiesis in a mouse model40 and that NOTCH signaling induces growth arrest in various B cell–derived malignancies, such as B-ALL, Hodgkin lymphoma, and myeloma.41 However, the observation that NOTCH1 mutations are found in B-cell lymphoproliferative diseases, such as MCL and CLL, precludes the simplistic conclusion that NOTCH signaling is detrimental for B-cell survival. It rather supports the notion that the effect of NOTCH1 signaling is dependent on the precise cellular context and results from the complex interactions of tumor cells and their microenvironment. In the Rec-1 and SP-49 cell lines, canonical target genes, such as members of the HES/HEY family, appear to be regulated by NOTCH. MYC is another appealing candidate target that represents, together with NOTCH1, a feed-forward-loop transcriptional network in T-ALL.33 Rare MCLs harbor MYC translocations that are associated with blastoid histology and poor outcome.42,43 Our gene-expression profiles suggest that NOTCH activation may represent an alternative pathway leading to MYC overexpression. On the other hand, the expression of CCND1 mRNA levels was not affected by γ-secretase inhibition in our experiment, although CCND1 has previously been described as a NOTCH1 target.44 In MCL, where expression of CCND1 is driven by the IGH-Eμ enhancer, NOTCH seems to exert its effects independently of CCND1.
In our cohort, NOTCH1 mutations were associated with significantly shortened overall (P = .003) and PFS (P = .030). This observation was independent of other clinical or pathologic factors, such as the IPI or blastoid histology. The finding that NOTCH1 mutations are associated with adverse outcome, however, has to be validated in larger and uniformly treated cohorts. Interestingly, NOTCH1 mutations have been found to be an adverse prognostic marker in CLL30,31 but not in T-ALL where they are associated with improved response to primary treatment and inconsistently with improved survival.45
The sensitivity of the Rec-1 and the SP-49 cell lines to compound E suggests that NOTCH1 mutations could serve as a target for tailored therapy in a subset of MCLs. However, the study of γ-secretase inhibitors that function as pan-NOTCH inhibitors has so far been hampered by low clinical activity and mainly gastrointestinal toxicity.46 Current studies are trying to circumvent these problems using γ-secretase inhibitors intermittently and/or in combination with standard chemotherapy or other novel therapies.47 Alternative strategies to inhibit the NOTCH pathway include antibodies that selectively bind either NOTCH1 or NOTCH248 or direct inhibition of the NOTCH1 transcription factor complex,49 but none are currently available for clinical use.
The most recurrent finding in our study was mutations in the 5′-UTR and the first exon of CCND1 that were present in 17 of 90 samples (18.8%). To the best of our knowledge, these mutations have not been previously described. The predominance of transitions over transversions, their position at the 5′-end of CCND1, and the proximity of the IGH chain locus that stems from the t(11;14) are all supportive of the hypothesis that these mutations arise through somatic hypermutation. Our finding supports previous observations that 15% to 39% of MCLs show evidence of somatic hypermutation of the IGHV gene, suggesting that they have been exposed to the germinal center reaction.50 In our cohort, 5′-CCND1 mutations were not associated with outcome, and we speculate that these mutations are innocent bystanders rather than disease-driving events. This hypothesis, however, needs to be experimentally addressed.
In conclusion, we applied whole transcriptome sequencing to MCL and discovered recurrent somatic mutations in CCND1 and NOTCH1. We were able to show that NOTCH1 mutations identify a poor-risk patient population and that NOTCH1 could in the future serve as a target for tailored therapy. Thus, our study illustrates that next-generation sequencing technology serves as a powerful tool to discover novel genetic alterations in a complex disease, such as MCL.
There is an Inside Blood commentary on this article in this issue.
The online version of this article contains a data supplement.
The publication costs of this article were defrayed in part by page charge payment. Therefore, and solely to indicate this fact, this article is hereby marked “advertisement” in accordance with 18 USC section 1734.
Acknowledgments
The authors thank Canada's Michael Smith Genome Sciences Centre for expert library construction, sequencing, and analytic assistance.
This work was supported by the National Cancer Institute of Canada and Terry Fox Foundation Program Project (019001, J.M.C., M.A.M., and R.D.G.; 018006, A.P.W.). R.K. received a fellowship from the Ligue Genevoise Contre le Cancer et Fondation Dr Henri Dubois-Ferrière Dinu Lipatti. R.D.M. is a Vanier scholar (Canadian Institutes of Health Research).
Authorship
Contribution: R.K., C.S., and R.D.G. designed and performed the research, analyzed and interpreted data, and wrote the paper; B.M. analyzed SNV predictions and performed Sanger sequencing; S.R. and R.D.M. performed the analysis of RNAseq data; M.B., A.T., B.W., J.G., and S.B.-N. performed experiments; K.T. reviewed pathology; S.O. selected cases for RNAseq; C.E.J., C.C., and A.P.W. contributed vital reagents, designed and helped perform functional experiments, and interpreted data; L.H.S. and J.M.C. curated the lymphoma database, participated in the original design of the project, reviewed the manuscript, and provided editorial input; and M.A.M. participated in the original design of the project and oversaw data collection and analysis.
Conflict-of-interest disclosure: The authors declare no competing financial interests.
Correspondence: Randy D. Gascoyne, British Columbia Cancer Agency & British Columbia Cancer Research Centre, 675 W 10th Ave, Vancouver, BC V5Z 1L3, Canada; e-mail: rgascoyn@bccancer.bc.ca.
References
Author notes
A.P.W., C.S., and R.D.G. contributed equally to this study as senior co-authors.


