Abstract
Low linear energy transfer (LET) ionizing radiation (IR) is an important form of therapy for acute leukemias administered externally or as radioimmunotherapy. IR is also a potential source of DNA damage. High LET IR produces structurally different forms of DNA damage and has emerged as potential treatment of metastatic and hematopoietic malignancies. Therefore, understanding mechanisms of resistance is valuable. We created stable myeloid leukemia HL60 cell clones radioresistant to either γ-rays or α-particles to understand possible mechanisms in radioresistance. Cross-resistance to each type of IR was observed, but resistance to clustered, complex α-particle damage was substantially lower than to equivalent doses of γ-rays. The resistant phenotype was driven by changes in: apoptosis; late G2/M checkpoint accumulation that was indicative of increased genomic instability; stronger dependence on homology-directed repair; and more robust repair of DNA double-strand breaks and sublethal-type damage induced by γ-rays, but not by α-particles. The more potent cytotoxicity of α-particles warrants their continued investigation as therapies for leukemia and other cancers.
Introduction
Nearly one-half of all cancer patients will undergo some form of ionizing radiation (IR).1 In acute myeloid leukemia, total body irradiation combined with chemotherapy before stem cell transplantation is an effective treatment for acute myeloid leukemia,2 although residual, radioresistant leukemic cell clones remain and lead to relapse. Therefore, understanding the cellular and biochemical mechanisms of IR resistance is important for devising better therapies and reducing adverse effects in normal tissues exposed to IR during therapy, or inadvertently because of environmental exposures or nuclear devices.
In contrast to the low linear energy transfer (LET) IR used in the treatment of acute myeloid leukemia before stem cell transplantation or as radioimmunotherapy for leukemia or lymphoma, high LET IR, including α-particles, deposit their energy in micron scale distances in vivo. Although the damage that α-particles induce in DNA and nearby biomolecules is chemically similar to that of γ-rays, the relative impact of direct ionizations on biomolecules from α-particles is much greater than that of γ-rays as α-particles typically induce highly clustered DNA damage, leading to complex DNA double-strand breaks (DSBs) and chromosomal aberrations.3-5 These sites of highly clustered damage are thought to explain the increased relative biologic effectiveness of α-particles.6 For example, DNA repair-deficient cell mutants become less radiosensitive compared with their wild-type counterparts when challenged with α-particles versus low LET x-rays.7 The differential ability of cells to cope with high and low LET IR is further underscored by work demonstrating that chemo- and γ-IR–resistance was circumvented with an α-emitting 213Bi-labeled anti-CD45 antibody in leukemia cells.8 Thus, α-particle emitting nuclides are a promising therapy of readily accessible tumors of the hematopoietic system, sparing healthy tissues.9 Multiple clinical trials are currently underway testing the ability of targeted α-particle emitters to kill malignant cells in the hematopoietic compartments. They include 223Ra (Alpharadin), in phase 3 clinical trials for the treatment of bone metastases in prostate and breast cancer,10 213Bi-labeled anti-CD33 antibody and a 4 α-particle generator, 225Ac, also conjugated to anti-CD33 antibody for treatment of myeloid leukemia.11
We sought to address whether α-particle–induced radioresistance is possible in hematopoietic cancer cells and, if so, whether observed mechanisms of high LET radioresistance could be quantitatively and qualitatively similar to low LET radioresistance. Hence, we created stable radioresistant clones derived from myeloid leukemia HL60 cells irradiated with high or low LET IR. Resistant cell clones demonstrated reduced IR-induced apoptosis, desensitization of the late G2/M checkpoint, and improved repair of specific forms of chromosomal DNA damage thought to result from 2 DSB sites not in proximity to one another. Resistance to α-particle emitters was minimal, detected only at low α-particle doses.
Methods
IR selection and cloning of individual cell colonies
HL60 human myelocytic leukemia cells (ATCC) were maintained at 105-106 cells/mL. HL60 cells were irradiated 15 times over the course of approximately 150 days with equitoxic, escalating doses with either a 137Cs source or an 241Am source12 for low and high LET resistant cells, respectively (Table 1). After each dose, when cells reached > 95% viability, cells were immediately re-irradiated. The initial doses were determined from the doses needed to kill 90% of naive HL60 cells (D10) in clonogenic survival assays and increased, as indicated in “IR-induced apoptosis is reduced in all RA and RG clones relative to HL60.” Unirradiated HL60 control cells were kept 150 days as a control.
After the final round of irradiation, individual cell clones from the irradiated progeny and unirradiated HL60 cells were randomly selected after 2 weeks of growth in semisolid methycellulose medium. These colonies were expanded then aliquoted for long-term liquid nitrogen storage. All cells were mycoplasma free at all times.
γ-H2A.X foci quantitation
Cells were fixed in 2% paraformaldehyde (Sigma-Aldrich) for 15 minutes in the dark, blocked with 2% BSA in PBS, then incubated for 1 hour with a monoclonal antibody anti–phospho-H2A.X (clone JBW301; Millipore) at a 1:1000 dilution, then probed with secondary antibody goat anti–mouse IgG conjugated to AlexaFluor-488 in PBS + 2% BSA at 1:1000 dilution for 30 minutes in the dark. After further washing, cells were mounted in ProLong antifade mounting solution (Invitrogen) containing 4,6-diamidino-2-phenylindole and imaged by wide-field microscopy (Mirax). Foci size and threshold were adjusted to fit the images, and all samples were quantified by automated analysis using Volocity with identical exposure times and threshold settings.
Neutral comet assay
Cells were irradiated on ice at 105 cells/mL in PBS with various doses of γ-IR and immediately processed for DSB formation using the comet assay kit (Trevigen) and analyzed using CometScore Version 1.5 (TriTek Corporation) software. The tail moments were reported for at least 100 cells per sample.
Annexin V and propidium iodide apoptotic assay
The annexin V apoptosis kit (BD Biosciences PharMingen) was used to quantitate early cell death. A total of 2 × 10⁴ events were acquired on a C6 Accuri flow cytometer (Accuri Cytometers) for each sample.
Executioner caspase assay
Cell lysates were prepared in nondenaturing conditions, normalized by protein content, and incubated with fluorogenic substrate Ac-DEVD-AMC (Calbiochem) at 37°C for 90-120 minutes and analyzed for fluorescence at 485 excitation/535 emission in a 384-well black plate.
Measurement of cell nuclei and geometry for α-particle exposure
Cells at 5 × 10⁵ cells/mL were fixed in regular medium containing 2% paraformaldehyde for 15 minutes at room temperature, stained with 4,6-diamidino-2-phenylindole, and added to aluminum dishes containing Mylar seals. Cells were settled on a Leica TCS AOBS SP2 inverted microscope (Leica Microsystems) for 20 minutes before z-stacked images were taken in 1-μm increments. Reconstructed images taken parallel to the culture surface were used to make planar projections for cross-sectional measurements of cell nuclear area parallel to the culture surface and thus perpendicular to the path length of α-particle traversal using Volocity Version 5.4.1 software (PerkinElmer Life and Analytical Sciences).
Alpha particle and γ-ray exposure
The design of the 259-MBq 241Am source has been described in detail elsewhere.12 The flux of α-particles per unit area using the CR-39 plastic etching technique was found to be 198 ± 14 particles/mm−2 from a 0.25-second exposure. For a nuclear radius of 5.15 μm (eg, “parental” HL60 cells), this requires an exposure of 16 seconds to achieve an average of 1 nuclear traversal. The mean α-particle energy is estimated to be 2.9 MeV incident to the surface with a full-width half-maximum value of ∼ 0.9 MeV, corresponding to a mean LET of 132 keV/μm.13 For spherical cells, this corresponds to a conservative estimated nuclear dose of 1 Gy for every 4 nuclear α-particle traversals.14 Any differences in dose to specific cell clones were accounted for by adjusting the number of α-particle traversals for a given exposure time according to measured nuclear area (supplemental Figure 4, available on the Blood Web site; see the Supplemental Materials link at the top of the online article). All cell samples were settled on the benchtop irradiator at ambient temperature for 20 minutes before exposure to ensure a uniform cell layer on the mylar cell culture surface.
Cells were exposed to low LET IR by a Shepherd Mark I 137Cs source irradiator (JL Shepherd) at ∼ 2 Gy/min.
Cell cycle analysis
Approximately 106 cells were fixed with 1 mL ice-cold 70% ethanol for > 2 hours at −20°C, then washed and stained with PBS, 20 μg/mL propidium iodide (Invitrogen), 0.1% Triton-X 100, and 100 μg/mL RNAse A (Sigma-Aldrich), and incubated 30 minutes at 37°C in the dark. Cells were collected on a flow cytometer (Accuri Cytometers) and gated for cells containing 2n and 4n DNA content.
Mitotic index assay
At indicated times, cells were fixed and assayed for mitotic index as described.15 Samples were normalized to unirradiated controls (including each time point in time-course studies).
Micronucleus assay
After IR treatment, cells were treated with 10 μg/mL cytocholasin B for 20 hours and assayed for micronucleus formation as described previously.16 At least 250 nuclei were counted for each sample from at least 5 different fields. For micronuclei quantification, at least 50 binucleated cells were counted for each sample and were scored as positive if the size of the micronucleus was between approximately one-tenth and one-third the size of a normal nucleus. Cells containing 4 nuclei were not scored.
Clonogenic survival assay
Cells were adjusted to 10 times plating concentration in 1:10 methylcellulose (StemCell Technologies) containing 40% methylcellulose, 10% FBS, 2mM l-glutamine, and 50% RPMI with a blunt-ended 16-gauge needle (StemCell Technologies) before plating 1.1 mL per 35-mm2 dish in duplicate for each sample. After ∼ 14 days in a 37°C humidified incubator, colonies containing > 50 cells were enumerated blindly.
ATP Lite viability and thymidine proliferation assays
The ATP Lite assay kit was used (PerkinElmer Life and Analytical Sciences) on 104 cells in 100 μL in quadruplicate. Proliferation was performed with [6-3H]-thymidine (PerkinElmer Life and Analytical Sciences), added 12 hours before harvest, as originally described, with a Tomtec harvester (Tomtec).17
Low oxygen clonogenic cell culture
Cells were equilibrated for a minimum of 6 hours in Nunc 25-cm2 vent/close cap tissue culture flasks (Nalgene Nunc International) in an In Vivo2 400 Hypoxic workstation (Ruskinn), containing a gas mixture of 5% CO2, 95% N2 at 37°C and 90% humidity, which achieved a maximum oxygen concentration of 1000 ppm measured in air with the In Vivo2 oxygen probe. Cells were manipulated in the workstation, sealed, and immediately taken to the γ-ray source for irradiation. Cells were maintained under aerobic conditions after IR exposure.
Knockdown of Rad51 using shRNA
MISSION-targeted shRNA constructs were obtained from Sigma-Aldrich for the Rad51 protein using gene accession number NM_002875. The sequence used was 5′-CCGGCGGTCAGAGATCATACAGATTCTCGAGAATCTGTATGATCTCTGACCGTTTTT-3′. shRNA-containing plasmid constructs were packaged with lentiviral plasmids per the manufacturer's protocol in HEK293T (ATCC). Viral soups were titered using the HIV-1 p24 antigen ELISA assay kit (Zeptometrix). Target cells were incubated overnight with virus at a multiplicity of infection of 10, placed in normal medium for another 24 hours, and selected on 5 μg/mL puromycin for 10 days. Cells were assayed for Rad51 knockdown via Western blot using a rabbit polyclonal antibody specific to Rad51 (Novus Biologicals).
Cell cycle synchronization
Cell synchronization was achieved using the double thymidine block technique18 (12 hours “on,” 10 hours “off,” 14 hours “on”). Greater than 80% of cells were accumulated at the G1/S border as assessed by cell cycle flow cytometry in all experiments.
Results
IR-induced apoptosis is reduced in all RA and RG clones relative to HL60
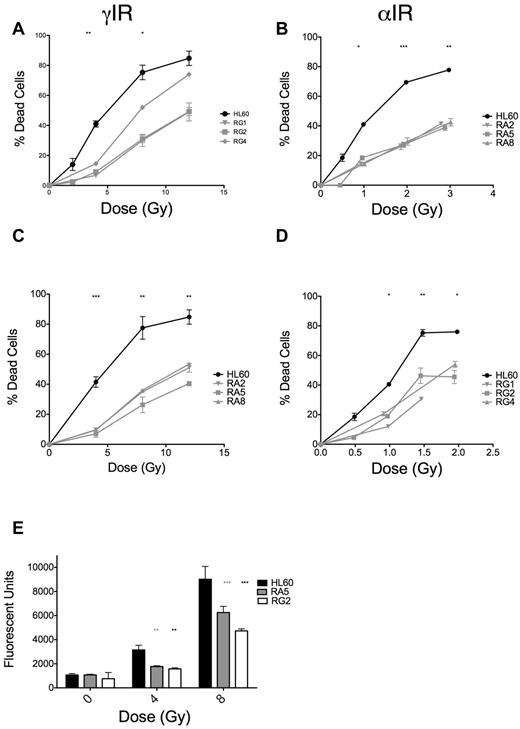
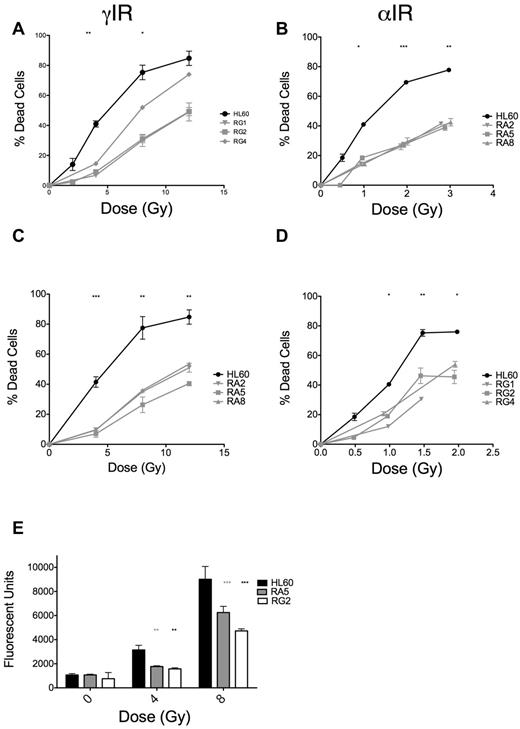
The dose scheme used for selection of radioresistant cell clones is displayed in Table 1. Each increase in dose was equivalent in terms of expected increases in cell death in HL60 cells. We initially screened clones derived after 15 irradiations of either γ-rays (RG) or α-particles (RA) by assaying for apoptosis at 48 hours after IR (where apoptosis is maximal; supplemental Figure 1) and observed substantial reductions in apoptosis in response to IR (supplemental Figure 2A-B). RA clones were more uniformly resistant to IR-induced apoptosis than RG clones (supplemental Figure 2A-B). We validated these initial results with 3 clones from RA and RG cells and found the phenotype to be stable over several days in culture (Figure 1A-B). Notably, RA and RG clones displayed cross-resistance to γ-ray and α-particle exposures, respectively (Figure 1C-D). We performed detailed analyses of specific clones RA5 and RG2, chosen to identify any potential mechanistic differences between the cell clones in response to different chronic radiation treatments. In these resistant clones, reduced apoptosis correlated with lack of executioner caspase activation 24 hours after γ-ray exposure (Figure 1E). The lack of IR-induced apoptosis in these cells was stable over a total culture time of at least 2 months.
RA and RG clones have significantly reduced IR-induced apoptosis compared with HL60 cells after both γ-ray and α-particle exposure. Selected RA and RG cell clones and HL60 cells were irradiated with indicated doses of γ-IR (A,C) or α-IR (B,D), incubated 48 hours under standard cell culture conditions, and then assayed for apoptosis by annexin V and propidium iodide staining. Data are mean ± SEM from at least 3 independent experiments. Two-way, repeated-measures ANOVA with a Dunnett test showed all clones to be statistically different from HL60 at P = .05 level or better. (E) Data from a representative executioner caspase activity assay repeated 3 times at 24 hours after γ-IR. *P < .05, **P < .01, and ***P < .001, least significant of the 3 resistant clones at each dose.
RA and RG clones have significantly reduced IR-induced apoptosis compared with HL60 cells after both γ-ray and α-particle exposure. Selected RA and RG cell clones and HL60 cells were irradiated with indicated doses of γ-IR (A,C) or α-IR (B,D), incubated 48 hours under standard cell culture conditions, and then assayed for apoptosis by annexin V and propidium iodide staining. Data are mean ± SEM from at least 3 independent experiments. Two-way, repeated-measures ANOVA with a Dunnett test showed all clones to be statistically different from HL60 at P = .05 level or better. (E) Data from a representative executioner caspase activity assay repeated 3 times at 24 hours after γ-IR. *P < .05, **P < .01, and ***P < .001, least significant of the 3 resistant clones at each dose.
To ensure that the RA and RG clones' resistance to IR-induced apoptosis was not the result of variability in parental HL60 cells, we also analyzed the apoptotic response to a single dose of 4 Gy of γ-rays in 15 naive HL60 clones and found 1 with significantly reduced apoptosis (supplemental Figure 2). However, clonogenic survival assays on the naive HL60 clones revealed that no radiation-naive clone had significantly reduced mitotic death (supplemental Figure 3A-B). Collectively, the IR-induced apoptotic response of RA and RG progeny were significantly different from those derived from naive HL60 clones, indicating that repeated exposure to radiation created radioresistant clones that were not resistant because of random variability (supplemental Figure 2D).
Clonogenic survival data show that clones are resistant to low LET IR at all doses tested, but resistant only to low doses of high LET α-particles
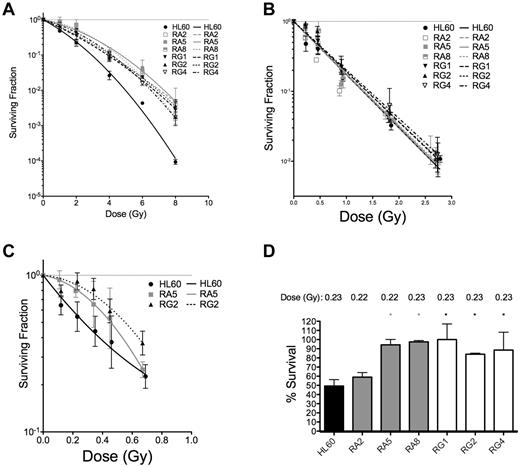
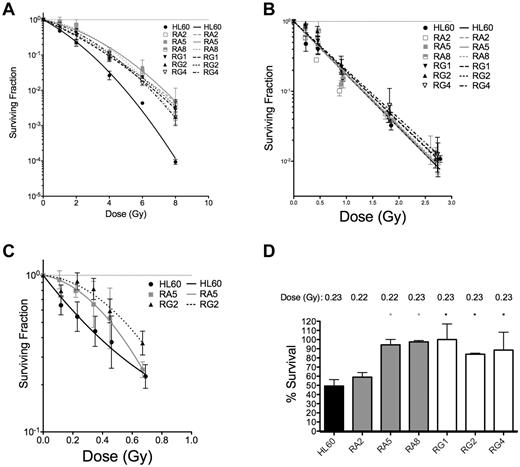
To confirm that these apoptotic results were indicative of improved survival at the single-cell level, 3 representative sublines from RA and RG cells were subjected to both types of IR and analyzed for their capacity for single cells to form colonies. Resistant cell clones had increased survival after low LET γ-rays compared with HL60 at all doses tested (Figure 2A and Table 2).
Clonogenic survival is increased for various RA and RG clones after IR exposure. Log-linear clonogenic survival curves for cells treated with γ-rays (A) or α-particles (B). (C) The low α-particle dose-response is displayed for RA5 and RG2. (D) Normalized survival to a single dose of ∼ 0.23 Gy α-particles is shown for select clones. *P < .05, relative to HL60. Data are mean ± SEM of at least 3 independent experiments
Clonogenic survival is increased for various RA and RG clones after IR exposure. Log-linear clonogenic survival curves for cells treated with γ-rays (A) or α-particles (B). (C) The low α-particle dose-response is displayed for RA5 and RG2. (D) Normalized survival to a single dose of ∼ 0.23 Gy α-particles is shown for select clones. *P < .05, relative to HL60. Data are mean ± SEM of at least 3 independent experiments
In contrast to low LET IR, clonogenic survival after α-particle exposure was qualitatively different for the resistant cells. Only at very low doses of α-particles were differences between resistant clones and HL60 cells observed (Figure 2B,D). In the low-dose portion of the α-particle curve, the induction of a small shoulder was observed of ∼ 1 or 2 additional α-particle traversals in the RA5 and RG2 clones (Figure 2C). Resistance to a low dose of ∼ 0.23 Gy of α-particles was confirmed in 5 of 6 clones (Figure 2D). Following Poisson statistics, these data imply radioresistance to high LET α-particles in most RA and RG clones can only be achieved following doses that result in most cells receiving either 0 (41%), 1 (36.5%), or 2 (16%) nuclear α-particle traversals. Thus, resistant cells show differences to HL60 cells after individual cell doses of less than ∼ 0.5 Gy. Because of the α-particle probability distribution, at higher doses, the assay is no longer capable of resolving differences between sensitive and resistant cells. These results were not because of differences in cell morphology and associated α-particle dosimetry between cell sublines because mean nuclear areas were similar, as demonstrated by confocal microscopy (supplemental Figure 4).
Apoptosis is reduced in RA5 and RG2 cells with internal high LET IR-emitters of the radioimmunotherapy construct 225Ac–anti-CD33 (lintuzumab) and 125I-dUdr
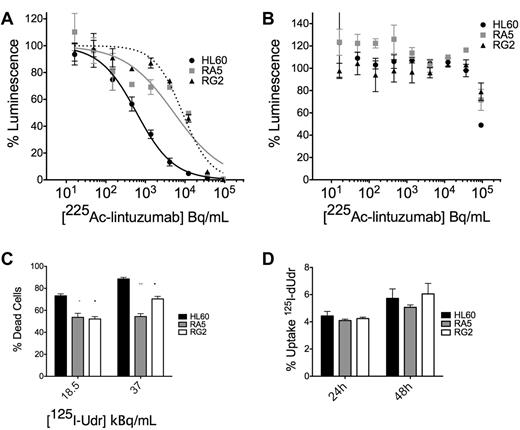
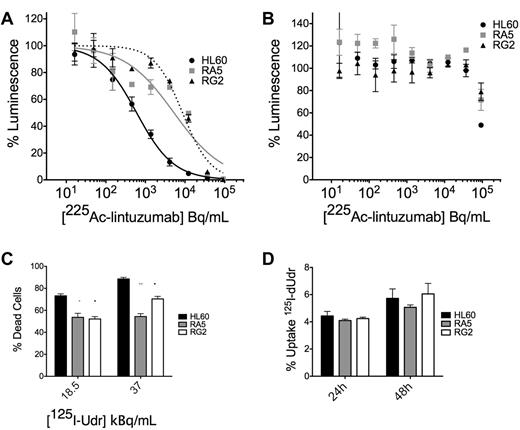
We wanted to confirm our studies of survival with the external application of α-particle flux with the clinically relevant construct 225Ac-labeled lintuzumab, which targets α-particles to CD33+ cells. We treated cells in culture with a dose escalation of 225Ac-conjugated to lintuzumab (HuM195). There was an approximately 1-log shift in survival in the ATP Lite viability assay of RA5 and RG2 cells compared with HL60 at 48 hours after treatment (Figure 3A; supplemental Figure 5). A 100-fold excess unlabeled antibody blocked the effect (Figure 3B), demonstrating its specificity.
RA5 and RG2 have reduced apoptosis to high LET-emitting constructs 225Ac-lintuzumab and 125I-dUdr. Cells were treated in log-phase growth with indicated concentrations of radioimmunotherapy construct for 48 hours in a 96-well plate and then assayed by the ATP Lite viability assay. (A) Treatment with 225Ac-lintuzumab. (B) Treatment in the presence of 100-fold excess unlabeled antibody. Data are mean ± SD of a representative experiment repeated 3 times. The curves were fitted using sigmoidal dose-response nonlinear regression with variable slope. The corresponding IC50 values for HL60, RA5, and RG2 were 0.59, 5.25, and 8.7 kBq/mL, respectively. (C) Cells were treated with indicated doses of 125I-Udr, and cell viability was measured by scoring of nuclear morphology, normalized to controls. (D) Percent uptake of 125I-Udr at 24 and 48 hours after treatment. 125I-Udr experiments are mean ± SEM from 2 independent experiments. A 2-way, repeated-measures ANOVA was performed to determine significance at each dose. *P < .05. **P < .01. ***P < .001.
RA5 and RG2 have reduced apoptosis to high LET-emitting constructs 225Ac-lintuzumab and 125I-dUdr. Cells were treated in log-phase growth with indicated concentrations of radioimmunotherapy construct for 48 hours in a 96-well plate and then assayed by the ATP Lite viability assay. (A) Treatment with 225Ac-lintuzumab. (B) Treatment in the presence of 100-fold excess unlabeled antibody. Data are mean ± SD of a representative experiment repeated 3 times. The curves were fitted using sigmoidal dose-response nonlinear regression with variable slope. The corresponding IC50 values for HL60, RA5, and RG2 were 0.59, 5.25, and 8.7 kBq/mL, respectively. (C) Cells were treated with indicated doses of 125I-Udr, and cell viability was measured by scoring of nuclear morphology, normalized to controls. (D) Percent uptake of 125I-Udr at 24 and 48 hours after treatment. 125I-Udr experiments are mean ± SEM from 2 independent experiments. A 2-way, repeated-measures ANOVA was performed to determine significance at each dose. *P < .05. **P < .01. ***P < .001.
Similar results were obtained from 125I-dUdr treatment of cells, where decay primarily through electron capture produces Auger electrons that act as high LET particles, creating complex DSBs.19,20 Despite nearly identical uptake of the molecule in the 3 cell lines (Figure 3D), apoptosis was reduced in RA5 and RG2 cells relative to HL60 at 48 hours after treatment (Figure 3C). It was difficult to control the dose of internalized high LET emitters to levels low enough to ascertain differences between RA5 and RG2 compared with HL60. These data are consistent with that obtained with the external α irradiator.
Late G2/M arrest is reduced in RA5 and RG2 cells and depends significantly on the LET of the IR
Radiosensitivity is dependent on cell cycle stage.21 Cell cycle analysis showed that the doubling time and cell cycle distribution kinetics of the 3 cell lines were similar (Table 3). However, RA5 and RG2 cells had an ∼ 2-fold increase in the dose of γ-rays needed to achieve 50% inhibition of thymidine incorporation at 36 hours after γ-IR compared with HL60 (supplemental Figure 6A). HL60 lacks a functional G1/S checkpoint,22 so we restricted our analysis to the 2 molecularly distinct G2/M checkpoints23 to determine whether changes in checkpoint functionality could explain the survival data in resistant clones. We performed bivariate flow cytometric analysis to quantitate the number of cells attempting division after IR. We found that the early, ATM-dependent G2/M checkpoint for cells in G2 during IR exposure to be similar in all 3 cell lines 1 hour and 2 hours after IR (supplemental Figure 6B-C). These data suggested that ATM functionality is largely intact and that early DNA damage-sensing machinery is similar in sensitive and resistant cell lines.
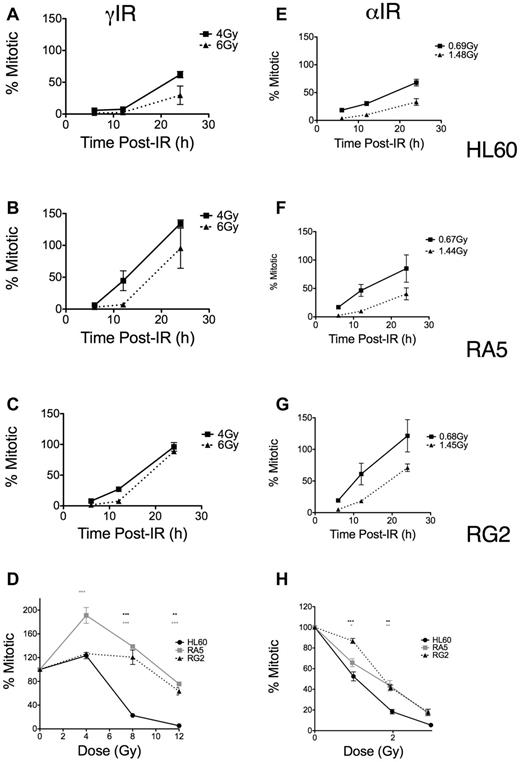
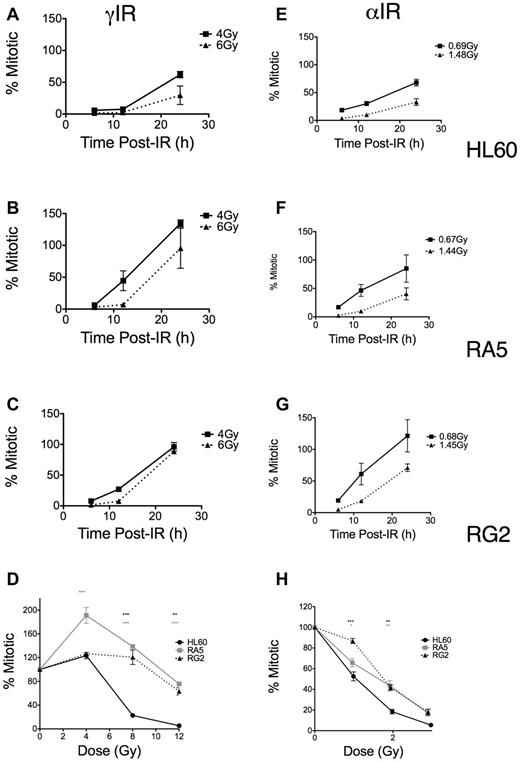
In contrast, using the same mitotic assay, we found differences in the dose-dependent late G2 accumulation and subsequent release into mitosis as both a function of time (Figure 4A-C,E-G) and dose (Figure 4D,H). These differences depended on the type of LET of the IR. RA5 and RG2 cells more rapidly entered mitosis compared with HL60, particularly at higher doses of γ-IR (Figure 4A-C). Similar, less robust results were seen with α-particles (Figure 4E-G). These data indicated that more substantial cell cycle arrest (ie, reduced replicative capacity) in resistant cells after α-particle exposure may have prevented increased colony formation, thus explaining the survival data observed after α-particle exposure (Figure 2). Similarly, when we compared mitotic indices at 24 hours after IR over a range of doses, the resistant lines showed significant increases in mitotic indices compared with HL60 cells, but these differences were substantially less after high LET IR (Figure 4D,H). Thus, although resistant cells were much less likely to undergo apoptosis after IR exposure, the relatively large differences in checkpoint desensitization for resistant cells treated with iso-effective γ-ray and α-particle exposures suggested that the quality and type of the DNA damage cells sustain after IR exposure still played a large role in G2/M checkpoint arrest and subsequent colony formation.
Late G2 checkpoint arrest is attenuated in RA5 and RG2 cells after IR. Cells were irradiated with indicated doses of γ-IR (A-D) or α-IR (E-H) and assayed for mitotic index as described in “Mitotic index assay.” Data are normalized to unirradiated controls and are mean ± SEM from 3 independent experiments. Cells were analyzed for both time responses following specific doses (A-C,E-G) and dose-response at 24 hours after IR. (D,H) Two-way, repeated measures ANOVA was used to test for differences at each dose. *P < .05. **P < .01.***P < .001.
Late G2 checkpoint arrest is attenuated in RA5 and RG2 cells after IR. Cells were irradiated with indicated doses of γ-IR (A-D) or α-IR (E-H) and assayed for mitotic index as described in “Mitotic index assay.” Data are normalized to unirradiated controls and are mean ± SEM from 3 independent experiments. Cells were analyzed for both time responses following specific doses (A-C,E-G) and dose-response at 24 hours after IR. (D,H) Two-way, repeated measures ANOVA was used to test for differences at each dose. *P < .05. **P < .01.***P < .001.
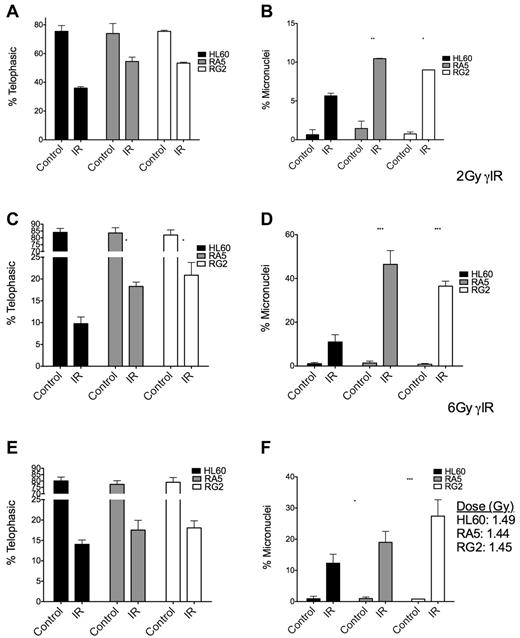
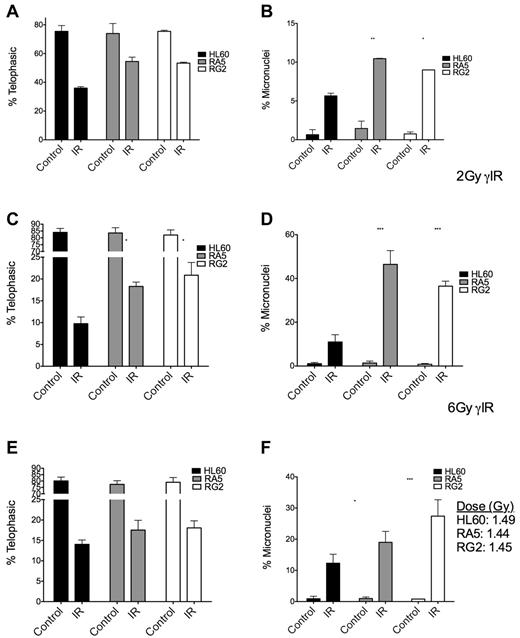
To gain a better understanding of the checkpoint behavior of RA5 and RG2 cells, we used the micronucleus assay to measure the extent of attempted cell division after IR and residual chromosomal DNA damage in the form of micronuclei.24 At both high and low doses of γ-IR, RA5 and RG2 cells had higher proportions of mitotic cells, but this effect was accompanied by a higher percentages of cells with micronuclei (Figure 5A-D), indicative of increased chromosomal instability.25 After a mean dose of ∼ 1.5 Gy of α-particles, the radioresistant cells still had significantly higher levels of micronuclei, but not significant increases in the percentage of mitotic cells after IR (Figure 5E-F), consistent with the data from the mitotic index assay (Figure 4). Thus, at iso-effective doses (Figure 5C,E), α-particles were more able than γ-rays to prevent premature entry into mitosis in radioresistant cells versus naive cells.
Mitotic indices and proportion of binucleated cells with micronuclei are increased in RA5 and RG2 cells compared with HL60 after IR. Cells were irradiated with 2 Gy γ-IR (A-B), 6 Gy γ-IR (C-D), or ∼ 1.5 Gy α-particles (E-F) and assayed for mitotic index (A,C,E) and percent of binucleated cells with micronuclei (B,D,F). Data are mean ± SEM from 3 independent experiments. Samples were scored as indicated in “Micronucleus assay.” Two-way, repeated-measures ANOVA with Bonferroni posttests were performed to analyze significance of each treatment between HL60 and resistant cells. *P < .05. **P < .01.***P < .001.
Mitotic indices and proportion of binucleated cells with micronuclei are increased in RA5 and RG2 cells compared with HL60 after IR. Cells were irradiated with 2 Gy γ-IR (A-B), 6 Gy γ-IR (C-D), or ∼ 1.5 Gy α-particles (E-F) and assayed for mitotic index (A,C,E) and percent of binucleated cells with micronuclei (B,D,F). Data are mean ± SEM from 3 independent experiments. Samples were scored as indicated in “Micronucleus assay.” Two-way, repeated-measures ANOVA with Bonferroni posttests were performed to analyze significance of each treatment between HL60 and resistant cells. *P < .05. **P < .01.***P < .001.
We tested whether inhibition of late G2 arrest alone by pretreatment of cells with caffeine22 1 hour before IR was sufficient to improve the naive HL60 cell's ability to survive γ-rays. We measured micronuclei formation at 20 hours after IR, the accumulation of G2 arrest at 18 hours after IR, and clonogenic survival. Although caffeine was capable of almost completely abolishing G2 arrest (supplemental Figure 7A-B), there was no improvement in clonogenic survival after 4 Gy γ-IR (supplemental Figure 7C). Moreover, inhibition of late G2 arrest led to increased IR-induced micronuclei compared with cells irradiated in the absence of caffeine (supplemental Figure 7D). These results demonstrated that perturbing late G2 checkpoint activity alone is not sufficient to produce radioresistance in HL60 cells.
Lesion-specific DNA damage is better repaired in RA5 and RG2 cells compared with HL60 cells
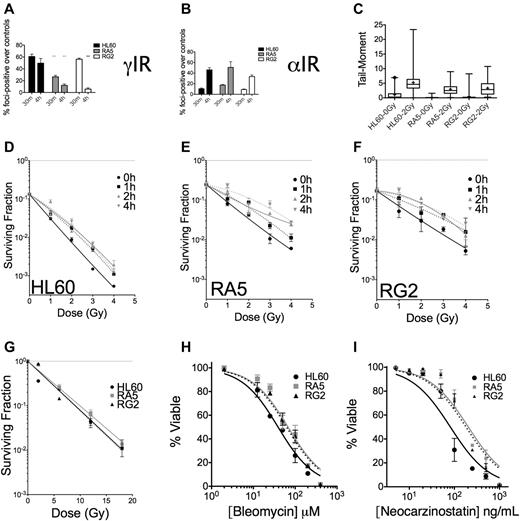
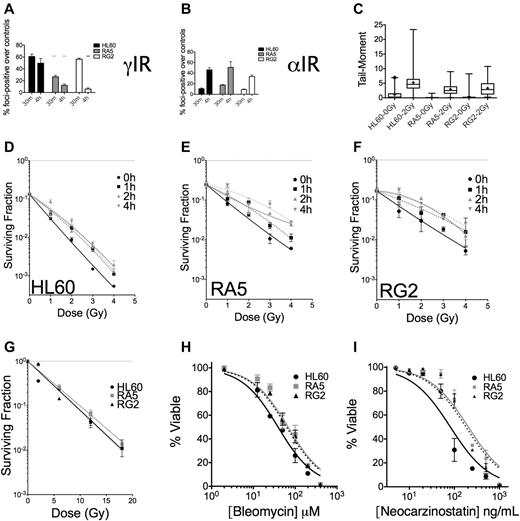
To assess IR-induced DNA damage and repair of DSBs, we assayed for phosphorylated serine-139 on the histone H2A variant H2A.X (also known as γH2A.X), a biochemical marker of DNA DSBs.26,27 Because the majority (> 95%) of untreated cells in the 3 cell lines under investigation had 10 or fewer foci, we scored cells as positive for having IR-induced foci if the nucleus contained 11 or more foci. These experiments revealed that at 30 minutes after IR, γH2A.X foci were similar in HL60 and RG2 cells but substantially lower in RA5 cells (Figure 6A). At 4 hours after IR, however, greater than 50% of foci had been resolved in the resistant cell lines, whereas HL60 cells had only resolved ∼ 15% of their foci-positive cells (Figure 6A). These data indicated that the repair of DNA DSBs was more rapid in the radioresistant cells. Analysis of the data by the reduction in mean γH2A.X foci/cell yielded similar conclusions (supplemental Figure 9). In contrast to the data after γ-IR, there were similar levels of foci-positive cells in HL60, RA5, and RG2 cells after an equitoxic dose of ∼ 0.5 Gy of α-particles at 4 hours (Figure 6B, see supplemental Discussion for further analysis). Therefore, the DNA damage after α-particles is more difficult to resolve, limiting radioresistance to α-particles.
Nonclustered DNA damage and DSB repair are improved in RA5 and RG2 cells compared with HL60. Cells were irradiated with 2 Gy γ-IR (A) or an approximate dose of 0.5 Gy α-particles per nucleus (B) and assayed for percent foci-positive cells (n = 500) relative to controls at 30 minutes and 4 hours after IR. (C) Cells were irradiated with 2 Gy γ-IR on ice in PBS and immediately processed for DSB formation by the neutral comet assay. Data are box and whisker plots: whiskers are 1st and 99th percentiles; and +, means (calculated from at least 100 cells per sample). (D-F) Cells were irradiated with a test dose of 3 Gy of γ-rays and allowed to incubate under standard cell culture conditions for the indicated times before additional irradiation with indicated doses of γ-rays, and then assayed for clonogenic survival. Cells were irradiated under hypoxic conditions (< 0.1% O2) with indicated doses of γ-rays before assaying for clonogenic survival (G). (H-I) Cells were treated with indicated doses of bleomycin (H) or neocarzinostatin (I) and assayed for apoptosis 48 hours after treatment. They were are fitted by nonlinear regression. IC50 values exceed the 95% CI for both resistant clones. Data are mean ± SEM from at least 2 independent experiments. *P < .05. **P < .01. ***P < .001.
Nonclustered DNA damage and DSB repair are improved in RA5 and RG2 cells compared with HL60. Cells were irradiated with 2 Gy γ-IR (A) or an approximate dose of 0.5 Gy α-particles per nucleus (B) and assayed for percent foci-positive cells (n = 500) relative to controls at 30 minutes and 4 hours after IR. (C) Cells were irradiated with 2 Gy γ-IR on ice in PBS and immediately processed for DSB formation by the neutral comet assay. Data are box and whisker plots: whiskers are 1st and 99th percentiles; and +, means (calculated from at least 100 cells per sample). (D-F) Cells were irradiated with a test dose of 3 Gy of γ-rays and allowed to incubate under standard cell culture conditions for the indicated times before additional irradiation with indicated doses of γ-rays, and then assayed for clonogenic survival. Cells were irradiated under hypoxic conditions (< 0.1% O2) with indicated doses of γ-rays before assaying for clonogenic survival (G). (H-I) Cells were treated with indicated doses of bleomycin (H) or neocarzinostatin (I) and assayed for apoptosis 48 hours after treatment. They were are fitted by nonlinear regression. IC50 values exceed the 95% CI for both resistant clones. Data are mean ± SEM from at least 2 independent experiments. *P < .05. **P < .01. ***P < .001.
Comet assays confirmed that the lower initial formation of γH2A.X foci in RA5 cells after γ-IR was not a reflection of lower induction of DNA damage (eg, through up-regulated intracellular radical-scavenging molecules), as all 3 cell lines had similar increases in comet tail moments (measured by both mean and median) immediately after 2 Gy of γ-IR (Figure 6C).
The level and persistence of DSBs (particularly at early time points) induced by IR do not always correlate with the ability of the cell to survive IR-induced DNA damage.28,29 The quality and proximity of DSBs can have a large impact on whether a lethal lesion is formed.3 When we split doses of γ-IR in time, allowing for sublethal damage repair, we found that this type of repair was enhanced in RA5 and RG2 cells compared with HL60 (Figure 6D-F). The quasi-threshold dose, Dq, for HL60 cells improved to 0.5 Gy after splitting the dose by 1 hour and increased to 1 Gy when the dose was split by 4 hours. In contrast, the Dq for both RA5 and RG2 cells was 1 Gy with 1 hour of incubation at 37°C between irradiations and increased to ∼ 2 Gy after 4 hours of split-dose incubation time. Sublethal damage damage repair would be expected to have little effect on survival after α-particles because the complex DNA lesions would be difficult to restore to nonlethal lesions. Indeed, splitting a single dose of 3 mean α-particles per nucleus into 2 exposures separated by 2 hours showed no increase in survival than the same dose in 1 exposure in all 3 cell lines (supplemental Figure 10).
We also observed that the relative radioresistance of RA5 and RG2 cells was nearly abolished by hypoxia (0.1%; Figure 6G). Although these data suggest that RA5 and RG2 cells have mechanisms that protect them against reactive oxygen species during IR, efforts to test this hypothesis by probing for changes in cellular gluthathione levels, catalase activity, and resistance to hydrogen peroxide and doxorubicin (reactive oxygen species-dependent death) did not support a reactive oxygen species-mediated mechanism (supplemental Figure 11).
Alternatively, RA5 and RG2 may be less sensitive to damage under hypoxia because hypoxic conditions reduce a substantial portion of the indirect, radical-mediated damage to DNA.30 This could, therefore, cause a shift in the balance from 2-track ionization cell killing to single-track ionization cell killing because 2-track cell killing, more dependent on free radical formation, would be reduced under such circumstances.31,32 The striking resemblance of the survival curve in Figure 6G and the α-particle survival curve in Figure 2C, where differences in survival exist at only low doses, illustrate this point. It is also possible that the lack of oxygen may reduce the chemical complexity of DNA damages, reducing the relative radioresistance of RA5 and RG2 cells compared with HL60, which under hypoxia may have similar DNA repair capacity. In either case, the data demonstrated the qualitative dependence on the type of DNA damage that can be withstood in radioresistant clones.
The apoptotic response to the radiomimetic drugs bleomycin and neocarzinostatin, which create a high frequency of DNA damage clusters,33,34 was only mildly reduced in resistant clones relative to HL60, with IC50 increases of approximately 2-fold for each drug (Figure 6H-I). Therefore, the survival and DNA damage data from Figure 6 suggest that clustered versus nonclustered DNA damage has a substantial effect on the radioresistance that can be achieved in radioresistant cells, consistent with the survival data after α-particle exposure (Figure 2C).
RA5 and RG2 cells depend on homology directed repair for significant radioresistance to γ-IR
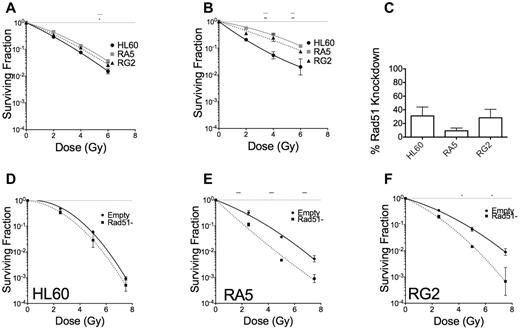
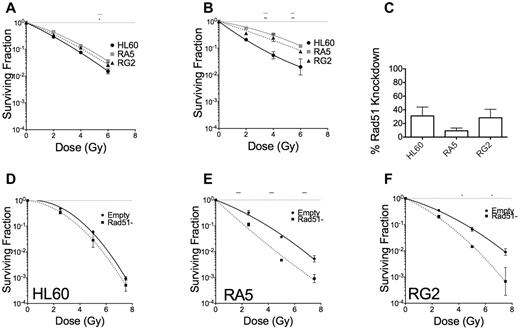
DSB repair can occur via 2 distinct mechanisms that largely depend on cell cycle stage, nonhomologous end-joining, and homology directed repair (HDR).35 HDR is primarily used in the late S or G2 phases of the cell cycle, when the sister chromatid is available for template-mediate repair. We tested whether HDR could be leading to radioresistance in RA5 and RG2. Cells were enriched at the G1/S border by double thymidine block and irradiated 1 hour or 5 hours after release from the G1/S border (supplemental Figure 12). When irradiated in early S phase, RA5 and RG2 cells were almost as sensitive to γ-rays as HL60 (Figure 7A). RA5 and RG2 cells irradiated at 5 hours after G1/S release, however, demonstrated radioresistance closer to their baseline levels, indicating that HDR might be playing a key role in radioresistance for RA5 and RG2 cells (Figure 7B). To confirm these data, we created viral particles expressing shRNA targeted to Rad51, which is essential for HDR. Knockdown of the Rad51 protein (Figure 7C; supplemental Figure 13) decreased clonogenic survival in RA5 and RG2 cells to a much greater extent than in HL60 cells (Figure 7D-F). These data demonstrate that radioresistance in RA5 and RG2 is exquisitely dependent on proper DNA repair, perhaps because of shorter G2 checkpoint arrest after IR.
RA5 and RG2 depend on homology directed repair for radioresistance. Cells were synchronized to the early G1/S border by double thymidine block and were irradiated 1 hour (A) or 5 hours (B) after release into regular medium and assayed for clonogenic survival. (C) Percent knockdown of Rad51 relative to cells infected with control virus after normalization to β-actin. (D-F) Cells were irradiated with indicated doses of γ-IR and assayed for clonogenic survival. Data are mean ± SEM from at least 2 independent experiments. *P < .05, **P < .01, and ***P < .001, for indicated dose relative to HL60 (A-B) or in Rad51-depleted cells relative to “Empty” control cells (D-F).
RA5 and RG2 depend on homology directed repair for radioresistance. Cells were synchronized to the early G1/S border by double thymidine block and were irradiated 1 hour (A) or 5 hours (B) after release into regular medium and assayed for clonogenic survival. (C) Percent knockdown of Rad51 relative to cells infected with control virus after normalization to β-actin. (D-F) Cells were irradiated with indicated doses of γ-IR and assayed for clonogenic survival. Data are mean ± SEM from at least 2 independent experiments. *P < .05, **P < .01, and ***P < .001, for indicated dose relative to HL60 (A-B) or in Rad51-depleted cells relative to “Empty” control cells (D-F).
Discussion
We have examined radioresistance of myeloid leukemia cells to IR of different LET, using γ-rays and α-particles, with incident LETs of ∼ 1 and 132 keV/μm13, respectively. We are not aware of other α-particle–resistant clones of leukemia cells. The data revealed a number of possible mechanisms that could account for resistance. However, the limited number of clones examined do not exclude other pathways that may also be involved. Compared with their unirradiated parental HL60 cells, the defined cell lines showed significantly increased radioresistance. However, radioresistance, as measured by assays of apoptosis and clonogenic survival, was qualitatively and quantitatively different after different types of test radiation. Resistance to γ-rays was far more pronounced. Increases in clonogenic survival after α-IR were seen only at low doses, where the majority of cells received 2 or fewer α-particle traversals through the nucleus. In the RA5 and RG2 clones studied in detail, early DNA damage sensing appeared to be similar in sensitive and resistant cells. Late G2 arrest was reduced in the radioresistant cell lines, apoptosis was markedly reduced, and improved DNA repair was necessary to impart radioresistance in RA5 and RG2 cells, particularly through HDR. Meanwhile, DNA damage by high LET IR was more difficult to resolve, and repair of α-particle–induced DSBs was not improved in the radioresistant cells. These results are consistent with the increased tendency to divide (and thus avoid apoptosis) with extant DNA damage that imparted resistance to RA5 and RG2 cells when exposed to low numbers of α-particles, but not at higher α-particle doses, where this mechanism probably became overwhelmed by genomic damage.
The 15 rounds of irradiation used to create the radioresistant cell clones began and terminated at equitoxic doses in naive cells. Therefore, it is not unexpected that the increase in radioresistance was similar for RA and RG clones after exposure to either type of IR. However, whereas resistance to γ-rays was observed at all doses tested, resistance to α-particles quickly saturated after mean doses that exceeded 1 α-particle traversal, leading to an increase in D50 of ∼ 0.25 Gy in resistant clones, when calculated according to the methods of Charlton and Sephton.14 The data suggest that the mechanisms we have attributed to radioresistance in these specific clones, derived from both chronic γ-ray and α-particle exposures, were quantitatively and qualitatively similar. Not surprisingly, the limited α-particle resistance appeared to correlate with the inability of resistant cells to cope with highly complex DNA damages, as previously described.36 Indeed, low LET irradiation under hypoxia almost eliminated radioresistance in RA5 and RG2 cells, whereas resistance to the clustered damage-inducing radiomimetics bleomycin and neocarzinostatin was modest in RA5 and RG2 cells, further supporting the hypothesis that DNA lesion type largely determines cell fate after IR exposure, even in cells technically defined as “radioresistant.”37
From a mechanistic standpoint, the changes in the cell survival curve after IR exposure in RA5 and RG2 cells could simply be attributed to reductions in IR-induced apoptosis, often observed in γ-IR–resistant cancer cell variants, including HL60.38-40 Similarly, the increased propensity to undergo mitosis in the radioresistant cells after IR exposure could account for radioresistance, despite residual chromosomal damage, as reported by other studies41 (and J. Seideman, N. Veomett, D.A.S., observations under review, September 2009). However, naive HL60 cells treated with caffeine before IR demonstrated that inhibition of late G2 arrest after IR did not increase clonogenic survival. In addition, the stronger dependence of RA5 and RG2 cells on Rad51-mediated HDR for cell survival after γ-rays compared with HL60, suggested that lack of IR-induced apoptosis is necessary, but not sufficient, for radioresistance in these cells. Therefore, it is likely a combination of perturbations in apoptosis, G2 checkpoint maintenance, and DNA repair that led to radioresistance in RA5 and RG2 cells. It is likely, however, that additional mechanisms, perhaps in different combinations, would also be uncovered in other radioresistant HL60 clones.
The application of α-particle therapies currently in clinical trials, including lintuzumab conjugated to 213Bi or 225Ac for myeloid leukemia, 223Ra to treat bone metastases in prostate and breast cancer patients, and 211At for glioblastoma, make a better understanding of α-particle–induced radioresistance and sensitivity critical. This information may help to understand how to protect normal hematopoietic progenitors from damage or mutagenesis after α-particle therapy. The results presented here shed light on potential mechanisms that myeloid leukemia cells acquired to become radioresistant. Although resistance mechanisms may differ between individual RA and RG clones, our survival data from other clones suggest that induced radioresistance is at least quantitatively similar for all clones in the population. Importantly, the data demonstrate the potent cytotoxicity of α-particles and limited resistance cancer cells can achieve to high LET IR, warranting further efforts to include them as part of cancer therapies.
The online version of this article contains a data supplement.
The publication costs of this article were defrayed in part by page charge payment. Therefore, and solely to indicate this fact, this article is hereby marked “advertisement” in accordance with 18 USC section 1734.
Acknowledgments
The authors thank Dr Jonathan Seideman, Dr John Humm, Dr John Petrini, and Dr Richard Kolesnick for helpful discussions and feedback; Dr Michael McDevitt for providing 225Ac-labeled lintuzumab; and Oakley Olson for assistance with some experiments.
This work was supported by the National Institutes of Health (R01-CA55349), the Weill Cornell Department of Pharmacology (training grant T32 GM073546), the Lymphoma Foundation, the Reuven Merker Foundation, the Tudor Foundation, and the Glades Foundation.
National Institutes of Health
Authorship
Contribution: K.J.H. designed and performed research, collected, analyzed, and interpreted data, and wrote the manuscript; A.C.S. performed research and collected data; and D.A.S. designed research, analyzed and interpreted data, and wrote the manuscript.
Conflict-of-interest disclosure: The authors declare no competing financial interests.
Correspondence: David A. Scheinberg, Memorial Sloan Kettering Cancer Center, 1275 York Ave, New York, NY 10065; e-mail: d-scheinberg@ski.mskcc.org.

