Abstract
Genetic aberrations, including trisomies 3 and 18, and well-defined IGH translocations, have been described in marginal zone lymphomas (MZLs); however, these known genetic events are present in only a subset of cases. Here, we report the cloning of an IGH translocation partner on chromosome X, t(X;14)(p11.4;q32) that deregulates expression of an poorly characterized orphan G-protein–coupled receptor, GPR34. Elevated GPR34 gene expression was detected independent of the translocation in multiple subtypes of non-Hodgkin lymphoma and distinguished a unique molecular subtype of MZL. Increased expression of GPR34 was also detected in tissue from brain tumors and surface expression of GPR34 was detected on human MZL tumor cells and normal immune cells. Overexpression of GPR34 in lymphoma and HeLa cells resulted in phosphorylation of ERK, PKC, and CREB; induced CRE, AP1, and NF-κB–mediated gene transcription; and increased cell proliferation. In summary, these results are the first to identify a role for a GPR34 in lymphoma cell growth, provide insight into GPR34-mediated signaling, identify a genetically unique subset of MZLs that express high levels of GPR34, and suggest that MEK inhibitors may be useful for treatment of GPR34-expressing tumors.
Introduction
B-cell non-Hodgkin lymphoma encompasses a heterogeneous group of B lymphocyte–derived malignancies that are characterized by chromosomal translocations involving the immunoglobulin (IG) gene loci and specific histologic subtypes of disease are associated with a different spectrum of IG translocations.1 Marginal zone-derived B-cell lymphomas encompass 3 distinct entities: extranodal marginal zone B-cell lymphoma (MZL) of mucosa associated lymphoid tissue (MALT), nodal MZL (NMZBCL), and splenic MZL (SMZBCL). Together they compromise nearly 12% of all B-cell non-Hodgkin lymphomas. MALT lymphoma is genetically unique and 5 mutually exclusive chromosomal translocations have been identified in this disease thus far: t(11;18)/BIRC3(aka API2)-MALT1,2-4 t(1;14)/IGH-BCL10,5 t(14;18)/IGH-MALT16 t(3;14)/IGH-FOXP1,7 and t(X;14)/IGH-GPR34.8 Despite this genetic heterogeneity, all but one of the translocations affect the NF-κB signaling pathway.9 However, the known translocations are only present in a subset of cases suggesting that additional uncharacterized translocations or other genetic events may exist that contribute to disease development. Identification of novel translocations and subsequent characterization of the proteins involved not only has relevance in the pathogenesis and diagnosis of cancer, it also provides insight into the normal cellular functions of a given protein and may allow for new targeted therapeutic approaches. In the case of the IGH-BCL10 t(1;14) translocation, cloning and characterization of Bcl10 revealed its normal cellular function as a key molecule in antigen receptor signaling10,11 and NF-κB activation.12 In this study, we identify and characterize the biologic significance of t(X;14)/IGH-GPR34. We provide evidence that GPR34 is highly expressed in MZL independent of the translocation, identify a role for a GPR34 in lymphoma cell growth, provide insight into GPR34-mediated signaling, and identify a genetically unique subset of MZLs that express high levels of GPR34.
Methods
Patient material and cell lines
The Institutional Review Board at the Mayo Clinic reviewed and approved this study. DNA and tumor tissue from NHL patients and normal controls was acquired at the Mayo Clinic on providing written informed consent, per the Declaration of Helsinki. HeLa cells were obtained from the ATCC, JeKo-1 lymphoma B cells were obtained from the DSMZ, and OCI-Ly19 lymphoma B cells were provided by Dr Margaret Shipp (Dana-Farber Cancer Institute).
Cloning of the t(X;14) breakpoint by long-distance inverse polymerase chain reaction.
LDI-PCR to detect IGH translocation breakpoint was carried out as previously described.13,14 PCR primers are listed in supplemental Figure 1A (available on the Blood Web site; see the Supplemental Materials link at the top of the online article). Sequences of the regions of interest were analyzed via the University of California Santa Cruz Genome Bioinformatics database using BLAT (http://genome.ucsc.edu/cgi-bin/hgBlat/).
Quantitative real-time PCR
qPCR was performed on a light cycler (Roche) using TaqMan probes (Applied Biosystems). Nucleotide sequences for GPR34, GPR82, and CASK used for primer design, were NM_005300, NM_080817, and NM_003688, respectively, and primers are listed in supplemental Figure 1B. cDNA was generated from 1 μg of RNA and 2 μL of the cDNA reaction was used as template. Raw data were analyzed with the Light Cycler Version 3 software. Quantification of each mRNA was done using the absolute standard curve method and then normalized to GAPDH. Standards were generated by amplifying CASK, GPR34, and GPR82 from HL60 cells and cloning into TOPO TA 2.1. A standard curve was derived from serial dilutions of each plasmid. Relative concentrations are expressed in copies/μL.
Fluorescence in situ hybridization
Interphase fluorescence in situ hybridization (FISH) for detection of the t(X;14) translocation was carried out as previously described,15 using an Xp11.4 break-apart probe (BAP) comprising SpectrumOrange-labeled (BACS: RP11-643E21 and RP11-524P6) and SpectrumGreen-labeled (BACS: RP11-360E17 and CTD-3202J9) DNA probes that hybridize to the proximal and distal flanking regions of the GPR82 breakpoint, respectively; a BAP FISH probe for IGH (Vysis), in which the SpectrumOrange and SpectrumGreen-labeled probes hybridize to the proximal and distal flanking regions of the IGH breakpoint, respectively; and a dual-fusion (D-FISH) DNA probe for t(X;14)(p11.4;q32), in which the SpectrumOrange-labeled DNA probe (BACS: RP11-643E21, RP11-524P6, RP11-938F1, RP11-360E17, and CTD-3202J9) spans the Xp11.4 gene region, and the SpectrumGreen-labeled DNA probe (RP11-44N21, RP11-1087P8, RP11-521B24, RP11-731F5, RP11-417P24, RP11-112H5, RP11-101G24, and RP11-12F16) spans the IGH gene region. Interphase FISH was subsequently performed using an IGH BAP probe comprising SpectrumOrange-labeled (RP11-44N21, RP11-1087P8, RP11-521B24, RP11-731F5, RP11-417P24) and SpectrumGreen-labeled (RP11-112H5, RP11-101G24, and RP11-12F16) DNA probes that span the IGH gene region. Interphase FISH for detection of t(11;18)(q21;q21)/BIRC3-MALT1 fusion was also performed using a MALT1 BAP probe (Vysis) and a BIRC3-MALT1 D-FISH probe (Vysis). In this paper, SpectrumOrange-labeled signals are referred to as red (R), SpectrumGreen labeled signals as green (G), and SpectrumOrange-SpectrumGreen fusion signals as fusion (F).
Array CGH.
Genomic DNA was obtained from frozen tumor cells from the t(X;14) patient. Array-based comparative genomic hybridization (aCGH) was performed with the Human Genome 244A microarray (Agilent Technologies; Palo Alto, CA) as previously described.16 Copy-number abnormalities (CNA) were calculated using aberration detection module (ADM)–1 algorithm17 with threshold of 7.5.
Gene expression profile analysis
RNA extracted from MALT, NMZBCL, SMZBCL, LPL, and normal lymph node or spleen biopsy specimens was isolated and used for GEP analysis as previously described.18 Additional data were generated from public GEP data sets for ABC-DLBCL, GCB-DLBCL, and PMBCL19 (GSE11318); normal and malignant brain tissue20 (GSE4536); and normal human B cells21 (GSE17186). All samples were profiled for gene expression using the Affymetrix U133 Plus 2.0 arrays, data were MAS5 transformed and intensities were log2 median normalized. In a secondary analysis, GEP profiles from MALT, NMZBCL, SMZBCL, LPL, and normal lymph node or spleen biopsy specimens was used in a supervised analysis to determine whether high GPR34 expression, defined as those tumors that express GPR34 at levels greater than 2 standard deviations above the mean of the normal controls, correlated with a unique GEP compared with GPR34 low expressing tumors. For this analysis, the samples were preprocessed using GC-RMA22 background subtraction and quantile normalization. The expression level of each probe set was summarized using the median polish method.
Expression of GPR34 in HeLa and OCI-Ly19 cells
GPR34 mRNA was amplified from normal PBMC cDNA and cloned into the pBMN-GFP retroviral vector (Orbigen) or the pLex-MCS lentiviral vector (Open BioSystems). The GPR34-DRY construct was generated from the wild type plasmid using PCR SOEing. The GPR34 plasmids were transfected into packaging cell lines using Lipofectamine 2000 and after 48 to 72 hours viral supernatant was used for infection of HeLa and OCI-Ly19 cells. HeLa cells were single well sorted in 96-well plates and clones were screened by GFP and GPR34 expression. The GPR34-expressing bulk population and 2 independent clones were tested for Erk activation to ensure consistent results. OCI-Ly19 cells were isolated by puromycin selection and screened by GPR34 expression.
Flow cytometry
Mononuclear cells were isolated from patient biopsies using a Ficoll-Hypaque gradiant. Cell lines and patient samples were stained with anti–human GPR34 antibody (R&D Systems) or an isotype control anti–mouse IgG2 (BD), washed, and stained with goat anti–mouse IgG PE (Biosource International), followed by FITC-conjugated isotype control, CD19, CD3, or CD14 (BD) for 30 minutes on ice. FlowJo Version 6.4 software (TreeStar) was used for analyses.
Confocal microscopy
GPR34 mRNA was amplified from normal PBMC cDNA and cloned into pCI2-Flag-YFP (gift from Billadeau Lab) using EcoR1 and Kpn1 restriction sites. HeLa cells were transiently transfected and YFP vector control or YFP-tagged GPR34 was grown on coverslips and stained with DAPI. The cells were imaged on a Zeiss LSM-510 confocal microscope (Carl Zeiss Imaging) at room temperature with a C-Apochromat 63×/1.2 numeric aperture lens (Carl Zeiss Imaging) with water immersion.
Western blot analysis
Cell lines were serum starved overnight, stimulated with PMA (200 nm for 30 minutes) or left untreated, and lysed in RIPA buffer. Levels of total and phosph forms of Erk, PKC, and CREB were measured by immunoblotting (Cell Signaling).
Luciferase assays
Cells were transiently transfected with reporter gene plasmids that have the firefly luciferase gene under the control of a specific cis-acting DNA sequence. Twenty-four hours after transfection, luciferase activity was measured in the cell extracts using a luciferase assay kit (Promega) based on the protocol provided by the manufacturer. Transfection efficiency was normalized by cotransfection with renilla.
Proliferation assays
HeLa (0.25 × 10³ cells/well) or OCI-Ly19 (0.25 × 10⁵ cells/well) cells were cultured in triplicate in 96-well flat-bottom microtiter plates in media at 37°C in the presence of 5% CO2. Twenty-four hours later, PD98059 was added at the indicated concentrations. Cells were cultured for an additional 48 hours, and pulsed with 0.05 mCi tritiated thymidine (Amersham) for 18 hours. Cells were incubated with 0.1% Trition X-100 and 3H-TdR incorporation levels were determined using a MicroBeta TriLux (PerkinElmer). All proliferation studies were performed in 3 independent assays with technical triplicates.
In vitro soft agar colony-forming assays. Cells were resuspended at 3 × 10³ cells in 0.5 mL of 0.35% agar solution containing cell culture medium and layered on top of a 0.8% agar layer in 24-well plates. Plates were maintained for 4 weeks at 37°C in a humidified atmosphere containing 5% CO2. Cell colonies were stained with 0.005% crystal violet (Sigma-Aldrich), visualized by microscopy, and photographed (Zeiss AXIO Observer D1 and Axiovision Rel. 4.8 software). Cell colonies that had achieved at least 50 and 100μm in diameter were quantified. Two independent counts were done by 2 scientists (M.M. and S.Z.) and averaged.
Statistical analysis
All statistical comparisons were done using an unpaired t test. Two-sided P values < .05 were considered statistically significant. Error bars on all graphs represent the standard error of the mean. The Pearson product-moment correlation coefficient was used for correlative analysis.
Results
Identification of t(X;14)(p11.4;q32)
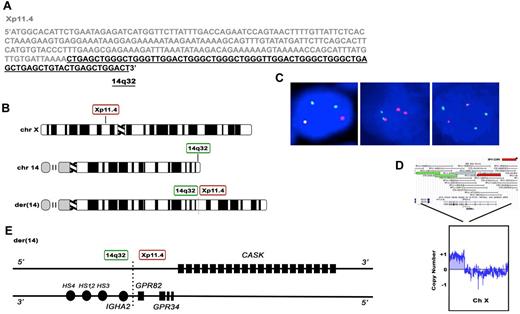
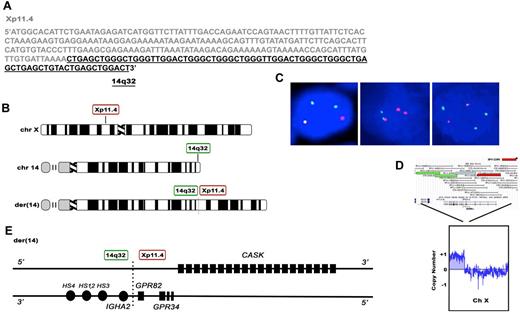
Using interphase FISH, we identified a novel translocation involving the IGH locus and an unknown partner in 60-year-old female with a history of Sjogren syndrome and primary MALT lymphoma involving the parotid gland. This case had a normal signal pattern for t(11;18)/BIRC3-MALT1 by interphase FISH. We performed long-distance inverse PCR (LDI-PCR)13,14 using primers within IGH, located at 14q32, to clone the breakpoint and found that the IGH translocation partner was located on chromosome Xp11.4; t(X;14)(p11.4;q32) (Figure 1A). Interphase FISH performed on the t(X;14) index case demonstrated a 1R2G1F pattern using the Xp11.4 BAP probe, a 2R1G1F pattern using the IGH 14q32 BAP probe, and a 1R1G3F pattern using the t(X;14)(p11.4;q32) D-FISH probe (Figure 1B-C). These findings indicate the presence of the t(X;14)(p11.4;q32) translocation as well as an extra copy of GPR82/IGH fusion. The aCGH data show an extra copy of Xp11.2 to pter (Figure 1D), consistent with an extra Xp11.4 signal by FISH. However, there are only 2 copies of chromosome 14 by aCGH, yet there are 4 IGH FISH signals [2 red, 1 green, and 1 fusion signal using the IGH BAP probe and 3 fusion and 1 green signal using the t(X;14) D-FISH probe]. These findings suggest that both copies of IGH probe region are involved in translocations, the first occurring within the typical IGH breakpoint (indicated by 1 red and 1 green signal using IGH BAP probe) and the second occurring proximally to the typical IGH breakpoint (indicated by 1 red and 1 fusion signal using IGH BAP probe; supplemental Figure 2). The presence of the second, proximal breakpoint was verified by demonstrating a split signal pattern using a BAP probe for the proximal portion of the IGH gene region, consisting of DNA BAC probes RP11-44N21 and RP11-417P24, which were labeled with SpectrumOrange and SpectrumGreen, respectively (supplemental Figure 3). We hypothesize that the first translocation is a typical balanced translocation between GPR82 and IGH. The second translocation may be part of a 3-way translocation involving an unknown chromosome (which would supply the necessary centromere), a region proximal to the typical IGH breakpoint, and the portion of the X chromosome distal to the breakpoint on the X p-arm, consistent with both the third fusion signal seen using the t(X;14) D-FISH probe as well as with the extra Xp detected by aCGH (supplemental Figure 4). Alternatively the findings could indicate that there are 2 translocations within 1 copy of IgH probe region (2 red signals and 1 green signal using IGH BAP probe) whereas the other copy is uninvolved (1 fusion signal using IGH BAP probe). The aCGH data also demonstrated an extra copy of 18q, which was confirmed by the presence of an extra intact fusion signal by FISH using the MALT1 BAP probe (data not shown).
Cloning of the of the t(X;14)(p11;q32) translocation breakpoint in MALT lymphoma. (A) Sequence of the t(X;14)(p11;q32) breakpoint. DNA sequence from Xp11.4 is shown in gray and IGHA2 in black. (B) Chromosomal location of the breakpoints on chromosome 14 and X and the structure of der.14 Idiogram Album: copyright 1994 David Adler. (C) Interphase FISH analysis of the t(X;14) index case. In the left panel the Xp11.4 BAP probe shows a 1R2G1F pattern, indicative of splitting of Xp11.4 as well as an extra copy of the distal (green) Xp arm. In the middle panel the IGH BAP probe shows a 2R1G1F pattern, consistent with the presence of 2 translocations, the first occurring within the typical IGH breakpoint region (indicated by 1 red and 1 green signal) and the second occurring proximally to the typical IGH breakpoint (indicated by 1 red and 1 fusion signal). In the right panel the t(X;14)(p11.4;q32) dual fusion probe shows a 1R1G3F signal pattern. (D) Array CGH analysis of tumor cells from the t(X;14) patient, showing an extra copy of the distal portion of chromosome X up to the position of the Xp11.4 BAP FISH probe. (E) Predicted gene organization of der.14
Cloning of the of the t(X;14)(p11;q32) translocation breakpoint in MALT lymphoma. (A) Sequence of the t(X;14)(p11;q32) breakpoint. DNA sequence from Xp11.4 is shown in gray and IGHA2 in black. (B) Chromosomal location of the breakpoints on chromosome 14 and X and the structure of der.14 Idiogram Album: copyright 1994 David Adler. (C) Interphase FISH analysis of the t(X;14) index case. In the left panel the Xp11.4 BAP probe shows a 1R2G1F pattern, indicative of splitting of Xp11.4 as well as an extra copy of the distal (green) Xp arm. In the middle panel the IGH BAP probe shows a 2R1G1F pattern, consistent with the presence of 2 translocations, the first occurring within the typical IGH breakpoint region (indicated by 1 red and 1 green signal) and the second occurring proximally to the typical IGH breakpoint (indicated by 1 red and 1 fusion signal). In the right panel the t(X;14)(p11.4;q32) dual fusion probe shows a 1R1G3F signal pattern. (D) Array CGH analysis of tumor cells from the t(X;14) patient, showing an extra copy of the distal portion of chromosome X up to the position of the Xp11.4 BAP FISH probe. (E) Predicted gene organization of der.14
To determine the prevalence of t(X;14) in MALT lymphoma, we performed interphase FISH studies on 63 additional MALT lymphomas [lung (n = 31), ocular adnexae (n = 9), salivary gland (n = 5), soft tissue (n = 5), small bowel (n = 5), colon (n = 4), thyroid (n = 2), stomach (n = 1), scalp (n = 1)] using the aforementioned break-apart probes. All 63 cases showed no splitting of either probe indicating that they lacked translocations involving these regions. Based on the sequence analysis of derivative chromosome 14, the breakpoint on Xp11.4 fell between exon 1 and 2 of GPR82 and in close proximity to GPR34, both of which code for orphan G-protein coupled receptors (GPCRs). The breakpoint also fell within and disrupted a larger gene called CASK (a membrane-associated guanylate kinase-MAGUK; Figure 1E). The breakpoint on chromosome 14 occurred in the IGHA2 switch region, placing GPR34 and GPR82 in close proximity to the IGHA2 3′ regulatory region enhancers, HS4, HS1, 2, and HS3. Sequence analysis of the breakpoint on derivative chromosome X was unsuccessful and suggests possible microdeletions in the region.
Elevated expression of GPR34 in NHL
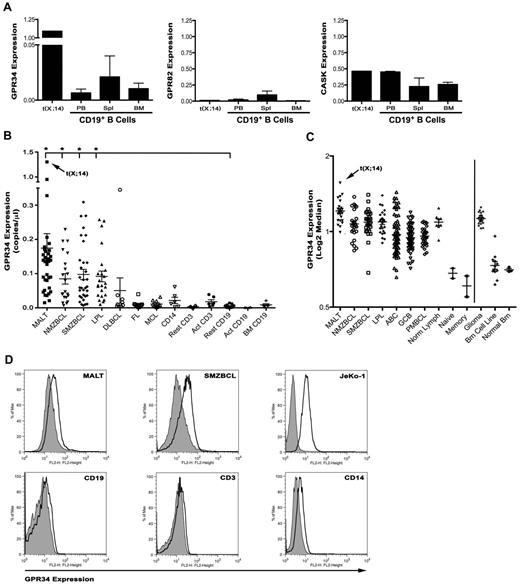
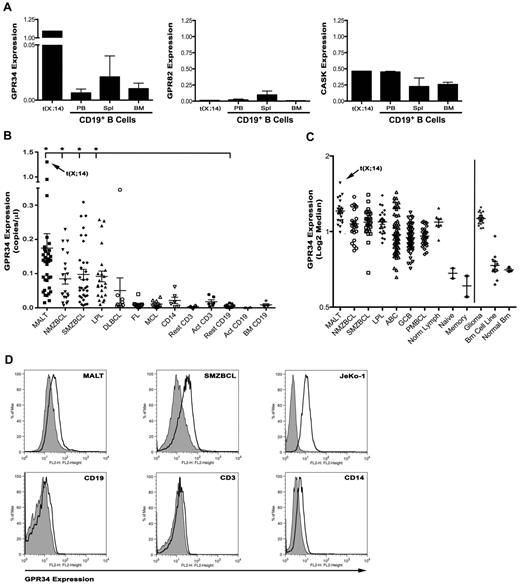
Genes that are translocated to the IG loci often have elevated gene transcription because of their proximity to IG transcriptional enhancers. To determine whether expression of the 3 genes on Xp11.4 were dysregulated, we performed qPCR with primers specific for GPR34, GPR82, and CASK on tumor tissue from the t(X;14) case and normal CD19+ B cell isolated from peripheral blood, spleen, or bone marrow (Figure 2A). GPR34 mRNA was highly expressed in the (X;14) patient compared with normal peripheral blood B cells, a 167-fold increase. In contrast, expression of GPR82 and CASK were similar between normal B cells and the t(X;14) case. These data suggest that the GPR34 gene is dysregulated on its translocation to IGHSA2.
GPR34 is deregulated by the t(X;14) translocation and is elevated in lymphoma tissue. (A) qPCR for GPR34, GPR82 and CASK from mRNA isolated from the t(X;14) specimen or CD19+ B cells from peripheral blood (PBL; n = 2), bone marrow (BM; n = 2), or spleen (Spl; n = 3) from healthy donors. Relative concentrations of GPR34 (GPR34/GAPDH) are expressed in copies/μL. (B) qPCR for GPR34 in MALT (n = 35), NMZBCL (n = 21), SMZBCL (n = 33), LPL (n = 23), DLBCL (n = 9), FL (n = 10), and MCL (n = 10) lymphomas, and normal resting (n = 11) or activated (n = 6) CD19+ B cells from peripheral blood or bone marrow (n = 5), resting and activated CD3+ T cells (n = 6) and CD14+ monocytes (n = 6). Analyses shown are the average of 2 independent experiments for each sample. *Compared with normal resting B cells, MALT (P = .03), LPL (P = .0006), NMZBCL (P = .0007), and SMZBCL (P = .001) had significantly higher GPR34 expression. (C) GPR34 gene expression analysis in lymphoma and brain tumor tissue; MALT (n = 24), NMZBCL (n = 24), SMZBCL (n = 28), LPL (n = 24), ABC DLBCL (n = 74), GCB DLBCL (n = 71), PBMCL (n = 31), normal LN (n = 8), naive B cells (n = 2), memory B cells (n = 2), glioma (n = 21), brain cell lines (n = 12), and normal brain (n = 3). (D) GPR34 expression on CD19+ tumor cells from MALT or SMZBCL biopsies, normal blood lymphocytes, and JeKo-1 lymphoma B cells. Expression of GPR34 is shown in the open histogram, isotype control in the gray histogram.
GPR34 is deregulated by the t(X;14) translocation and is elevated in lymphoma tissue. (A) qPCR for GPR34, GPR82 and CASK from mRNA isolated from the t(X;14) specimen or CD19+ B cells from peripheral blood (PBL; n = 2), bone marrow (BM; n = 2), or spleen (Spl; n = 3) from healthy donors. Relative concentrations of GPR34 (GPR34/GAPDH) are expressed in copies/μL. (B) qPCR for GPR34 in MALT (n = 35), NMZBCL (n = 21), SMZBCL (n = 33), LPL (n = 23), DLBCL (n = 9), FL (n = 10), and MCL (n = 10) lymphomas, and normal resting (n = 11) or activated (n = 6) CD19+ B cells from peripheral blood or bone marrow (n = 5), resting and activated CD3+ T cells (n = 6) and CD14+ monocytes (n = 6). Analyses shown are the average of 2 independent experiments for each sample. *Compared with normal resting B cells, MALT (P = .03), LPL (P = .0006), NMZBCL (P = .0007), and SMZBCL (P = .001) had significantly higher GPR34 expression. (C) GPR34 gene expression analysis in lymphoma and brain tumor tissue; MALT (n = 24), NMZBCL (n = 24), SMZBCL (n = 28), LPL (n = 24), ABC DLBCL (n = 74), GCB DLBCL (n = 71), PBMCL (n = 31), normal LN (n = 8), naive B cells (n = 2), memory B cells (n = 2), glioma (n = 21), brain cell lines (n = 12), and normal brain (n = 3). (D) GPR34 expression on CD19+ tumor cells from MALT or SMZBCL biopsies, normal blood lymphocytes, and JeKo-1 lymphoma B cells. Expression of GPR34 is shown in the open histogram, isotype control in the gray histogram.
Although t(X;14) was only identified in only one MALT lymphoma patient, we wanted to determine wheter GPR34 was highly expressed in other MZBCL or mature B-cell tumors, as additional genetic mechanisms may contribute to overexpression. We measured GPR34 mRNA expression in tissue biopsies from a panel of MALT, NMZBCL, SMZBCL, lymphoplasmacytic (LPL), diffuse large B cell (DLBCL), follicular (FL), and mantle cell (MCL) lymphomas (Figure 2B). As controls, we measured GPR34 in normal human resting or activated CD19+ B cells and CD3+ T cells, and CD14+ monocytes. qPCR was used for all measurements and the analyses shown are the average of 2 independent experiments. Expression of GPR34 was detected in all tissues examined, but was significantly increased in MALT (37-fold), LPL (23-fold,), NMZBCL (18-fold), and SMZBCL (21-fold) compared with resting CD19+ B cells. In normal immune tissue, GPR34 expression was highest in CD14+ monocytes and activated T cells. In one case of gastric MALT lymphoma, we detected GPR34 expression at levels similar to the t(X;14) patient and interphase FISH studies showed an extra intact GPR34 signal, but no translocation involving IGH or GPR34, suggesting that other mechanisms, including gene dosage effect, can up-regulate GPR34. Because translocations can be associated with anatomic site in MALT lymphomas, we analyzed GPR34 expression by tumor tissue site and found that GPR34 expression did not vary by anatomic site in a statistically significant manner (supplemental Figure 5). However, this could be because of the small sample size.
GPR34 mRNA expression was also analyzed by gene expression profiling (GEP) of a panel of lymphomas or control lymphoid tissue,18 and through use of publically available data on human naive or memory B cells, activated B-cell DLBCL (ABC), germinal center B-cell DLBCL (GCB), or primary mediastinal B-cell lymphoma (PMBC; Figure 2C). Gene expression analysis confirmed elevated expression of GPR34 in the t(X;14) case and detected elevated GPR34 mRNA expression in a subset of MALT, LPL, NMZBCL, SMZBCL, and ABC DLBCL. Because GPR34 expression has been detected in brain tissue,23 we also analyzed GEP data from normal and malignant brain tissues and found that GPR34 was highly expressed in brain gliomas and a brain tumor cell line.
When all patients with complete data were considered (n = 97, MALT, LPL, SMZBCL, and MZBCL), GPR34 expression levels, as determined by GEP, are associated with patient age (P = .005), stage of disease (P = .018), and with the age-adjusted international prognostic index (IPI; P = .048). The median age for patients with increased GPR34 expression was 68 years (range: 42-86) compared with 59 years (range: 34-79). Seventy-six percent of patients with increased GPR34 expression had advanced (stage III or IV) disease compared with 53% for patients with low GPR34 expression. When the age-adjusted IPI was considered, only 24% of patients with increased GPR34 expression were in the low-risk category compared with 47% of patients with low expression of GPR34. An analysis of individual disease groups was not done because of the fact that numbers in each subgroup were too small to identify distinguishing features.
To confirm the qPCR and GEP analysis of GPR34 expression, we analyzed surface expression of GPR34 by flow cytometry of normal and malignant tissues (Figure 2D). Tumor biopsies from MALT or SMZBCL were costained with GPR34 and CD19 specific antibodies and expression of GPR34 was detected on all MALT and SMZBCL B cells with and average ΔMFI of 2.08 (ΔMFI range 1.26-3.18, n = 12) and on the JeKo-1 lymphoma B cell line (ΔMFI = 4.75). Expression of GPR34 on CD19, CD3, or CD14-positive cells from peripheral blood of normal controls (n = 3) revealed a low level of GPR34 on CD19+ (average ΔMFI = 1.12) and CD3+ (average ΔMFI = 1.0) cells with higher expression being detected on CD14+ cells (average ΔMFI = 1.52). These finding support the PCR and GEP studies and indicate that GPR34 surface expression is elevated in B cells from MALT and SMZBL and that normal immune cells express low levels of GPR34 expression.
GPR34-mediated signal transduction
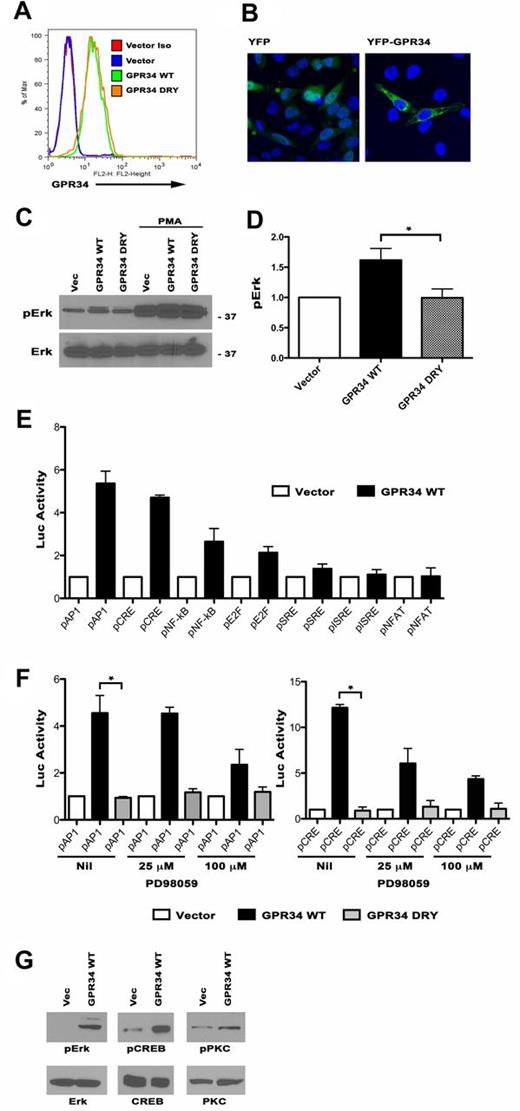
The receptor encoded by GPR34 is an evolutionarily conserved class A, or rhodopsin-like, GPCR24 and little is known about its function. Signals from GPR34 have been briefly described and suggest a role for activation of the MAP-kinase pathway25 and generation of inositol phosphates.26 To characterize the impact of GPR34 overexpression, HeLa cells, which lack surface expression of GPR34, were transduced with a retroviral control plasmid or one expressing either wild-type GPR34 (WT) or GPR34 with mutations in 2 residues downstream of the highly conserved DRY motif (DRY). Alteration of these hydrophobic residues to acidic residues (I156A and I160A) generate an inactive GPCR and mutations in this region abolishes G-protein coupling.27 GPR34 expressing cells were isolated and overexpression of WT and mutant GPR34 protein expression was confirmed by flow cytometry (Figure 3A). We also generated HeLa cells expressing a GFP-tagged GPR34, and confocal microscopy revealed localization in the cytoplasm and cell membrane (Figure 3B). To determine whether MAPK activity was up-regulated, we analyzed the phosphorylation status of ERK in WT and DRY expressing cells by Western blot and we found that ERK was constitutively phosphorylated at higher levels in WT cells compared with DRY expressing or vector control cells (Figure 3C-D). Lower ERK phosphorylation in DRY or control cells was not because of an inherent defect in the cells as all responded to PMA activation. To further explore which signaling pathways were affected by GPR34 overexpression, WT or vector control cells were transfected with an AP-1, CRE, NF-κB, E2F, SRE, NFAT, or ISRE-luciferase reporter plasmid (Figure 3E). On normalization with renilla activity, WT-expressing cells had increased luciferase activity driven by AP-1 (5.35-fold), CRE (4.7), NF-κB (2.6-fold), and E2F (2.1) compared with vector controls. GPR34 DRY was unable to activate these pathways (supplemental Figure 6A). AP-1 and CRE have been implicated in a large variety of cellular processes, including transformation, and both AP-1 and CRE activity is induced on activation of MAP kinase. In untreated cells, both AP-1 and CRE activity were significantly higher in WT cells compared with DRY cells and induction of both AP-1 and CRE luciferase activity was inhibited by the MEK1 inhibitor PD98059, suggesting that activation of these pathways is MAP-kinase dependent (Figure 3F). PD98059 did not significantly affect GPR34-mediated NF-κB activity signifying that other signaling mechanisms may regulate its activity (supplemental Figure 6B). We next confirmed the ability of GPR34 to activate the MAP-kinase pathway in B lineage cells. The OCI-Ly19 DLBCL cell line was transduced with a lentiviral expression plasmid containing WT GPR34 or a vector control (supplemental Figure 6C) and cells expressing GPR34 consistently (n = 3) had higher levels of pERK, pPKC, and pCREB when analyzed by Western blot (Figure 3G). To confirm in vivo activation of ERK in GPR34 high expressing tumors, we measured pERK expression by immunohistochemistry in the t(X;14) patient and the patient who had an extra copy of GPR34 detected by FISH. In both cases pERK was detected (supplemental Figure 6D).
Overexpression of GPR34 drives ERK1/2 activation and ERK1/2-mediated gene transcription in HeLa and lymphoma B cells. (A) HeLa cells expressing vector control, WT or DRY were analyzed for GPR34 expression by flow cytometry. (B) HeLa cells were transiently transfected with a YFP vector control or a YFP-tagged GPR34 and were visualized by confocal microscopy. (C) HeLa vector control, WT, or DRY cells were analyzed for total and phosphorylated forms of ERK1/2 with and without PMA activation by Western blot. (D) Average fold increase in ERK1/2 phosphorylation. Data are normalized to total ERK1/2. *Compared with GPR34-DRY, GPR34 WT cells had a significant increase in ERK1/2 phosphorylation (P = .05, n = 5). (E) HeLa vector control or WT cells were transiently transfected with reporter gene plasmids that have the firefly luciferase gene under the control of a specific cis-acting; pNFAT-luc, pISRE-luc, pSRE-luc, pE2F-luc, pNFKB-luc, pCRE-luc, or pAP1-luc. Data represent an average fold increase in luciferase activity over vector control (n = 3). (F) Activation of the pAP1 and pCRE reporters in vector control, WT, and DRY cells in the absence or presence of increasing doses (25-100μM) of the MEK inhibitor PD98059 (n = 2). *Compared with the nil control, WT cells have a significant increase in pAP1 (P = .04) and pCRE (P = .002) activity. (G) OCI-Ly19 vector control or WT cells were analyzed for total and phosphorylated forms of ERK1/2, PKC, and CREB Western blot.
Overexpression of GPR34 drives ERK1/2 activation and ERK1/2-mediated gene transcription in HeLa and lymphoma B cells. (A) HeLa cells expressing vector control, WT or DRY were analyzed for GPR34 expression by flow cytometry. (B) HeLa cells were transiently transfected with a YFP vector control or a YFP-tagged GPR34 and were visualized by confocal microscopy. (C) HeLa vector control, WT, or DRY cells were analyzed for total and phosphorylated forms of ERK1/2 with and without PMA activation by Western blot. (D) Average fold increase in ERK1/2 phosphorylation. Data are normalized to total ERK1/2. *Compared with GPR34-DRY, GPR34 WT cells had a significant increase in ERK1/2 phosphorylation (P = .05, n = 5). (E) HeLa vector control or WT cells were transiently transfected with reporter gene plasmids that have the firefly luciferase gene under the control of a specific cis-acting; pNFAT-luc, pISRE-luc, pSRE-luc, pE2F-luc, pNFKB-luc, pCRE-luc, or pAP1-luc. Data represent an average fold increase in luciferase activity over vector control (n = 3). (F) Activation of the pAP1 and pCRE reporters in vector control, WT, and DRY cells in the absence or presence of increasing doses (25-100μM) of the MEK inhibitor PD98059 (n = 2). *Compared with the nil control, WT cells have a significant increase in pAP1 (P = .04) and pCRE (P = .002) activity. (G) OCI-Ly19 vector control or WT cells were analyzed for total and phosphorylated forms of ERK1/2, PKC, and CREB Western blot.
GPR34 drive cell proliferation and colony formation.
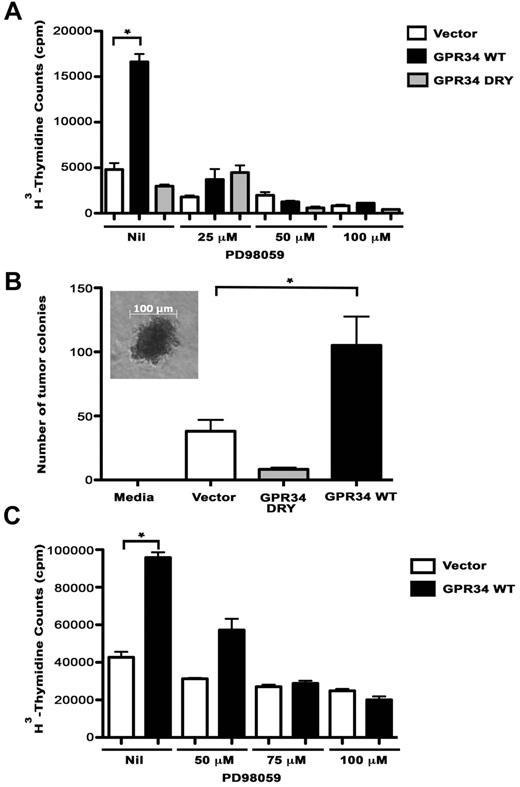
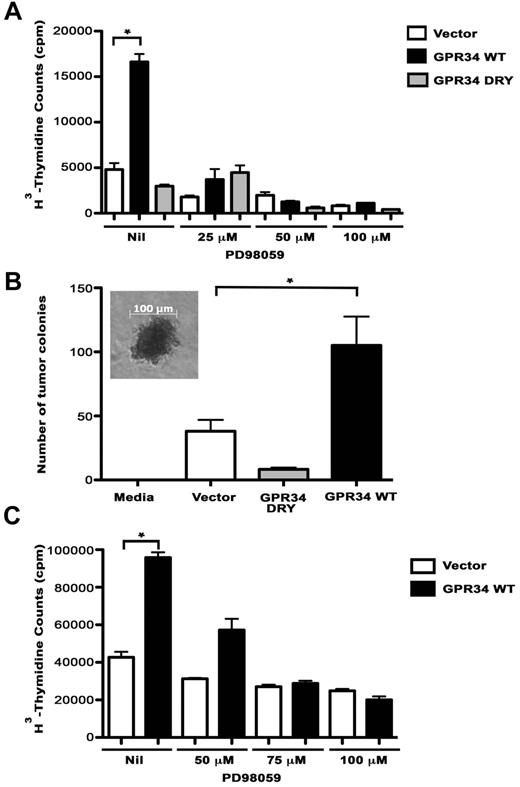
To determine the biologic impact of GRP34 overexpression, the proliferation rates of vector control, WT, and DRY cells were compared and we found that proliferation of WT cells was significantly higher compared with the DRY and vector control cells (5.6- and 3.5-fold, respectively; Figure 4A). We next tested the effect of the MEK inhibitor on proliferation and saw a dose-dependent decrease in proliferation of WT-expressing cells, suggesting that GPR34-mediated proliferation is dependent on MAPK. We then tested the ability of WT cells to generate colony formation in a soft-agar colony formation assay (Figure 4B). After 3 weeks of culture, the WT cells had formed significantly more colonies than the vector control or the DRY cells suggesting that overexpression of GPR34 can result in increased anchorage-independent cell growth. The ability of GPR34 to induce cell proliferation in a MAPK-dependent manner was also confirmed in the GPR34 expressing OCI-Ly19 lymphoma B cells (Figure 4C). The proliferation rates of vector control and WT cells were compared and we found that proliferation of WT cells was significantly higher compared with the vector control cells (2.2-fold).
GPR34 overexpression enhances cell proliferation of HeLa and lymphoma B cells. (A) Proliferation of HeLa vector control, WT, or DRY cells alone or in the in the presence of 25 to 100μM PD98059 was analyzed. *Compared with the vector control, WT cells have a significant increase in cell proliferation (P < .0001). (B) Tumor colony-forming assays were performed on HeLa vector control, WT, and DRY cells. A media control with no cells was included as a negative control. Photomicrograph of tumor colony in inset, scale bar, 100μM. *Compared with the vector control (P = .05) or DRY (P = .01), WT cells have a significant increase in colony formation (n = 3). (C) Proliferation of OCI-Ly19 vector control or WT cells alone or in the presence of 50 to 100μM PD98059 was analyzed (n = 3, representative experiment shown). *Compared with the vector control, WT cells have a significant increase in cell proliferation (P = .0002).
GPR34 overexpression enhances cell proliferation of HeLa and lymphoma B cells. (A) Proliferation of HeLa vector control, WT, or DRY cells alone or in the in the presence of 25 to 100μM PD98059 was analyzed. *Compared with the vector control, WT cells have a significant increase in cell proliferation (P < .0001). (B) Tumor colony-forming assays were performed on HeLa vector control, WT, and DRY cells. A media control with no cells was included as a negative control. Photomicrograph of tumor colony in inset, scale bar, 100μM. *Compared with the vector control (P = .05) or DRY (P = .01), WT cells have a significant increase in colony formation (n = 3). (C) Proliferation of OCI-Ly19 vector control or WT cells alone or in the presence of 50 to 100μM PD98059 was analyzed (n = 3, representative experiment shown). *Compared with the vector control, WT cells have a significant increase in cell proliferation (P = .0002).
GPR34 expression distinguishes a unique molecular subtype of NMZBL
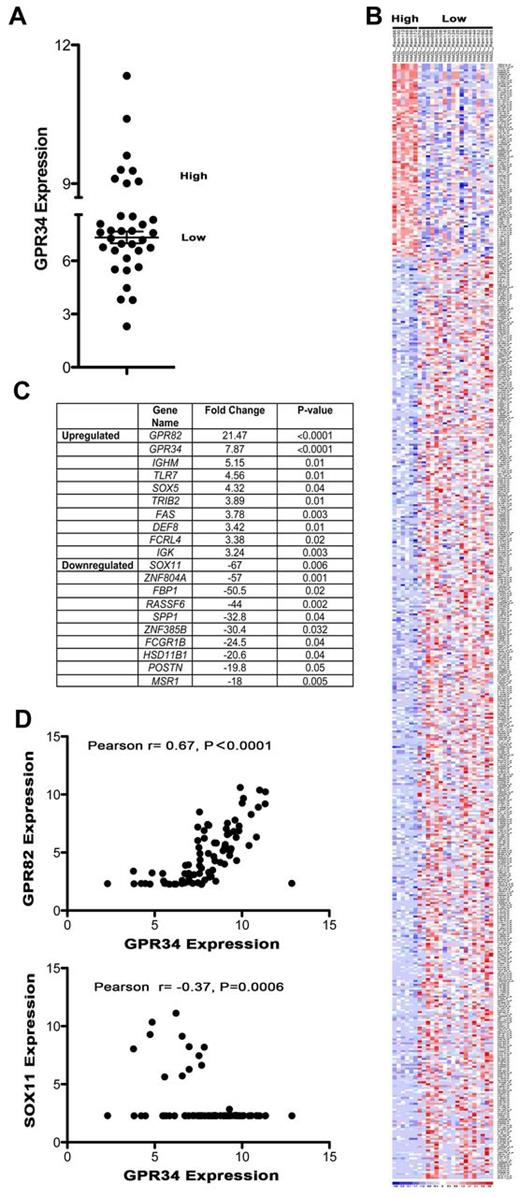
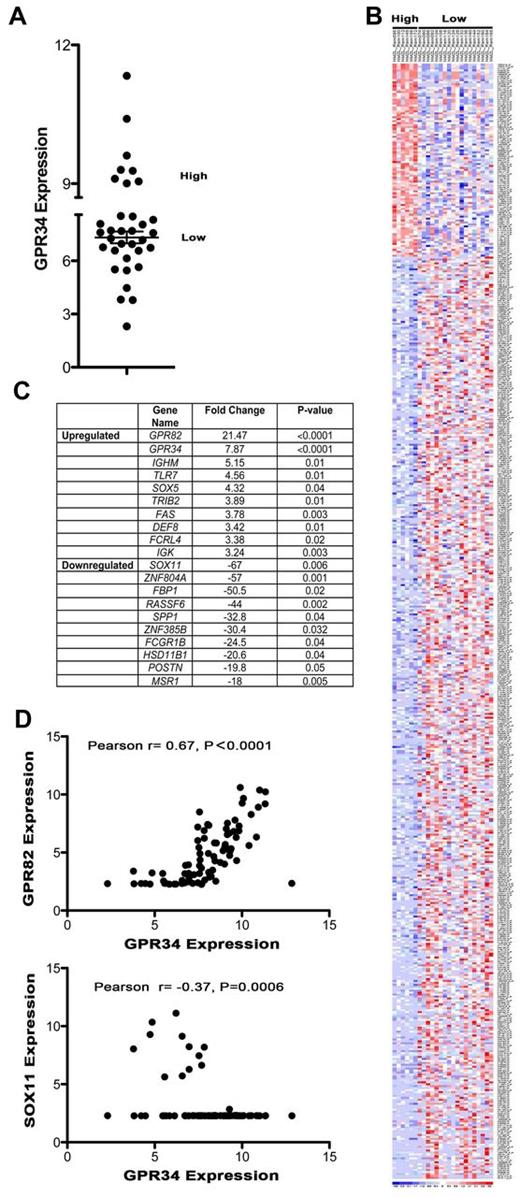
To gain insight on the impact of elevated GPR34 expression on global gene expression we grouped specimens by expression of GPR34 and looked for a unique molecular phenotype. The GEP of GPR34 high expressing NMZBL tumors was compared with GPR34 low expressing NMZBCL tumors (Figure 5A). A heatmap of all genes that had a greater than 2-fold difference between high and low GPR34 and a P value of less than .05 were plotted (Figure 5B). A clear molecular subtype of NMZBL could be identified and suggests that GPR34 high-expressing tumors have a unique GEP. The 10 most significantly up-regulated and down-regulated genes are shown in Figure 5C. The most significantly up-regulated gene in GPR34 high NMZBCL was GPR82 (P > .0001) and down-regulated was SOX11 (P = .006). These same genes were also significantly up and down-regulated in MALT lymphoma (GPR82; 8.1-fold, P > .0001, SOX11; −12.8-fold, P = .0009), and SMZBCL (GPR82; 8.9-fold, P = .0006, SOX11; −8.6-fold, P = .0421). When a combined analysis of all 3 subtypes of lymphoma was performed we found that high expression of GPR34 significantly correlated with high expression of GPR82 and negatively correlated with SOX11 expression (Figure 5D). We did note that GPR34 expression did not correlate with GPR82 in the t(X;14) case, suggesting multiple mechanisms of dysregulation.
High expression of GPR34 distinguishes a unique molecular subset of MZLs and correlates with GPR82 and SOX11 expression. (A) GEP data from NMZBL tumors (n = 34) was used to classify GPR34 high and low-expressing tumors. High is defined as those tumors that express GPR34 at levels greater than 2 standard deviations above the mean of the normal controls. (B) Heatmap of GPR34 high and low expressing NMZBCL tumors. (C) Table of 10 most up-regulated and down-regulated genes in GPR34 high tumors. (D) Correlation of GPR34 expression with GPR82 and SOX11 in MZL (n = 83).
High expression of GPR34 distinguishes a unique molecular subset of MZLs and correlates with GPR82 and SOX11 expression. (A) GEP data from NMZBL tumors (n = 34) was used to classify GPR34 high and low-expressing tumors. High is defined as those tumors that express GPR34 at levels greater than 2 standard deviations above the mean of the normal controls. (B) Heatmap of GPR34 high and low expressing NMZBCL tumors. (C) Table of 10 most up-regulated and down-regulated genes in GPR34 high tumors. (D) Correlation of GPR34 expression with GPR82 and SOX11 in MZL (n = 83).
Discussion
In summary, our data identify a novel IGH translocation target in MALT lymphoma and suggest that elevated expression of the GPR34 gene is a common occurrence in MZL. Although most well characterized MALT translocations drive NF-κB activation, GPR34 seems to predominantly mediate cell proliferation in a MAPK-dependent manner, suggesting that the NF-κB–independent pathways may also contribute to MZL lymphoma development. While this manuscript was in review, Baens et al published the identification of 4 additional cases of lymphoma, 2 MALT, 1 NMZBCL, and 1 gastric DLBCL, that carry (X;14)(p11.4;q32.33) further highlighting the potential significance of this translocation in NHL.8 When Baens et al analyzed the impact of GPR34 overexpression they did not detect ERK activation.8 However, in their model, overexpression of GPR34 was only measured by PCR and it is not yet clear whether the GPR34 protein was detected on the cell surface. In addition, there may be cell type-specific differences in the impact of GPR34 overexpression. Using 2 cell-line models, our work clearly indicates that GRP34 overexpression results in activation of ERK, and this work is supported by others.25 Regardless of the differences, the Baens et al work significantly adds to our analysis, and together, these 2 papers identify a novel pathway that may contribute to lymphoma cell growth. To date, no known translocations involving a GPCR have been identified in lymphoma; however, gene rearrangements in RAF kinase, a central GPCR signaling target, have recently been identified in melanoma, prostate, and gastric cancer.28 In addition, GPCRs play a significant role in regulation of cancer cell growth, angiogenesis, and metastasis (reviewed by Dorsam and Gutkind),29 but this is the first description of GPR34 contributing to tumor cell growth. Completion of the human and other vertebrate genome sequencing projects revealed more than 1000 genes belonging to the G-protein–coupled receptor (GPCR) superfamily and GPCRs make up the largest family of integral membrane proteins accounting for approximately 5% of all genes found in the human genome. Two-thirds of these genes are thought to encode odorant receptors, of the remaining one-third, the natural ligand for only one-half of the receptors has been identified, leaving approximately 160 so-called “orphan” GPCRs with unknown agonists.30 GPCR significantly contribute to human disease which is reflected by the fact that 50%-60% of all current therapeutic agents directly or indirectly target GPCR.31
GPR34 was originally identified through GenBank high-throughput genomic sequence database searches with previously known GRCR-encoding sequences.32,33 Human GPR34 consists of an 1143-bp open reading frame and the predicted mRNA has several copies of the “ATTTA” motif within the 3′-untranslated region suggesting a role as an immediate early gene and implicating a short intracellular half-life time.24 The predicted 381-amino-acid GPCR has a calculated relative molecular mass of approximately 44 kDa, potential N-glycosylation sites within the extracellular N-terminal region, consensus acceptor phosphorylation sites for protein kinase A and C, and potential receptor-specific kinase phosphorylation sites (multiple serine and threonine residues). The receptor encoded by GPR34 is most similar to the PY2 receptor subfamily of GPCR and it is evolutionarily conserved, being present in all vertebrate classes.23 The entire coding region of GPR34 is contained within one exon and expression of GPR34 mRNA is ubiquitous in human tissues.23,26 Quantitative real-time PCR studies have demonstrated that GPR34 mRNA transcripts are abundant in mast cells, whereas lower levels were detected in other immune cells including B cells and tissue from brain, placenta, spleen, thymus, and ovary.25 Mice deficient for GPR34 show no obvious phenotype, although it appears to be required for adequate immune responses to antigen and pathogen contact.34
Although the agonist of GPR34 is yet to be fully characterized, initial work by Sugo et al suggests that 1-palmitoyl-lyso-phosphatidylserine (P-lyso-PS) may be a GPR34 ligand.23 However, the specificity of P-lyso-PS for GPR34 has been challenged34 and until the endogenous GPR34 agonist is identified and antagonists are developed, what the GPR34 ligand is, remains an open question. There is also evidence suggesting that some orphan GPCR may not have a natural ligand, rather they signal through heterodimerization with other GPCRs (reviewed by Levoye et al).35 Furthermore, according to the current model of GPCR function, receptor overexpression alone can result in a constitutive activation of signaling pathways and many GPCRs have been characterized by overexpression in the absence of an agonist. It is also important to note that viral and bacterial derived proteins can act as GPCR agonists,36,37 this may be especially relevant in MALT lymphoma where some cases are driven by infection with H Pylori.9 One could hypothesize that GPR34 is specifically expressed in bacterial-driven tumors, although we did not see a correlation with H Pylori in our samples (data not shown). However, this does not rule out the possibility that the presence of other pathogens may bind to and activate GPR34.
Our finding that overexpression of GPR34 results in constitutive activation of the ERK pathway is in accordance with previous studies on GPR34.25 However, our studies also implicate a role for GPR34 in the activation of CREB, AP-1, PKC, and NF-κB (Figure 3). CREB and AP-1 are known ERK-pathway targets and their activation was inhibited in the presence a MEK inhibitor. A PKC/CARD11/Bcl10/MALT/NF-κB signaling cascade has been shown to exist downstream of GPCRs,10,38 and further supports our findings on the ability of GPR34 to activate PKC and NF-κB. Constitutive activation of these pathways contributes to GPR34-driven lymphoma cell proliferation (Figure 4); however, further studies will need to be done to specifically determine whether GPR34 overexpression contributes to lymphomagenesis.
High expression of GPR34 distinguished a unique molecular subset of MZL patients and correlated with high expression of GPR82 (Figure 5). Other than its original cloning, there are no reports characterizing GPR82 in the literature. GPR82 was originally identified through GenBank high-throughput genomic sequences database searches with GPR34 and the GPR82 PCR product encodes a 336 aa protein sharing identities in the transmembrane regions with GPR34 (31%), GPR17 (30%), and the somatostatin receptor SSTR2 (30%). The genes encoding GPR34 and GPR82 are located in close proximity on chromosome Xp11.4 with GPR34 located 27 kB upstream of GPR82. The close correlation in their expression suggests that mechanisms that drive expression of one gene may impact expression of the other. Based on our studies we hypothesize that there are multiple mechanisms that can drive GPR34 expression; juxtaposition of GPR34 with the IGH locus [t(X;14) case]; gene dosage effects (FISH studies showed an extra intact GPR34 signal, but no translocation involving IGH or GPR34); or epigenetic effects that mediated transcription at Xp11.4. GPR34 expression negatively correlated with SOX11, a gene whose expression is epigenetically regulated, being repressed on normal hematopoietic cells and activated in lymphoid neoplasms.39 SOX11 expression has been reported to be highly specific for mantle cell lymphoma40,41 ; however, our data suggest that a subset of MZL also express SOX11. The significance of SOX11 in MZL and its relationship to GPR34 is currently unknown and will need further investigation.
In addition to providing insight on the function of GPR34, these studies also have significant clinical relevance, most targeted therapy trials in B-cell lymphoma have focused on B-cell receptor signaling targets and the NF-κB pathway and our results now suggest that MAPK, deregulated by GPR34 overexpression, may be an alternative therapeutic target in a subset NHL. Although many therapies are effective in this disease, malignant cells commonly persist or recur posttreatment. A treatment that targets a biologic mechanism that accounts for the growth and survival of the malignant cells may result in improved and potentially durable clinical outcomes.
The online version of this article contains a data supplement.
The publication costs of this article were defrayed in part by page charge payment. Therefore, and solely to indicate this fact, this article is hereby marked “advertisement” in accordance with 18 USC section 1734.
Acknowledgments
The authors thank Angela Schulz and Torsten Shoenberg (University of Leipzig) for the GPR34 expression plasmids and technical support. They also thank Dan Billadeau (Mayo Clinic) for critical reading of the paper.
This work was supported in part by the National Institutes of Health (P50CA097274 to S.M.A., J.R.C., and A.J.N.), the International Waldenstrom's Macroglobulinemia Foundation (to S.M.A.), and the Lymphoma Research Foundation Follicular Lymphoma Research Grantee program (to A.J.N.).
National Institutes of Health
Authorship
Contribution: S.M.A. and A.J.N. designed and experiments, analyzed and interpreted the data, and drafted the paper; T.A., E.M., M.M., E.B., T.T., S.Z., F.S., M.G., and M.L. performed experiments and analyzed data; R.F., T.E.W., A.D., and J.R.C. collected data, provided patient specimens, and edited the paper; and M.J.D. provided valuable technical advice and edited the paper.
Conflict-of-interest disclosure: The authors declare no competing financial interests.
Correspondence: Anne J. Novak, Division of Hematology, Mayo Clinic, 200 1st St SW, Stabile 6-13, Rochester, MN 55905; e-mail: novak.anne@mayo.edu; or Stephen M. Ansell, Division of Hematology, Mayo Clinic, 200 1st St SW, Stabile 6-13, Rochester, MN 55905; e-mail: ansell.stephen@mayo.edu.
References
Author notes
S.M.A. and A.J.N. contributed equally as senior authors.

