Abstract
Abstract 2860
Expansion of EBs is observed when cells from ND are cultured with the glucocorticoid receptor α(GRα) agonist dexamethasone (DXM). In addition, EBs can be cultured from patients with PV, a disease characterized by erythrocytosis, in the presence (+) or absence (−) of DXM (Varricchio et al. Blood. 2011;118:425). In cultures of ND, DXM induces expansion by inducing EBs into a reversible self-replication state and attenuating STAT5 activation mediated by the erythropoietin receptor (EPO-R). In cultures of PV, EB expansion is due to acquisition of a constitutive self-replication state characterized by expression of a dominant negative GRβ isoform which can attenuate EPO-R signalling in a DXM-independent manner. The homogeneity in morphology and biological properties of EBs generated by ND in cultures + DXM and by PV patients in cultures +/− DXM suggests that comparisons between the transcriptosome and phosphoproteosome of these different isolates may allow identification of mechanisms which induce PV EBs constitutively into self-replication or that mediate effects of GRα not inhibited by GRβ.
We performed microarray analyses of EBs obtained in vitro from 5 ND + DXM and from 3 PV (all JAK2 V617F positive) + and - DXM. ANOVA analyses between ND + DXM vs. PV - DXM identified 55 differentially expressed genes (FDR<0.05). Notably, the majority of these genes is linked to lipid metabolism and likely represents GRβ-indipendent effects of GRα. ANOVA analyses of ND + DXM vs. PV + DXM did not reveal significant differences in gene expression, confirming previous studies of specific targets by quantitative RT-PCR which indicated the similar expression profile of the 2 populations. Supervised analysis of a subset of genes found to be differentially expressed in human EBs (Nandi et al, Blood 2011:117:96) revealed no significantly differentially expressed genes between PV + DXM and PV – DXM (paired t-test) and between PV + DXM and ND + DXM (ANOVA). We identified only 3 genes (CA1, CA2 and UBE3C) in this signature which were differentially expressed between PV – DXM and ND.
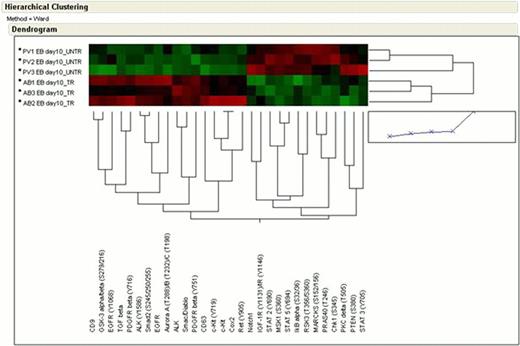
We obtained phosphoproteomic profile of EBs obtained in vitro from 3 ND + DXM and from 3 PV (all JAK2 V617F positive) +/− DXM using a Reverse-phase Protein MicroArray including 170 validated antibodies against signaling proteins representative of pathways controlling proliferation/survival/migration/adhesion. Unsupervised hierarchical clustering and non-parametric statistical analysis were used to compare the activation status of a first set of 120 signaling proteins.
PV EBs + DXM vs AB EBs. This comparison revealed increased activation of RTKs in PV + DXM samples, including activation of STAT3 and PDGFRβ, which are activated in both contexts but to a greater degree in PV EBs. Of interest, in the case of ND EBs, STAT3 is activated at position S727 in concordance with the activation on ATF-2 and Smad1/5/8 observed in the same cells. By contrast, PV + DXM showed activation of a broader spectrum of RTKs and downstream signaling effectors, consistent with the presence of the JAK2 V617F allele.
PV EBs + DXM vs AB EBs. This comparison revealed increased activation of RTKs in PV + DXM samples, including activation of STAT3 and PDGFRβ, which are activated in both contexts but to a greater degree in PV EBs. Of interest, in the case of ND EBs, STAT3 is activated at position S727 in concordance with the activation on ATF-2 and Smad1/5/8 observed in the same cells. By contrast, PV + DXM showed activation of a broader spectrum of RTKs and downstream signaling effectors, consistent with the presence of the JAK2 V617F allele.
PV EBs – DXM vs PV EBs + DXM. This comparison revealed increased activation of RTKs (KIT, EGFR, ErbB2, VEGFR, PDGFR and Met) and of the SAPK/JNK pathway in PV + DXM while PV– DXM were characterized by increased activation of Raf/MSK1/RSK3 and STAT3 and STAT5.
PV EBs – DXM vs PV EBs + DXM. This comparison revealed increased activation of RTKs (KIT, EGFR, ErbB2, VEGFR, PDGFR and Met) and of the SAPK/JNK pathway in PV + DXM while PV– DXM were characterized by increased activation of Raf/MSK1/RSK3 and STAT3 and STAT5.
PV EBs - DXM vs AB EBs. This comparison revealed activation of a subset of RTKs in ND cells, including KIT/CD63 and PDGFRβ. By contrast, PV - DXM were characterized by increased activation of a broader set of signaling pathways, including RSK3/MSK1 signaling, STAT2, STAT3 and STAT5.
PV EBs - DXM vs AB EBs. This comparison revealed activation of a subset of RTKs in ND cells, including KIT/CD63 and PDGFRβ. By contrast, PV - DXM were characterized by increased activation of a broader set of signaling pathways, including RSK3/MSK1 signaling, STAT2, STAT3 and STAT5.
In conclusion, the gene expression profile of EBs from PV and ND largely overlap, with the exception of a subset of genes important in metabolic and signaling pathways while phosphoproteomic analysis reveals important differences in cell signaling between PV and ND EBs. We suggest that integrated gene expression and proteomic analyses may reveal differential networks which govern normal and malignant erythroid expansion.
Tafuri:Sigma Tau Pharmaceuticals: Research Funding.
Author notes
Asterisk with author names denotes non-ASH members.


