Abstract
Abstract  422
422
The IPSS published in 1997, based on cytogenetics, marrow blast % and the number of cytopenias, has played a major role in prognosis assessment in MDS. A provisional revised IPSS had been presented in 2011, which in our experience brought limited additional prognostic value for outcome of AZA treatment (Lamarque, ASH 2011). A final IPSS-R has now been published (Greenberg, Blood 2012), using the same parameters but 5 rather than 3 cytogenetic subgroups (Schanz et al, JCO, 2011), new cut off values for cytopenias and bone marrow blast % and different weighing of parameters. It appears to refine IPSS prognostic value but, like the original IPSS, was established in pts who had received no disease modifying drugs. We assessed the prognostic value of IPSS-R in 264 higher risk MDS treated with AZA, a drug with a survival impact in those pts.
Between Sept 2004 and Jan 2009, before drug approval in EU, we enrolled 282 IPSS high and int 2 (higher) risk MDS in a compassionate patient named program of AZA and established in this cohort a prognostic scoring system (“AZA predictive score” based on Performance status (PS), cytogenetics, presence of circulating blasts, and RBC transfusion dependency) (Itzykson, Blood, 2011). We took advantage of this cohort to evaluate the prognostic impact of IPSS-R in higher risk MDS treated with AZA.
Median age was 71 years. WHO diagnosis: 4% RA, RARS or RCMD, 20% RAEB-1, 54%RAEB-2, 22% RAEB-t/AML. Cytogenetics could be reclassified using IPSS-R cytogenetic groups (Shanz, JCO 2011) in 265 pts, in: 1% very good, 37% good, 18% int, 12% poor and 32% very poor. 18%, 48% and 34% pts had Hb<8g/dl, between 8 and 10 and >10 g/dl, respectively. 43%, 32% and 25% had baseline platelet count <50 G/l between 50–100 and >100 G/L, respectively. ANC was <0.8 G/l in 45% pts. Marrow blast % was <=2%, 3–5%, 5–10%, >10 % in 2%, 3%, 18% and 77% pts. Overall IPSS-R could be calculated in 259 patients and was low (1 pt), Intermediate (28 pts, 11%), high (87 pt, 34%) and very high (143 pt, 55% pts). The only pt in the low group was excluded from further analysis.
Using the “classical” IPSS, high and Int-2 patients treated with AZA had significantly different Response (37% vs 49%, p=0.05) and OS (median 9.4 vs 16 mo, respectively, p=0.004).
Using the IPSS-R, 46%, 47% and 39% responded (CR, PR, or Hematological improvement- HI) to AZA in the int, poor and very poor groups, respectively (p=0.463). Individual IPSS-R parameters, including IPSS-R cytogenetic classification (p= 0.646), Hb level (p= 0.948), platelet count (p=0.10), ANC (p= 0.465) and marrow blast % stratified according to R-IPSS (p=0.287) had no significant impact on AZA response.
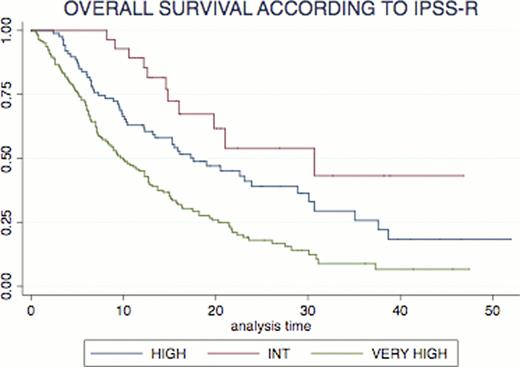
According to IPSS-R cytogenetic classification, median OS was 21.8 mo, 12.3 mo, 15.1 mo and 7.1 mo in the good, int, poor and very poor risk groups respectively (overall p <10−4). Finally, According to IPSS-R, median OS was 30.7 mo, 17.6 mo, and 10 mo in the Intermediate, High and Very High risk groups, respectively (p <10−4, figure 1). I.
The 55% patients with very high risk according to IPSS-R could be further subdivided by our AZA scoring system (Itzykson et al, Blood, 2011) in 3%, 67% and 30% low, int or high risk with a significant different OS across those groups (median not reached (NR), 12.7 and 5.9 mo, p <10−4). Similarly, The 34% patients with high risk according to IPSS-R could be further subdivided by the same AZA scoring system in 6%, 80% and 14% low, int or high risk with a significant different OS across those groups (median NR, 17.3 and 6.1 mo, p <10−4).
Contrary to the provisional IPSS-R presented in 2011, the final IPSS-R (Greenberg, Blood 2012) has strong prognostic value for survival in MDS pts treated with AZA.Its prognosic value can be further improved by specific scoring systems established for AZA treatment, like the one published by our group (Itzykson, Blood, 2011).
No relevant conflicts of interest to declare.
Author notes
Asterisk with author names denotes non-ASH members.

This icon denotes a clinically relevant abstract


