Abstract
Despite potential clinical importance, target cells for mother-to-child transmission of HIV-1 have not yet been identified. Cord blood–derived CD4+ T cells are largely naive and do not express CCR5, the mandatory coreceptor for transmitted HIV-1 R5 strains in infants. In the present study, we demonstrate that in the human fetal and infant gut mucosa, there is already a large subset of mucosal memory CD4+CCR5+ T cells with predominantly a Th1 and Th17 phenotype. Using next-generation sequencing of the TCRβ chain, clonally expanded T cells as a hallmark for memory development predominated in the gut mucosa (30%), whereas few were found in the lymph nodes (1%) and none in cord blood (0%). The gut mucosal fetal and infant CD4+ T cells were highly susceptible to HIV-1 without any prestimulation; pol proviral DNA levels were similar to infected phytohemagglutinin-stimulated adult PBMCs. In conclusion, in the present study, we show that extensive adaptive immunity is present before birth and the gut mucosa is the preferential site for memory CD4+ T cells. These CD4+CCR5+ T cells in the infant mucosa provide a large pool of susceptible cells for ingested HIV-1 at birth and during breastfeeding, indicating a mucosal route of mother-to-child transmission that can be targeted in prevention strategies.
Introduction
More than 300 000 children are infected annually with HIV-1 as a consequence of mother-to-child transmission (MTCT).1 Combination antiretroviral therapy (cART) during pregnancy succeeds in reducing the risk of MTCT from 30% to < 1%.1,2 However, exposure to cART in utero and postnatally can have long-term adverse effects in these HIV-1–exposed, uninfected children.3-7 A better understanding of MTCT is crucial for the development of targeted and safe prevention strategies. However, the actual mechanism of MTCT remains unclear.
HIV-1 strains transmitted from mother to child are predominantly R5 strains, which require CCR5 as a coreceptor to infect CD4+ T cells.8 This corresponds to the protective effect of the CCR5 Δ32 base pair genotype in MTCT of HIV-1.9 Previous data and our present findings show that CD4+CCR5+ T cells are not present in cord blood.10,11 In accordance with this observation, studies in vitro show that isolated CD4+ T cells from cord blood need to be activated before infection with HIV-1.12 These findings suggest that the immune system of the infant is naive, an idea that is supported by the general principle that substantial Ag-induced memory development is initiated after birth.13,14 Nevertheless, memory Treg cells are found in the lymph nodes in infants.15 However, this apparently does not result in CD4+CCR5+ T cells in cord blood, leaving unanswered the question of what are the target cells for MTCT of HIV-1.
In the present study, we demonstrate that the CD4+CCR5+ T cells are preferentially located in the infant gut mucosa. CD4+ T cells in the gut epithelium had distinct features of memory cells, such as high HLA-DR and CD45RO expression, as well as Th cell subset differentiation. The infant gut mucosal CD4+CCR5+ T cells were highly susceptible to HIV-1 infection without prior activation with cytokines, and therefore could act as prime targets for HIV-1 transmission in infants.
Methods
Subjects
The first series of immunohistochemical stainings (see “Immunohistochemistry”) were performed on small intestinal tissue, mesenteric lymph nodes, and spleens of 4 neonates who had died during delivery or within 24 hours after birth (Table 1). Autopsy was performed within 24 hours of death. All patients were of white descent. Three patients were born prematurely. None of the neonates had received enteral feeding before death.
The subsequent series were performed on neonatal tissues obtained at autopsy from patients 5-7 or obtained fresh during reconstructive surgery for small intestinal obstruction from patients 8-11 (Table 1). None of the patients showed signs of infection or immunodeficiency. We performed studies with medical ethical committee approval from our institute, the Academic Medical Centre (University of Amsterdam, Amsterdam, The Netherlands), and obtained informed consent from the parents in accordance with the Declaration of Helsinki.
For studies of CD4+ T cells derived from cord blood, we included 4 uninfected HIV-1–exposed patients. The HIV-1–exposed patients were born to HIV-1–infected mothers who had started cART at 20 weeks of gestational age and had a viral load of less than 50 copies at delivery.
Tissue sampling and cell isolation
PBMCs and cord blood mononuclear cells were isolated using Ficoll gradients. After autopsy or surgery, the gut mucosal and submucosal layers were removed from the muscular layer. The gut tissue was cut into 5-mm2 fragments and then incubated with DTT to remove mucus and then with EDTA to obtain epithelial cells. To isolate the subepithelial mononuclear cells, we used a mechanical single-cell isolation method, the BD Medimachine System (BD Biosciences). This is an automated, mechanical disaggregation system of solid human tissues without enzymes. The tissue is placed into the Medicon filter with 1 mL of PBS. The Medimachine spins the tissue in the Medicon filter, disaggregating the tissue into small fragments and single cells. A syringe placed on the outport of the Medimachine aspirates the single cells in PBS through a single-cell filter. This procedure is repeated until the tissue has dissolved completely. Percoll gradients were used to obtain the PBMC fractions as single-cell suspensions. A single-cell suspension was obtained from lymph nodes and spleen using the Falcon cell strainer (BD Biosciences), a single-cell filter, followed by Ficoll gradient isolation.
Immunohistochemistry
Sections (5 μm) from formalin-fixed and paraffin-embedded tissue were deparaffinized in xylene, rehydrated in an alcohol series, and treated with 0.3% H2O2 in methanol to block endogenous peroxidase activity. Heat-induced Ag retrieval was performed for 20 minutes in Tris-EDTA (pH 9.0) at 98°C. Ultra V Block (Immunologic) was used to block nonspecific binding sites. Primary Ab labeling was performed with anti-CCR5 mAb (kindly provided by M. Mack, Regensburg, Germany), followed by secondary labeling with an anti–mouse IgG alkaline phosphatase (AP) polymer (Immunologic). AP activity was visualized with the VectorBlue AP Substrate Kit (Vector Laboratories). Removal of CCR5 and AP polymer was achieved by a heating step in EDTA (pH 8.0) at 98°C, leaving the blue staining untouched. This was followed by Ultra V Block, incubation with CD45RO (UCHL1 mouse IgG2a; Dako), and CD4 (4B12 mouse IgG1; ThermoFisher) and secondary labeling with AP-conjugated goat anti–mouse IgG2a and HRP-conjugated goat anti–mouse IgG1 (SBA). AP and HRP activity were visualized with VectorRED AP Substrate Kit (Vector Laboratories) and Bright DAB (Immunologic), respectively.
The second Ab panel consisted of CCR5, followed by CD68 (PG-M1 mouse; Dako) and CD3 (SP7 rabbit; Thermo Fisher). Secondary labeling for both Ab panels involved a cocktail of anti–mouse IgG AP polymer and anti–rabbit IgG HRP polymer. AP and HRP activities were visualized with Vector Red and Bright DAB. Staining for HLA-DR (CR3/43; Dako) was performed with detection anti–mouse IgG AP polymer and Vector Red. Removal of HLA-DR and AP polymer was achieved by a 10-minute heating step in EDTA (pH 8.0) at 98°C, leaving the red dye untouched. The second Ab labeling involved CD45RO according to the same protocol as in the triple staining with CD4 and CCR5 (see previous paragraph) and visualized with Vector Red.
Quantification of colocalization of staining of the lymphocyte subsets of interest was performed by spectral imaging, as described previously.16 This technique detects different wavelengths from a particular area to identify the single-, double-, and triple-stained cells. Random digital images (1-4 per section) per tissue were taken at moderate magnification (200×) with a Leica microscope (Leica Microsystems). Nuance Version 2.9 software (Cambridge Research Instrumentation) was used to separate and identify the spectra in the images and identify colocalization of CD4 and CCR5. Observer agreement about signal colocalizations was checked for all images. After spectral unmixing, the images are presented fluorescent like in pseudocolors showing dual-Ab combinations within the immunohistochemical triple-staining combination.
CD4+ Th cell subsets were identified, using Abs against RORγt, FoxP3 (Abcam), T-bet, and Gata-3 (Santa Cruz Biotechnology). Sections were then incubated with anti–mouse (FoxP3 and Gata-3) or anti–rabbit (T-bet and RORγt) IgG AP polymer (Immunologic) and visualized with VectorBlue. CD45RO (Thermo Fisher) was incubated with IgG1-HRP and visualized with Vector Nova Red. Images were obtained with the Leica microscope (Leica Microsystems) at moderate magnification (200×). Because of the absence of colocalization of a membrane (CD45RO) with nuclear markers (RORγt, FoxP3, T-bet, and Gata-3), colocalization could not be determined by spectral imaging. The percentages of double-positive cells showing cell coexpression of CD45RO and a nuclear marker were assessed by conventional observation of the images by the pathologist.
Gut tissue from the tissue HIV-1 infection study was analyzed for detection of HIV-1 using mouse-a-p24 (Dako). Sections were then incubated with anti–mouse IgG AP polymer (Immunologic) and visualized with the VectorBlue AP Substrate Kit. CD45RO (Thermo Fisher) to detect memory T cells was incubated with IgG-HRP polymer and visualized with Vector Nova Red. Images were obtained with the Leica microscope (Leica Microsystems) at moderate magnification (200×).
Flow cytometry
After staining with fluorochrome-conjugated CD3, CD4, CCR5, CCR6, and CD45RO cells (BD Biosciences), the expression of surface markers on single cells from tissue or blood was analyzed with a FACSCanto flow cytometer (BD Biosciences). Data were analyzed with FlowJo Version 7.6.4 software (TreeStar).
HIV-1 infection assay of isolated cells
Isolated cells from gut mucosa or blood were inoculated with YU2 (R5-strain) at a multiplicity of infection of 1 for 12 hours at 37°C. After removal of virus, the cells were cultured for 3 days in IMDM, supplemented with 10% heat-inactivated FBS, 50 U/mL of penicillin, 50 mg/mL of streptomycin, and 100 IU/mL of IL-2. The CD4+ cells were then isolated using Macs beads (Miltenyi Biotec) and analyzed for pol proviral DNA. The cord blood cells were inoculated directly after isolation or after initial stimulation for 4 days with 100 IU/mL of IL-2. We used adult CD4+ T cells from blood, which were activated with phytohemagglutinin (PHA) for 3 days before infection, as a positive control.
HIV-1 infection assay of whole gut tissue
The mucosal layer was obtained as described in “Tissue sampling” and placed in a culture dish with culture medium and IMDM supplemented with 10% heat-inactivated FBS, 50 U/mL of penicillin, 50 mg/mL of streptomycin, and 100 IU/mL of IL-2. HIV-1 (YU2)–containing medium with 10 000 tissue culture infections dose was loaded on the apical side. The tissue was incubated for 12 hours, washed with IMDM, and left in the culture medium above for 3 additional days. The tissues were fixed in formalin and then embedded in paraffin for immunohistochemical staining.
Detection of HIV-1 proviral DNA
Total DNA was isolated from CD4+ cells using the QIAamp DNA Blood kit (QIAGEN). The amount of HIV-1 pol proviral DNA in the samples was determined by quantitative PCR for the HIV-1 pol region with pol-B-02 5′-CTTCTAAATGTGTACAATCTAGTTGCC-3′ and pol-E-03 5′-TGATTTTAACCTGCCACCTGTAGTAG-3′ in conjunction with a labeled probe pol-P (FAM)- CTGTGATAAATGTCAGCTAAAAGGAGAAGCCA-(TAMRA)-3′. A standard curve was prepared from the cell line 8E5, which contained one copy of HIV-1 DNA per cell. The reaction mixture contained 20mM Tris-HCl (pH 8.4), 50mM KCl, 3mM MgCl2, 200μM dNTP, 250 μg/mL of BSA, 500nM primers, 250nM probe, and 1.2 U of platinum Taq DNA polymerase (Invitrogen). Real-time PCR was performed using the following program on the LightCycler (Roche): (1) preincubation and denaturation at 50°C for 2 minutes, 95°C for 2 minutes; (2) amplification and quantification at 45 cycles of 95°C for 5 seconds, 60°C for 30 seconds. To correct for differences in the DNA input, β-actin concentrations were analyzed by SYBR green quantitative PCR. The primers for β-actin used were: B-actin-S 5′-GGGTCAGAAGGATTCCTATG-3′ and B-actin-AS 5′-GGTCTCAAACATGATCTGGG-3′. Specificity of the PCR products measured using the SYBR Green method was confirmed by a melting curve. Real-time PCR was performed using the following program on the LightCycler (Roche): (1) preincubation and denaturation at 50°C for 2 minutes, 95°C for 2 minutes; (2) amplification and quantification at 45 cycles of 95°C for 5 seconds, 55°C for 15 seconds, 72°C for 15 seconds; (3) melting curve at 95°C for 0 seconds, 65°C for 15 minutes, 95°C for 0 seconds with a temperature transition rate of 0.1°C/s.
Next-generation sequencing for high-resolution screening of the TCRβ-chain repertoire of clonal T cells
T cells from various tissues from patient 7, intestinal tissue and blood from patient 11, and adult PBMCs were isolated by positive selection using Macs beads (Miltenyi Biotec). Total RNA was extracted using the RNeasy Mini System (Invitrogen). cDNA was synthesized from RNA using SuperScript III-RT (Invitrogen). Preparation of the samples for sequencing was performed as described previously,17 with one modification in the linear amplification procedure: after the first round of (full repertoire) linear amplification, a generic PCR was used to amplify the TCR products for sequencing. In this step, primer B was used as a generic forward primer and a generic primer specific for the TCRβ-constant gene segment (5′-CTCAAACACAGCGACCTC-3′) was used as a reverse primer. The reverse primer contained a multiplex identifier and primer A as described in the amplicon sequencing manual (Roche). PCR was performed with 50% of the purified linear amplification product in the presence of 10 pmol of each of the primers, 1× buffer B, 1mM MgCl2, 0.1mM dNTPs, and 3 U of Hotfire (Solis Biodyne) in a volume of 40 μL (96°C for 900 seconds, 35 × 96°C for 30 seconds, 60°C for 60 seconds, 72°C for 60 seconds, and 72°C for 600 seconds). Samples were sequenced on an FLX genome sequencer (Roche Diagnostics) using the Titanium system according to the manufacturer's protocol. The samples were adjusted for cell input. The customized bioinformatics pipeline used to obtain the TCR sequence was described previously in detail17 and contained 4 modules: (1) Multiplex Indentifier (MID) sorting, (2) identification of gene segments, (3) CDR3 detection, and (4) removal of artifacts. This procedure provided the relative frequency of individual clones. Samples were adjusted for cell input. To identify expanded clones, we based our cutoff on the largest clone present in the thymus, because only few memory cells are reportedly present in thymus.18 The largest clone in the thymus had a relative contribution to the local T-cell population of 0.14%. Therefore, a T-cell clone contributing > 0.14% to the T-cell population of the specific compartment was considered to be an expanded clone. This is probably an underestimate, because it is likely that a few expanded T-cell clones are present in the thymus. To validate this cutoff further, we also applied it to our control sample, adult PBMCs, and 0.14% also nicely identified expanded clones. The results from this adult sample were similar to published data.17 Taking into account these 2 observations and the conservative approach we applied, a cutoff of 0.14% best indicated an expanded T-cell clone and simultaneously allowed for comparison of tissues and patients.
Statistical analysis
Prism Version 5 software (GraphPad) was used to design the graphs and to perform statistical analyses. In the graphs and text, means ± SEM are shown and a double-sided Student t test was used for statistical comparison. P < .05 was considered statistically significant.
Results
CD4+CCR5+ T cells reside in the fetal and infant gut mucosa
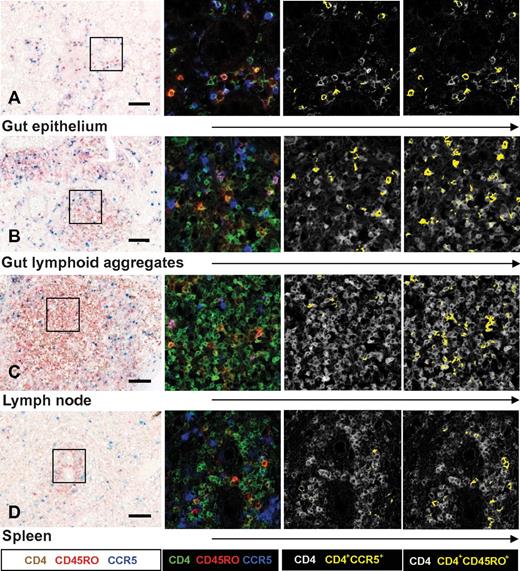
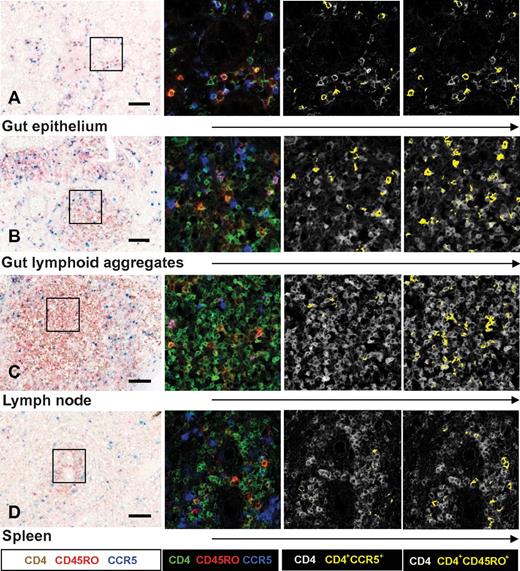
Tissues obtained from human fetuses at autopsy and newborn infants who had died within 24 hours of birth were collected (Table 1). These infants showed no signs of infection and had not received enteral feeding. The phenotype of the CD4+ T cells was assessed by immunohistochemical triple stainings with CD4, CCR5, and CD45RO cells. Spectral imaging on paraffin sections allowed for visualization and quantification of colocalized immunohistochemical signals in intact tissues.16 Individual CD4+ T cells were located in the mucosa of the small intestine between and just underneath the enterocytes (Figure 1A). The gut mucosa of these fetuses and infants contained a large proportion of the intra-epithelial CD4+CCR5+ T cells (29.6% ± 5.4%; Figure 2A). Moreover, we observed lymphoid aggregates of CD4+ T cells in gut submucosa, of which 17.3% ± 2.5% also expressed CCR5 (Figure 1B and Figure 2A). Lymphoid aggregates containing CD4+ T cells were also observed in mesenteric lymph nodes (Figure 1C), whereas in the spleen, CD4+ T cells were relatively few and surrounded the central arterioles. Only small numbers of CD4+CCR5+ T cells were detected in the spleen and mesenteric lymph nodes (Figure 2A). A similar pattern was observed for CD45RO expression on CD4+ T cells, with the highest frequencies observed in the gut mucosa and submucosa (Figures 1 and 2B). Triple stainings for CCR5, CD3, and CD68 confirmed that the CD4+CCR5+ mononuclear cells were of T-cell (CD3+) and not of macrophage or lymphoid tissue inducer cell origin (supplemental Figure 1).19 HLA–class II (HLA-DR), which is induced upon T-cell activation, was specifically expressed by CD45RO+ cells in the gut mucosa (supplemental Figure 2). In confirmation, single-cell suspensions were analyzed and mucosa CD4+ T cells expressed high levels of both CCR5 and CD45RO (supplemental Figure 3A). The CD3+ T-cell population in the infant gut mucosa consisted largely of CD4+ T cells and less so of CD8+ T cells (CD4/CD8 ratio = 1.9).
Expression of CD4, CCR5, and CD45RO cells in neonatal tissue determined by triple immunohistochemical staining for CD4, CCR5, and CD45RO visualized with spectral imaging and at higher magnification. The first column shows immunohistochemistry light microscopy. The following columns show the same cubes analyzed with Nuance software for spectral imaging. These analyses indicated more CD4+CCR5+ and CD4+CD45RO+ T cells (yellow) in the gut epithelium (A) and gut lymphoid aggregates (B) of newborn infants than in lymph nodes (C) or spleen (D). Scale bar indicates 0.1 mm. Data are representative of patients 1-10 included in our study.
Expression of CD4, CCR5, and CD45RO cells in neonatal tissue determined by triple immunohistochemical staining for CD4, CCR5, and CD45RO visualized with spectral imaging and at higher magnification. The first column shows immunohistochemistry light microscopy. The following columns show the same cubes analyzed with Nuance software for spectral imaging. These analyses indicated more CD4+CCR5+ and CD4+CD45RO+ T cells (yellow) in the gut epithelium (A) and gut lymphoid aggregates (B) of newborn infants than in lymph nodes (C) or spleen (D). Scale bar indicates 0.1 mm. Data are representative of patients 1-10 included in our study.
Quantification of CD4+CCR5+ cells, CD4+CD45RO+ cells, and CD4+CD45RO+CCR5+ cells in neonatal tissue and cord blood. Data are derived from spectral imaging analyses of triple immunohistochemical stainings and flow cytometry. The graphs show mean percentages ± SEM of CD4+CCR5+ (A), CD4+CD45RO+ (B), and CD4+CD45RO+CCR5+ (C) cells. Percentages of CCR5+, CD45RO, and triple-positive CD4+ T cells in various tissues all differed significantly from those of CD4+ T cells in cord blood (P < .001 by Student t test). CD4+ T cells from gut epithelium and gut lymphoid aggregates (LA) expressed significantly more CCR5 and CD45RO than CD4+ T cells derived from lymph nodes (P < .01 and P = .05, respectively).
Quantification of CD4+CCR5+ cells, CD4+CD45RO+ cells, and CD4+CD45RO+CCR5+ cells in neonatal tissue and cord blood. Data are derived from spectral imaging analyses of triple immunohistochemical stainings and flow cytometry. The graphs show mean percentages ± SEM of CD4+CCR5+ (A), CD4+CD45RO+ (B), and CD4+CD45RO+CCR5+ (C) cells. Percentages of CCR5+, CD45RO, and triple-positive CD4+ T cells in various tissues all differed significantly from those of CD4+ T cells in cord blood (P < .001 by Student t test). CD4+ T cells from gut epithelium and gut lymphoid aggregates (LA) expressed significantly more CCR5 and CD45RO than CD4+ T cells derived from lymph nodes (P < .01 and P = .05, respectively).
Tissue-dependent distribution of Th cell subsets in the fetus and newborn infant
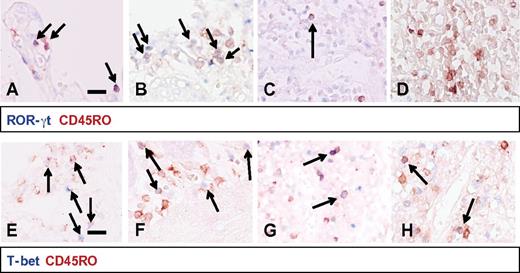
We further analyzed the memory-like phenotype of the CD4+CCR5+ T cells within the human fetal and infant gut mucosa and submucosa and the other tissues, because the phenotype was markedly different from the naive T cells found in cord blood. We characterized 4 main functional CD4+ Th cell subsets by measuring prototypic transcription factors: T-bet for Th1, Gata-3 for Th2, RORγt for Th17, and FoxP3 for Tregs in combination with the memory T-cell marker CD45RO.20,21 RORγt coexpression was detected in approximately 50% of the CD45RO+ intestinal T cells (Figure 3A-B). The remaining CD45RO+ T cells expressed either T-bet (35%; Figure 3D and E) or FoxP3 (15%; data not shown), whereas the level of Gata-3 was low in the gut (< 5%). In the spleen, T-bet expression predominated and RORγt was virtually absent (Figure 3D and F). Consistent with these data, analyses with flow cytometry of single-cell suspensions showed that a large proportion of the CD4+CCR5+ T cells in the gut mucosa coexpressed CCR6 (supplemental Figure 4C). This chemokine receptor is predominantly expressed by Th17 cells, verifying the early presence of CD45RO+RORγt+ Th17 cells in the infant gut.22 The phenotype of the Th17, CD4+CCR5+CCR6+ T cells in the infant gut mucosa, suggests highly susceptible qualities for HIV-1 infection.23,24
Th cell subsets in neonatal tissues. In the top panels (A-D), RORγt+ (blue) and CD45RO+ (red) double-positive cells were detected in large numbers in the gut epithelium (A) and gut lymphoid aggregates (B). RORγt+CD45RO+ cells were virtually absent in lymph nodes (C) and undetectable in the spleen (D). In gut epithelium (E), T-bet+CD45RO+ cells made up approximately 35% of the CD45RO+ cells and these cells were also present to a lesser extent in the gut lymphoid aggregates (F) and nearly absent in the lymph nodes (G). In the spleen (H), T-bet+CD45RO+ cells represented the largest CD45RO+ T-cell subset. These panels are representative of patients 1-10 included in our study. Scale bar indicates 0.1 mm.
Th cell subsets in neonatal tissues. In the top panels (A-D), RORγt+ (blue) and CD45RO+ (red) double-positive cells were detected in large numbers in the gut epithelium (A) and gut lymphoid aggregates (B). RORγt+CD45RO+ cells were virtually absent in lymph nodes (C) and undetectable in the spleen (D). In gut epithelium (E), T-bet+CD45RO+ cells made up approximately 35% of the CD45RO+ cells and these cells were also present to a lesser extent in the gut lymphoid aggregates (F) and nearly absent in the lymph nodes (G). In the spleen (H), T-bet+CD45RO+ cells represented the largest CD45RO+ T-cell subset. These panels are representative of patients 1-10 included in our study. Scale bar indicates 0.1 mm.
The infant gut is the principal site for clonally expanded T cells
The identification of differentiated memory CD4+ T cells in the gut evoked the question of whether these populations showed signs of Ag-induced activation with clonal expansion as a hallmark. Next-generation sequencing of the TCRβ-chain repertoire was used to quantify clonal size and obtain sequence information on the infant clonal T cells.17 This analysis was performed on CD3+ T cells derived from tissues of patient 7 and from both gut and blood from patient 11. A cutoff based on a relative contribution of a T-cell clone of > 0.14% to the total T-cell population was used to identify expanded clones and allowed for comparison of tissues and patients. This cutoff was based on the largest clone present in the thymus because only few memory cells are present there.18
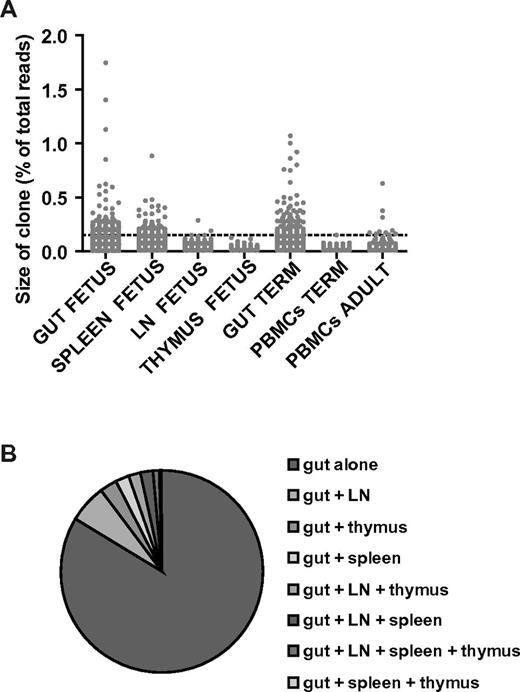
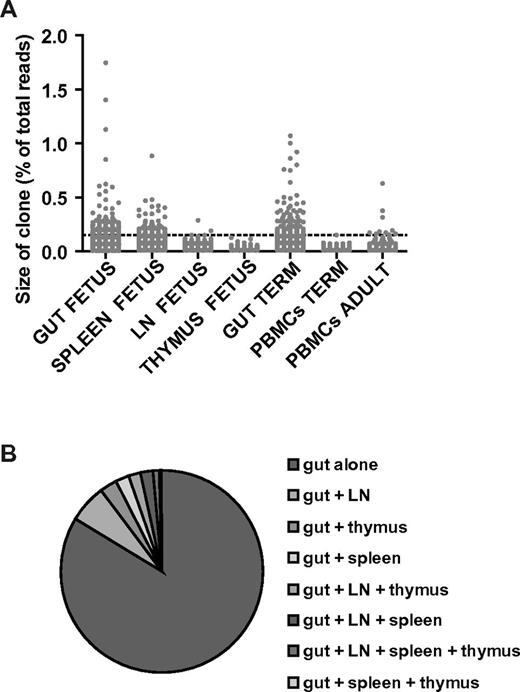
In patient 7, 30% of the T-cell repertoire in the gut consisted of expanded clones, 1% in the mesenteric lymph node and 17.9% in the spleen, which identified the gut as the principal site for expanded T-cell clones (Figure 4A). Remarkably, there were more expanded T-cell clones in the fetal gut than in the adult peripheral blood sample, which was comparable to published data on the adult T-cell repertoire of peripheral blood T cells.17 Only 10% of the T-cell clones detected in the fetal gut could also be identified in mesenteric lymph nodes and 5% in the spleen, illustrating compartmentalization of the T-cell clones (Figure 4B). Similar results were obtained in the analyses of the term patient 11, with 28% of the T-cell repertoire originating from expanded T-cell clones (Figure 4A) and 0% expanded T-cell clones in the peripheral blood. Analyses of the TCRβ-chain repertoire reflected a similar percentage of memory T cells identified by immunohistochemistry and flow cytometry, confirming these substantial numbers of memory T cells in the infant gut and their absence in the lymph nodes and blood.
TCRβ-chain repertoire of clonal CD3+ T cells determined by next-generation sequencing. Expanded T-cell clones were present in the fetal and infant gut in contrast to their absence in thymus, mesenteric lymph nodes (LN), and blood. (A) Scatterplot displaying the percentage of recovered reads per clone (dot) for each tissue or blood sample for patient 7 (fetus), patient 11 (term infant), and the adult peripheral blood control. The clonal distribution of the adult T cells was comparable to previously published data.17 Samples were adjusted for cell input. A cutoff based on a relative contribution of a T-cell clone of > 0.14% to the total T-cell population was used to identify expanded clones and allowed for comparison of tissues and patients. (B) Pie chart showing the distribution of the T-cell clones present in the gut of patient 7 over all the compartments, including gut, lymph nodes, thymus, spleen, and combinations. The T-cell clones were clearly compartmentalized with a lack of distribution over the other tissues.
TCRβ-chain repertoire of clonal CD3+ T cells determined by next-generation sequencing. Expanded T-cell clones were present in the fetal and infant gut in contrast to their absence in thymus, mesenteric lymph nodes (LN), and blood. (A) Scatterplot displaying the percentage of recovered reads per clone (dot) for each tissue or blood sample for patient 7 (fetus), patient 11 (term infant), and the adult peripheral blood control. The clonal distribution of the adult T cells was comparable to previously published data.17 Samples were adjusted for cell input. A cutoff based on a relative contribution of a T-cell clone of > 0.14% to the total T-cell population was used to identify expanded clones and allowed for comparison of tissues and patients. (B) Pie chart showing the distribution of the T-cell clones present in the gut of patient 7 over all the compartments, including gut, lymph nodes, thymus, spleen, and combinations. The T-cell clones were clearly compartmentalized with a lack of distribution over the other tissues.
CD4+ T cells from the infant gut mucosa are highly susceptible to HIV-1 infection
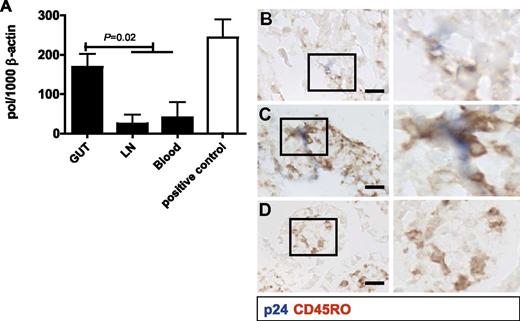
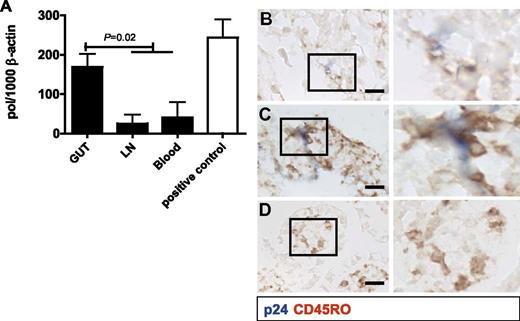
The phenotype of the CD4+ T cells in the infant gut mucosa identified them as prime targets for HIV-1. To explore this, mononuclear cells were isolated from gut tissue and mesenteric lymph nodes obtained at autopsy or from gut tissue and peripheral blood collected during reconstructive gut surgery from patients 5-10 (Table 1). The unstimulated CD4+ T cells were incubated for 12 hours with HIV-1 and cultured for 3 days (Figure 5A). Intestinal CD4+ T cells contained significantly higher HIV-1 pol proviral DNA levels than CD4+ T cells from either lymph nodes or peripheral blood of the same patient. These cells demonstrated extremely high susceptibility to HIV-1 infection, with pol proviral DNA levels similar to the positive control; that is, adult CD4+ T cells from peripheral blood activated with PHA. HIV-1 infection of whole-gut tissue explants revealed HIV-1 p24 in and around CD45RO+ cells in the intestinal tissue after 3 days (Figure 5B-D). These data demonstrate that mucosal CD4+ T cells derived from the fetal and infant gut are highly susceptible to HIV-1, in contrast to infant CD4+ T cells from blood. Their memory phenotype allows for a very efficient infection by HIV-1 comparable to PHA-activated adult T cells.
In vitro HIV-1 infection of CD4+ T cells derived from neonatal tissue and blood. (A) HIV-1 infection was determined using a quantitative PCR for pol proviral DNA in CD4+ T cells at day 3, expressed as the ratio pol/1000 copies of β-actin as a housekeeping gene. The results from blood and lymph nodes were combined in the Student t test because of their similar low levels. Gut-derived CD4+ T cells infected with HIV-1 contained significantly (P = .02) higher levels of pol proviral DNA than cultures with CD4+ T cells derived from blood or lymph nodes. PHA-stimulated adult CD4+ T cells from PMBC single-cell suspensions, which were used as a positive control, had comparable pol proviral DNA levels as unstimulated gut mucosa CD4+ T cells from fetuses and infants. (B-D) HIV-1 infection of intact infant gut explants was assessed by coexpression of viral p24 (blue) and CD45RO (brown). (B-C) p24 was colocalized with CD45RO in the newborn mucosa. (D) Control sample cultured without HIV-1. Scale bar indicates 0.1 mm.
In vitro HIV-1 infection of CD4+ T cells derived from neonatal tissue and blood. (A) HIV-1 infection was determined using a quantitative PCR for pol proviral DNA in CD4+ T cells at day 3, expressed as the ratio pol/1000 copies of β-actin as a housekeeping gene. The results from blood and lymph nodes were combined in the Student t test because of their similar low levels. Gut-derived CD4+ T cells infected with HIV-1 contained significantly (P = .02) higher levels of pol proviral DNA than cultures with CD4+ T cells derived from blood or lymph nodes. PHA-stimulated adult CD4+ T cells from PMBC single-cell suspensions, which were used as a positive control, had comparable pol proviral DNA levels as unstimulated gut mucosa CD4+ T cells from fetuses and infants. (B-D) HIV-1 infection of intact infant gut explants was assessed by coexpression of viral p24 (blue) and CD45RO (brown). (B-C) p24 was colocalized with CD45RO in the newborn mucosa. (D) Control sample cultured without HIV-1. Scale bar indicates 0.1 mm.
Discussion
The goal of the present study was to elucidate the mechanism of MTCT of HIV-1, which led us to investigate a variety of tissues to identify the target cells for HIV-1 infection. We show that already in the fetus there is an abundant presence of CD4+CCR5+ T cells with a memory phenotype in gut epithelium and gut lymphoid aggregates. The CD4+ T cells displayed several distinctive features of previously activated T cells, specifically CCR5, HLA-DR, and CD45RO expression, Th cell differentiation and clonal expansion, which makes it likely that they are memory CD4+ T cells. These properties are markedly different from those of the naive CD4+ T cells present in infant blood and lymph nodes. Such extensive presence of memory CD4+CCR5+ T cells in the human fetal and infant gut mucosa was unknown until now. Studies in mice showed that CD4+ T cells only enter the gut mucosa after birth, leading to the assumption that CD4+ T cells in humans do not exist in the gut mucosa at birth.14 More recent studies in neonatal macaques indicated the presence of a CD4+CCR5+ T cells in the lamina propria with subepithelial localization.25 In contrast, the results of the present study showed the abundance of memory CD4+ T cells with a specific Th phenotype in the gut epithelium, which seems to be a unique feature of the human fetal and infant gut mucosa, because epithelial lymphocytes in adults are mostly CD8+ T cells.14,26
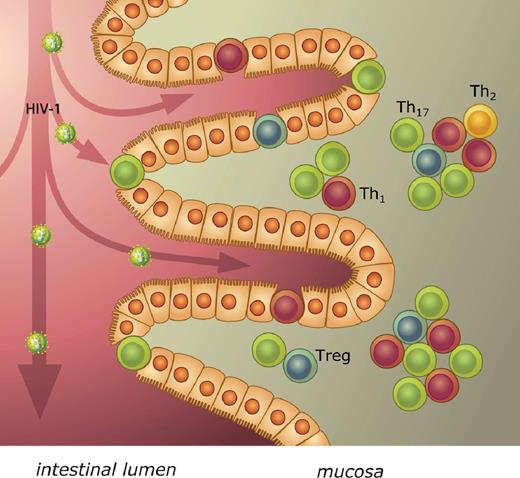
As expected from their phenotype (CCR5+CCR6+HLA-DRhigh), these CD4+ T cells in fetal and infant gut mucosa were highly susceptible to infection with HIV-1, in contrast to neonatal blood CD4+ T cells. The gut, with its large epithelial surface, provides an extensive site for viral transfer to target cells after ingestion of HIV-1 from maternal blood and cervical mucus during delivery or from breast milk.27 In the first days of life, the neonatal stomach is not yet able to inactivate HIV-1 by acidifying ingested fluids and, therefore, infectious HIV virus can be detected in gastric aspirates of newborns.27,28 A mucosal route of MTCT of HIV-1 provides a rationale for some hitherto unexplained observations, including the highly selective transmission of homogeneous R5 viruses associated with mucosal transmission in adults, as well as the protective effect of a cesarean section, which prevents ingestion of HIV-1–containing mucus and blood at delivery.1,8,29 A recent study showed an increased replicative capacity of R5 viruses compared with X4 variants in a T-cell line derived from in vitro PHA-activated infant T cells.30 This difference was not observed in a T-cell line derived from adult cells. This provides further evidence of preferential infection with R5 strains in infants and the necessity of CCR5-bearing target cells in MTCT. TCR-related signaling was implicated as being partly responsible for this observation. The role of the gut in the pathogenesis of HIV infection in adults is widely recognized; our present data suggest a crucial role of the gut mucosa in transmission of HIV-1 in infants (Figure 6).31-34 Future prevention strategies could take this specific locus into account and intervene directly at the site of HIV-1 transmission to the target cells.
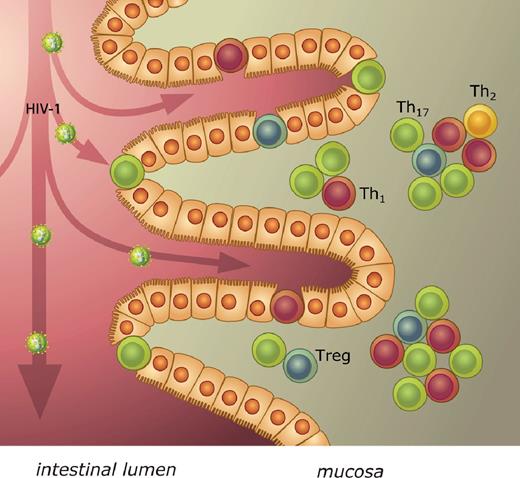
Schematic model of mucosal MTCT of HIV-1. After oral ingestion at birth or breastfeeding, HIV-1 enters the intestinal lumen of the infant. In the epithelium and just under it, CD4+ T cells expressing CCR5 are present, which are accessible targets for HIV-1. These memory CD4+ T cells were further characterized by prototypic nuclear transcription factors for the Th subsets T-bet, Gata-3, RORγt, and FoxP3, indicating a predominance of Th1 and Th17 cells of activated CD4+ T cells in the infant gut mucosa.
Schematic model of mucosal MTCT of HIV-1. After oral ingestion at birth or breastfeeding, HIV-1 enters the intestinal lumen of the infant. In the epithelium and just under it, CD4+ T cells expressing CCR5 are present, which are accessible targets for HIV-1. These memory CD4+ T cells were further characterized by prototypic nuclear transcription factors for the Th subsets T-bet, Gata-3, RORγt, and FoxP3, indicating a predominance of Th1 and Th17 cells of activated CD4+ T cells in the infant gut mucosa.
The abundance of memory T cells in the gut mucosa suggests that adaptive T-cell immunity is already initiated in the fetus. This is supported by the presence of clonally expanded T cells in the gut, as detected by next-generation sequencing, which we applied herein to gain insight into the early T-cell repertoire. T-cell clones were highly compartmentalized to the specific tissues, with only a small overlap between the various anatomical sites. This tissue-dependent distribution was also observed for the hallmark Th cell subset nuclear transcription markers, with T-bet, RORγt, and CD45RO+ cells predominating in the gut. These cells described here are not innate cells such as lymphoid tissue-inducer cells or NK-22 cells expressing RORγt, because these subsets do not express CD3 or CD45RO.19,20,35,36 The tissue-dependent distribution of T-cell subsets suggests that there is not an overall naive or tolerogenic phenotype in the fetus based on blood CD4+ T cells, but instead there is a tissue-dependent adaptive immune system that is already in place in the fetus and consists of tolerizing and inflammatory branches at specific anatomical sites. This differentiated organization of the adaptive immune system may allow the fetus and infant to execute specific responses according to local needs. Further research is required to confirm the induction of adaptive T-cell memory responses with regard to Ag–T-cell interactions in the fetus and the origin of the Ags, as well as the signals that shape the tissue-dependent organization of memory T cells in the fetus. The new model of a compartmentalized neonatal adaptive immune system provided herein may help to understand hitherto unexplained pediatric diseases characterized by severe inflammation in the gut.37
In conclusion, the results of the present study identify target cells for HIV-1 in the newborn infant in the gut mucosa. The mucosal route of MTCT can be addressed in targeted prevention strategies intervening at the anatomical site of HIV-1 transmission. Moreover, our study reveals a framework of a fetal tissue–dependent immune system, which opens up new avenues of research to understand the development of the fetal and infant human adaptive immune system and its role in health and disease.
The publication costs of this article were defrayed in part by page charge payment. Therefore, and solely to indicate this fact, this article is hereby marked “advertisement” in accordance with 18 USC section 1734.
Acknowledgments
The authors thank Hanneke Schuitemaker for support; M. Mack (Klinikum der Universität Regensburg, Germany) for kindly providing the CCR5 Ab; Marije van Santen and Mark Wijnen for supplying tissue samples; Marieke Doorenspleet for assisting in the TCRβ-chain repertoire next-generation sequencing; and Teunis B. H. Geijtenbeek and Joske F. G. Bunders for helpful discussions.
The project was funded by the Netherlands Organisation for Scientific Research Agiko-Stipendium (92003417) and the Dutch AIDS Foundation (2006015).
Authorship
Contribution: M.J.B. and T.W.K. served as principal investigators and conceived and designed the study; M.J.B., C.M.v.d.L., P.L.K., and J.L.v.H. performed the experiments; K.B., J.C.H.W., and S.T.P. assisted in acquisition of the samples; R.A.W.v.L. and S.T.P. contributed to study design; N.d.V. developed and analyzed the next-generation sequencing; N.K. contributed to the design of the HIV-infection experiments; M.J.B. devised and performed the analyses and wrote the first draft of the manuscript with input from all authors and supervised by T.W.K.; and all authors approved the final manuscript revisions.
Conflict-of-interest disclosure: The authors declare no competing financial interests.
Correspondence: Madeleine Bunders, Department of Pediatric Hematology, Immunology and Infectious Diseases, Emma Children's Hospital, AMC, University of Amsterdam, Location H7-230, Meibergdreef 9, 1105 AZ Amsterdam, The Netherlands; e-mail: m.j.bunders@amc.uva.nl.

