Abstract
Acquired aplastic anemia (AA) is an immune-mediated bone marrow (BM) failure attacked by autoreactive effector T cells and BM is the main target organ. CD4+CD25+ regulatory T cells (Tregs) were believed to control development and progression of autoimmunity by suppressing autoreactive effector T cells, but little was known regarding the function of Tregs in AA. Our study demonstrated that both peripheral blood (PB) and BM had decreased frequencies of Tregs, accompanied with a reversed lower ratio of Treg frequencies between BM and PB in AA. PB Tregs in AA had impaired migratory ability because of lower CXCR4 (but not for CXCR7) expression. Interestingly, we first showed that impairment of Treg-mediated immunosuppression was intrinsic to Tregs, rather than resistance of effector T cells to suppression in AA by coculture assays and criss-cross experiments in vitro. Furthermore, Tregs in AA were less able to inhibit interferon-γ production by effector T cells. Defective immunosuppression by Tregs could contribute to impaired hematopoiesis conducted by effector T cells in vitro. Our study provided powerful evidence that impairment of Tregs played a critical role in the pathophysiology of AA. Thus, patients with AA might greatly benefit from a Treg-oriented immunosuppressive strategy.
Introduction
Acquired aplastic anemia (AA), characterized by pancytopenia in peripheral blood (PB) and bone marrow (BM) hypoplasia, is a bone marrow failure syndrome attacked by autologous T cells, such as CD8+ cytotoxic T cells, CD4+ Th1 cells, and Th17 cells, on BM hematopoietic progenitors.1–4 Hematopoiesis recovery after successful immunosuppressive treatment provided powerful evidence for the core role of the immune-mediated destruction of hematopoietic progenitor/stem cells. Mechanisms of immune-mediated destruction of hematopoiesis include Th1 polarization response conferring immoderate production of inhibitory cytokines such as interferon-γ (IFN-γ), tumor necrosis factor-α (TNF-α), and interleukin-2 (IL-2), direct toxicity to autologous CD34+ cells by T-cell populations, and Th17 immune response.4–7 In that sense, AA is a specific autoimmune disease because of aberrant T-cell immune homeostasis and BM is the main target organ.
It is now well established that CD4+ T-cell subpopulations constitutively expressing the surface protein CD25 and the transcription factor FoxP3 are indispensable for the maintenance of immunologic self-tolerance and immunosuppression.8–11 There is also accumulating evidence that impaired function of CD4+CD25+ regulatory T cells (Tregs) has been implicated in the development of several common autoimmune diseases,8,10 myelodysplastic syndromes,12 and AA.13 Until now, the only report of Treg abnormality in AA has shown that the numbers of circulating Tregs decreased in most patients. Meanwhile, almost all patients had low levels of nuclear factor of activated T cells, cytoplasmic 2 (NFAT1/NFATc2) which could explain decreased FoxP3 expression in Tregs from AA patients.13 But little is known regarding the function of Tregs in AA.
Physiologically, induction of immune tolerance and suppression of autoreactive effector T-cell proliferation were the critical function of CD4+CD25+ Tregs through cell contact-inhibition mechanisms and/or production of inhibitory cytokine. Furthermore, BM is a reservoir for CD4+CD25+ Tregs that home to and are retained in BM through the stromal-derived factor-1α (SDF-1α)/CXCR4 signal.14 Previous data demonstrated that the only way for Tregs homing to BM was via the SDF-1α/CXCR4 signal.14,15 It was believed that CXCR4 was the only receptor of SDF-1α for years. However, several reports recently provided evidence that SDF-1α also bound to another 7 transmembrane span receptor CXCR7.16,17 Thus, the role of the SDF-1α/CXCR4 axis in regulating Treg trafficking between BM and PB becomes more complex. Combined with the fact that BM is the target organ attacked by autoreactive effector T cells leading to hematopoiesis destruction, we hypothesized that Tregs in AA might have impaired homing potential to BM so as to be less efficient to suppress the effector T-cell proliferation and Th1-type cytokine production. We also hypothesized that Tregs in AA had intrinsic deficiencies of immunosuppression for autologous effector T cells.
To test these hypotheses, we first examined the migratory capacity of Tregs toward SDF-1α and BM fluid, and explored the expression levels of CXCR4 and CXCR7 on Tregs from AA patients. Moreover, we designed coculture assays and criss-cross experiments by Tregs and effector T cells in vitro to explore whether Tregs from AA could effectively suppress proliferation and Th1-type cytokine production by effector T cells. We also evaluated the ability of hematopoiesis recovery by Treg-mediated immunosuppression for effector T cells. Our study indicated that intrinsic impairment of Tregs contributed to the immune-mediated BM failure, and a Treg-mediated immunosuppressive strategy might be beneficial to suppress excessive Th1 immune response in AA.
Methods
Patients
Fifty-five (29 male, 26 female) de novo–acquired AA patients with a median age of 35 years (range, 21-59 years) were included in the study after written informed consent in accordance with the Declaration of Helsinki to the protocol, which was approved by the Institutional Committee for Medical Care and Safety. This cohort of patients included 27 cases with severe AA (SAA) and 28 with non-SAA (NSAA). The diagnosis and severity classification of AA were established according to the criteria of Camitta et al.18 Control samples from 34 age-matched healthy volunteers (19 male, 15 female; age range, 23-56 years) were obtained after informed consent.
Purification of lymphocyte subpopulations
PB and BM mononuclear cells were separated by density-gradient centrifugation, respectively. Three T-cell subpopulations, including CD4+CD25+ Tregs, CD4+CD25− responder T cells (Tresp), and CD8+ cytotoxic T cells (Tcyt), were purified using a commercial CD4+CD25+ human Treg cell isolation kit (Miltenyi Biotec) and a CD8-positive selection magnetic-activated cell sorting (MACS) isolation kit (Miltenyi Biotec) according to the manufacturer's instructions.19,20 Cells fractions showing Tregs, Tresp, or Tcyt cell purity of more than 90% were used for subsequent experiments.
Flow cytometry
PB and BM mononuclear cells were stained with the following antibodies: CD4-FITC, CD25-PE, CXCR4-allophycocyanin, CD45-allophycocyanin, and the appropriate isotypic controls (all from BioLegend) according to the manufacturer's instructions. Data acquisitions were performed on a LSR II flow cytometer (BD Biosciences) and analyzed by FlowJo software (Version 7.6; TreeStar).
Chemotaxis assay
Purified PB Tregs were subjected to migratory assay as described previously,21 using SDF-1α or BM fluid as chemotactic media. All migratory assays were performed in duplicates in a 24-well plate inserting with 5-mm pore polycarbonate filters (Costar Corporation). Briefly, purified PB Tregs cells (1 × 10⁵ cells/well) were induced to migrate toward either SDF-1α (100 ng/mL; PeproTech) or BM fluid, always diluted in RPMI 1640 with 0.5% bovine serum albumin and 10% fetal bovine serum (FBS). After incubation at 37°C for 4 hours, migrating cells were harvested from the lower compartment. The harvested cells were enumerated using a hemacytometer. The percentage of migrating cells was calculated by determining the ratio of the number of cells recovered from the lower compartment to the total number of cells loaded in the upper compartment. CXCR4 neutralization experiments were performed by preincubating cells with mouse anti–human CXCR4 (100 ng/mL, clone 12G5; R&D Systems) for 30 minutes before addition to the top chamber.
Quantification of gene expression by real-time PCR
Total RNA of Tregs (3-5 × 10⁵ cells) was extracted using TRIzol reagent (Invitrogen Life Technologies). The reverse transcription reactions were carried out using the M-MLV reverse transcriptase (Promega) following the manufacturer's procedure. Real-time PCR (RT-PCR) was performed using an ABI PRISM-7500 Sequence Detection System in the presence of SYBR green. PCR primer sequences were as follows: GAPDH forward: 5′-CTCCTCCACCTTTGACGCTG-3′, reverse: 5′-TCCTCTTGTGCTCTTGCTGG-3′; CXCR4 forward: 5′-ATC CCT GCCCTC CTG CTG ACT ATT C-3′, reverse: 5′-GAG GGC CTT GCG CTT CTG GTG-3′; CXCR7 forward: 5′-GCT GCT GGC CTT CTG CGT GTC TCT-3′, reverse: 5′-CTT CCGGCT GCT GTG CTT CTC CTG-3′. For PCR amplification, initial denaturation was at 94°C for 10 minutes followed by 40 cycles of denaturation at 94°C for 15 seconds, annealing at 60°C for 1 minute, and extension at 72°C for 30 seconds. After PCR, a melting curve analysis was performed by increasing the temperature from 60°C to 95°C with a temperature transition rate of 0.1°C/s. The relative quantification (RQ) of gene expression was obtained by comparing with the relative expression of GAPDH using 2 − Δ cycle threshold (Ct, target gene − Ct, GAPDH).
Treg proliferation and suppression assays
Once purified, Tregs were mixed at a ratio of 1:8 (PB) or 1:12 (BM), respectively, then added to autologous Tresp or Tcyt cells seeded at 3 × 10⁵ cells/well in a 24-well plate.22,23 Cells were cocultured for 5 days at 37°C with 5% CO2 in RPMI 1640, supplemented with 1% penicillin/streptomycin, 1% glutamine, 10% FBS, 5 ng/mL rIL-2, and allogeneic plastic-adherent PB mononuclear cells treated by mitomycin C as Ag-presenting cells (APCs; 3 × 10⁵ cells/well). Phytohemagglutinin M (PHA-M) was added at a concentration of 5 μg/mL on the third day of culture, and cells were then collected and transferred to a 96-well plate (1 × 10⁵ cells/well). BrdU was added at 10μM (final concentration) during the last 18 hours of culture. Evaluation of cell proliferation was assayed by the Brdu ELISA kit (Roche Applied Science) and absorbance (A370nm − A492nm) was taken as the ability of proliferation. The percentage of inhibition was calculated using the formula: 1 − (absorbance in the presence of Tregs/absorbance in the absence of Tregs) × 100. For criss-cross experiments, PB Tregs from AA patients were mixed with autologous and healthy Tresp or Tcyt at a ratio of 1:8, and vice versa, in the presence of allogeneic APCs.
Detection of levels of IFN-γ and SDF-1α
Culture supernatants obtained from the proliferation and suppression assays were analyzed for IFN-γ by ELISA based on the manufacturer's instructions (R&D Systems). The decreased percentage of IFN-γ production was calculated using the formula: 1 − (level in the presence of Tregs/level in the absence of Tregs) × 100. SDF-1α was also detected in serum and BM fluid by ELISA (R&D Systems).
Purification of human CD34+ cells
CD34+ cells were freshly purified from cord blood using a CD34/MACS isolation kit according to the manufacturer's instructions (Miltenyi Biotec). Cell fractions showing a CD34+ cell purity of 95% ± 5% (range, 90%-100%) were used for subsequent experiments.
CFU assay
The sorted cord blood CD34+ cells were inoculated in semisolid media as described previously.24,25 Briefly, 250 sorted cord blood CD34+ cells were plated per dish in duplicate cultures containing 0.5 mL of IMDM with 1.1% methylcellulose, 30% FBS, 10−4M 2-mercaptoethanol (StemCell Technologies), to which 50 ng/mL SCF, 10 ng/mL IL-3, 10 ng/mL granulocyte macrophage colony-stimulating factor (GM-CSF), and 3 U/mL erythropoietin were added. Culture supernatants obtained from the proliferation and suppression assays were added at a ratio of 1:4.26 Colonies were enumerated 14 days after incubation.
Statistical analysis
All analyses were performed using SPSS 16.0 software (SPSS Science). Data were presented as mean ± SEM. The significance of the differences was assessed by Student t test. A value of P < .05 was considered statistically significant.
Results
Decreased frequencies of Tregs in PB and BM of patients with AA
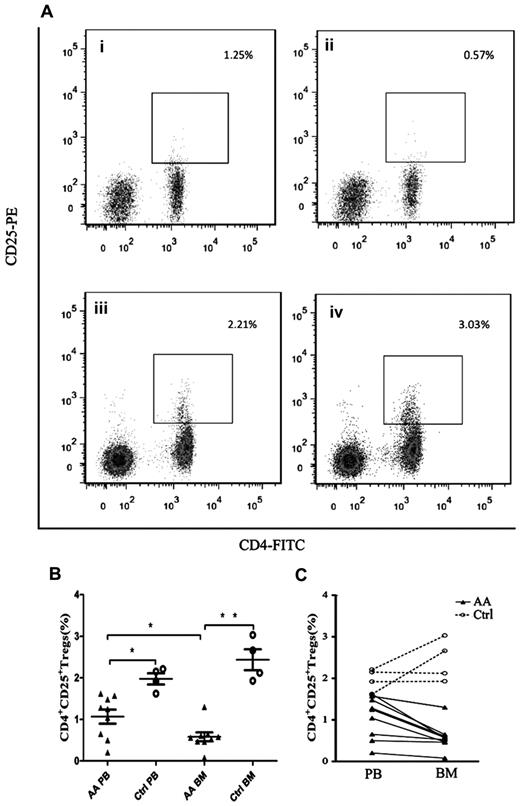
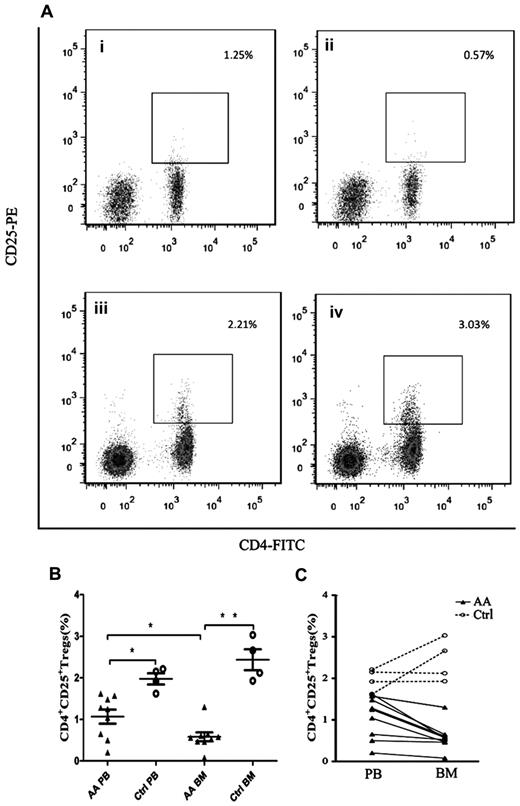
To detect the abnormal frequencies of Tregs in AA, we analyzed the frequencies of Tregs (gating on lymphocyte population) in PB and BM samples obtained from each AA patient. All patients had significantly decreased frequencies of Tregs compared with healthy controls (Figure 1A-B), not only in PB (1.07% ± 0.17% vs 1.98% ± 0.13%, P = .007) but also in BM (0.58% ± 0.32% vs 2.44% ± 0.25%, P < .001). More interestingly, BM samples of AA patients had significantly lower frequencies of Tregs than that in PB samples (P = .03, Figure 1B-C). In contrast, BM samples of healthy controls had higher frequencies of Tregs compared with PB samples but without significant difference (Figure 1B-C). By virtue of the paired PB and BM data obtained from each cohort, we could draw the ratio of Treg frequencies between BM and PB samples. The ratio of Treg frequencies of BM versus PB in healthy controls (1.25 ± 0.16) was significantly higher than that in AA patients (0.57 ± 0.07, P = .001), indicating that the ratio of Treg frequencies between BM and PB was pathologically reversed in AA (Figure 1C).
Decreased frequencies of Tregs in PB and BM from patients with AA. (A) Representative flow cytometric analysis of Tregs frequencies (gated on lymphocyte population) in (i) AA PB, (ii) AA BM, (iii) control PB, and (iv) control BM. (B) Frequencies of CD4+CD25+ Tregs in PB and BM of AA patients (n = 9) and healthy controls (n = 4). (C) Reversed ratio of frequencies of CD4+CD25+ Tregs between BM and PB in AA. Data were expressed as mean ± SEM. *P < .05; **P < .001.
Decreased frequencies of Tregs in PB and BM from patients with AA. (A) Representative flow cytometric analysis of Tregs frequencies (gated on lymphocyte population) in (i) AA PB, (ii) AA BM, (iii) control PB, and (iv) control BM. (B) Frequencies of CD4+CD25+ Tregs in PB and BM of AA patients (n = 9) and healthy controls (n = 4). (C) Reversed ratio of frequencies of CD4+CD25+ Tregs between BM and PB in AA. Data were expressed as mean ± SEM. *P < .05; **P < .001.
Impaired migratory ability of Tregs because of lower expression of CXCR4 but not for CXCR7
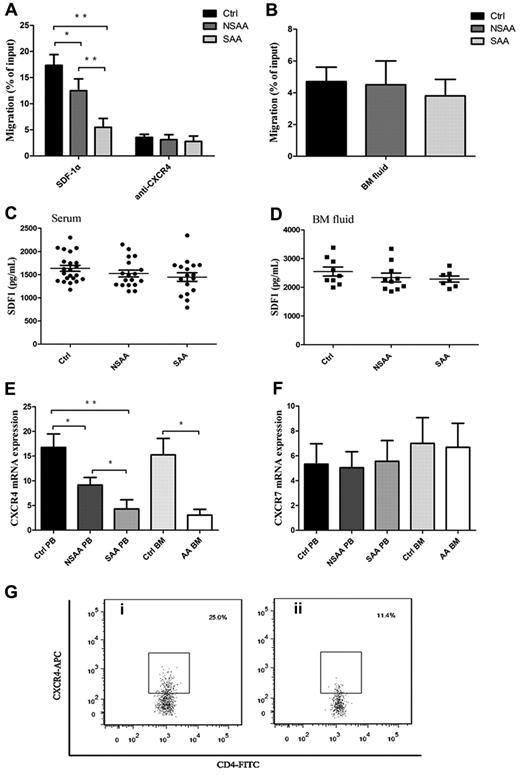
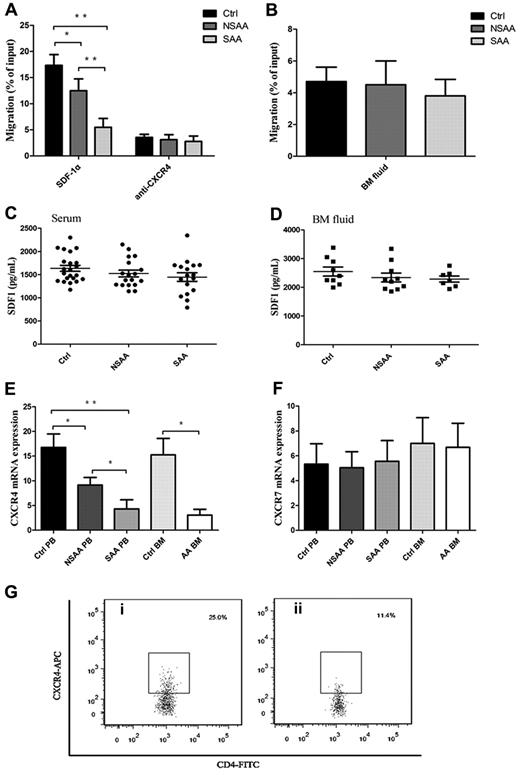
Appropriate localization of Tregs is considered to be critical for high efficiency of Treg-mediated immunosuppression response.27,28 To address the question of whether defective migration of Tregs in AA toward SDF-1α existed or not, we studied the migratory capacity of PB Tregs in AA. Interestingly, PB Tregs in AA patients, including NSAA patients (12.5% ± 2.3%, P = .001) and SAA patients (5.5% ± 1.7%, P < .001), had less migratory capacity toward SDF-1α (Figure 2A), compared with PB Tregs in controls (17.3% ± 2.1%). PB Tregs in SAA patients had less migratory capacity than that in NSAA patients (P < .001), suggesting that the impaired migratory potential of Tregs correlated with the severity of AA. Moreover, blocking of CXCR4 with 12G5 antibodies resulted in significant reduction of Treg migratory capacity in NSAA and SAA patients, and to a greater extent in controls (Figure 2A).
Impaired migratory ability of Tregs was because of lower CXCR4 (but not for CXCR7 expression) in AA. (A) PB Tregs from both NSAA (n = 8, P = .001) and SAA patients (n = 8, P < .001) had less migratory capacity toward SDF-1α compared with those in controls (n = 8). PB Tregs from SAA had less migratory ability than that from NSAA (P < .001). CXCR4 blockade resulted in significant reduced migratory capacity of Tregs in controls, NSAA, and SAA, which were comparable among the 3 groups. (B) Healthy Tregs migrated equally toward BM fluid obtained from NSAA (n = 5), SAA patients (n = 5), and controls (n = 5). (C-D) The levels of SDF-1α both in serum (NSAA, n = 18; SAA, n = 17; controls, n = 22) and BM fluid (NSAA, n = 10; SAA, n = 7; controls, n = 9) detected by ELISA were comparable among the 3 groups. (E-F) The results of quantitative analysis of CXCR4 and CXCR7 mRNA expression showed that a significantly lower expression of CXCR4 on PB Tregs from both NSAA (n = 15, P = .026) and SAA patients (n = 15, P < .001) compared with that of controls (n = 17). Similarly, CXCR4 expression was significantly lower on BM Tregs from AA patients (n = 5) compared with that of controls (n = 7, P = .015). In contrast, there were no significant differences in CXCR7 mRNA expression on PB and BM Tregs among the 3 groups. (G) Representative CXCR4 expressions on the CD4+CD25+ Tregs from a (i) healthy control and a (ii) AA patient. AA patients (n = 6) had significantly lower frequencies of CXCR4-positive cells (P < .001) and lower relative fluorescence intensity (RFI; P = .003), compared with healthy controls (n = 6). *P < .05; **P < .001.
Impaired migratory ability of Tregs was because of lower CXCR4 (but not for CXCR7 expression) in AA. (A) PB Tregs from both NSAA (n = 8, P = .001) and SAA patients (n = 8, P < .001) had less migratory capacity toward SDF-1α compared with those in controls (n = 8). PB Tregs from SAA had less migratory ability than that from NSAA (P < .001). CXCR4 blockade resulted in significant reduced migratory capacity of Tregs in controls, NSAA, and SAA, which were comparable among the 3 groups. (B) Healthy Tregs migrated equally toward BM fluid obtained from NSAA (n = 5), SAA patients (n = 5), and controls (n = 5). (C-D) The levels of SDF-1α both in serum (NSAA, n = 18; SAA, n = 17; controls, n = 22) and BM fluid (NSAA, n = 10; SAA, n = 7; controls, n = 9) detected by ELISA were comparable among the 3 groups. (E-F) The results of quantitative analysis of CXCR4 and CXCR7 mRNA expression showed that a significantly lower expression of CXCR4 on PB Tregs from both NSAA (n = 15, P = .026) and SAA patients (n = 15, P < .001) compared with that of controls (n = 17). Similarly, CXCR4 expression was significantly lower on BM Tregs from AA patients (n = 5) compared with that of controls (n = 7, P = .015). In contrast, there were no significant differences in CXCR7 mRNA expression on PB and BM Tregs among the 3 groups. (G) Representative CXCR4 expressions on the CD4+CD25+ Tregs from a (i) healthy control and a (ii) AA patient. AA patients (n = 6) had significantly lower frequencies of CXCR4-positive cells (P < .001) and lower relative fluorescence intensity (RFI; P = .003), compared with healthy controls (n = 6). *P < .05; **P < .001.
To exclude the possibility that the secretion of SDF-1α variants or other soluble chemoattractant from BM was responsible for the impaired migratory ability of Tregs in AA, a migratory assay was performed using BM fluid from AA patients and controls as the chemotactic substrate. Expectedly, migratory capacities of PB Tregs in the 3 groups were similar (Figure 2B). To further exclude the possibility of the decreased level of SDF-1α in BM fluid because of the impaired hematopoietic microenvironment (especially the stromal cells), we detected the levels of SDF-1α by ELISA and revealed comparable levels of SDF-1α among the 3 groups both in serum (controls, 1635.5 ± 649.1 ng/mL; NSAA patients, 1478.7 ± 708.2 ng/mL; and SAA patients, 1446.9 ± 92.0 ng/mL, Figure 2C) and in BM fluid (controls, 2547.5 ± 157.5 ng/mL; NSAA patients, 2341.1 ± 13.5 ng/mL; SAA patients, 2288.8 ± 106.4 ng/mL, Figure 2D). Our data suggested that the attenuation of chemotactic signals from BM was not responsible for the impaired migratory ability of Tregs in AA patients.
Until now, the only chemokine known to attract Treg homing to BM is SDF-1α,15 which interacts with CXCR4 and/or CXCR7. We herein focused on the mRNA expressions of homing receptors CXCR4 and CXCR7 in PB and BM Tregs by quantitative RT-PCR. Significantly lower expressions of CXCR4 mRNA on PB Tregs from both NSAA patients (P = .026) and SAA patients (P < .001) compared with controls were observed (Figure 2E). Furthermore, the expression of CXCR4 mRNA on PB Tregs from SAA patients was significantly lower than from NSAA patients (P = .003), which was in accordance with their migratory potential. Similarly, CXCR4 mRNA expression was significantly lower on BM Tregs from AA patients compared with controls (P = .015). In contrast, no significant differences were observed for CXCR7 mRNA expression on PB and BM Tregs among the 3 groups (Figure 2F). Then, we detected, at the protein level, the expression of CXCR4 by CD4+CD25+ Tregs. PB CD4+CD25+ Tregs displayed significantly lower frequencies of CXCR4-positive cells in AA patients (13.5% ± 2.5%) compared with healthy controls (25.4% ± 2.5%, P < .001; Figure 2G). Furthermore, lower relative fluorescence intensity (RFI) was seen in the AA group (179.4 ± 87.0), compared with that in the healthy controls (390.8 ± 70.9, P = .003). These results suggested that impaired migratory potential of Tregs in AA patients may be because of lower expression of CXCR4 (but not for CXCR7) instead of the effect of deficient SDF-1α secretion by the hematopoietic microenvironment. Most importantly, the impaired migratory potential of Tregs because of lower CXCR4 expression significantly correlated with the severity of AA.
Intrinsic impairment of Treg-mediated immunosuppression for effector T cells
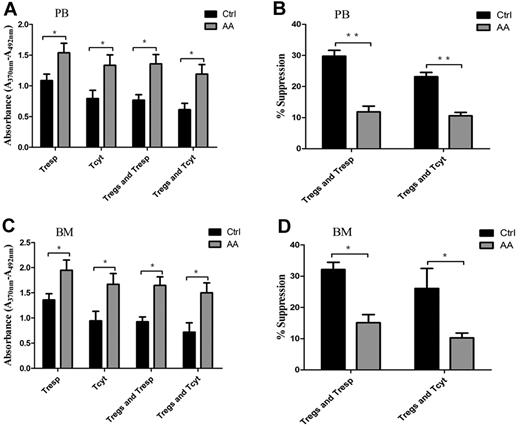
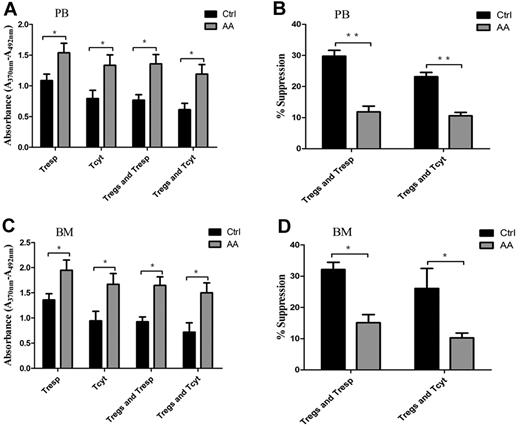
Physiologically, Tregs have powerful ability to suppress proliferation of autoreactive T cells, including Tresp and Tcyt populations, through contact-dependent mechanisms or inhibitory cytokine production.8,10 To address the efficiency of Treg-mediated immunosuppression for effector T cells, we carried out cocultures of Tregs/Tresp or Tregs/Tcyt. Both PB- and BM-derived Tresp or Tcyt from AA patients cultured without autologous Tregs showed significantly higher proliferative abilities compared with those in controls (P = .043 and P = .037, for PB-derived Tresp and Tcyt, respectively; P = .038 and P = .034, for BM-derived Tresp and Tcyt, respectively; Figure 3A,C). PB- and BM-derived Tresp or Tcyt from AA patients cocultured with autologous Tregs still retained high proliferative abilities (P = .01 and P = .014, for PB-derived Tresp and Tcyt, respectively; P = .006 and P = .020, for BM-derived Tresp and Tcyt, respectively). In addition, PB-derived Tregs from AA patients were less efficient in suppressing autologous Tresp and Tcyt proliferative responses compared with those from controls (29.8% ± 1.8% vs. 11.9% ± 1.8%, P < .001 for Tresp; 23.2% ± 1.3% vs. 10.6% ± 1.1%, P < .001 for Tcyt, respectively; Figure 3B). Correspondingly, BM-derived Tregs from AA patients also could not suppress autologous Tresp and Tcyt proliferative responses compared with those from controls (32.1% ± 2.3% vs 15.1% ± 2.6%, P = .001 for Tresp; 26.1% ± 6.4% vs 10.2% ± 1.5%, P = .042 for Tcyt, respectively; Figure 3D).
Impaired Treg-mediated immunosuppression for effector T cells in AA. (A,C) Both PB- and BM-derived Tresp and Tcyt from AA patients (n = 6) showed higher proliferative ability compared with those of controls (n = 6). PB- or BM-derived Tresp and Tcyt from AA patients (n = 6) postcocultured with autologous Tregs still retained higher proliferative ability compared with that of controls (n = 6). (B,D) PB-derived Tregs from AA patients (n = 6) were less efficient in suppressing autologous Tresp and Tcyt proliferative response compared with those of controls (n = 6). BM-derived Tregs from AA patients (n = 6) also could not suppress autologous Tresp and Tcyt compared with those of controls (n = 6). The proliferation ability was calculated using absorbance (A370nm − A492nm). Percentage of inhibition was calculated using the formula: 1 − (absorbance in the presence of Tregs/absorbance in the absence of Tregs) × 100. *P < .05; **P < .001.
Impaired Treg-mediated immunosuppression for effector T cells in AA. (A,C) Both PB- and BM-derived Tresp and Tcyt from AA patients (n = 6) showed higher proliferative ability compared with those of controls (n = 6). PB- or BM-derived Tresp and Tcyt from AA patients (n = 6) postcocultured with autologous Tregs still retained higher proliferative ability compared with that of controls (n = 6). (B,D) PB-derived Tregs from AA patients (n = 6) were less efficient in suppressing autologous Tresp and Tcyt proliferative response compared with those of controls (n = 6). BM-derived Tregs from AA patients (n = 6) also could not suppress autologous Tresp and Tcyt compared with those of controls (n = 6). The proliferation ability was calculated using absorbance (A370nm − A492nm). Percentage of inhibition was calculated using the formula: 1 − (absorbance in the presence of Tregs/absorbance in the absence of Tregs) × 100. *P < .05; **P < .001.
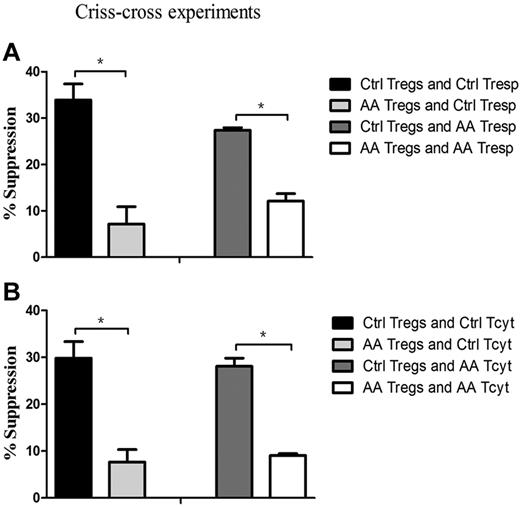
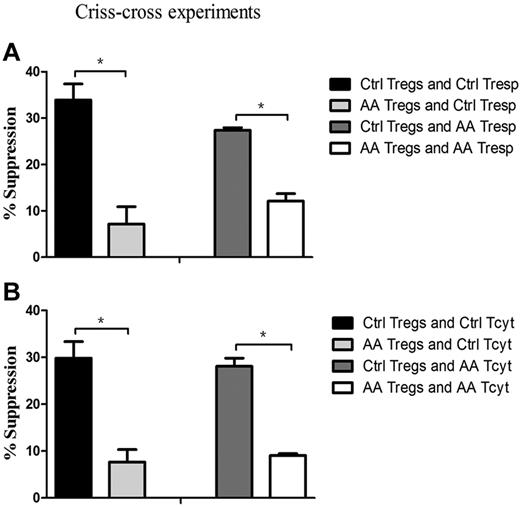
To pinpoint that the defective cells in AA patients were indeed of Tregs, we further performed criss-cross experiments by AA Tregs and healthy effector T cells, and vice versa. Tregs from AA patients had lower suppressive capacity on healthy Tresp (7.1% ± 3.8%), but healthy Tregs had higher suppressive ability on autologous Tresp (33.9% ± 3.4%, P = .035; Figure 4A). Likewise, it was healthy Tregs (27.4% ± 0.6%), but not for AA Tregs (12.1% ± 1.6%), that had the suppressive potential on AA Tresp (P = .043). Similar results could be seen in Tcyt populations (Figure 4B). AA Tregs had less efficiency in suppressing healthy Tcyt (7.7% ± 2.6%), but healthy Tregs did effectively inhibit its autologous Tcyt (29.8% ± 3.5%, P = .043). In addition, it was healthy Tregs (28.1% ± 1.7%), but not for AA Tregs (9.1% ± 0.4%), that exerted an immunosuppressive response on AA Tcyt (P = .047). These results indicated that AA Tregs had impaired immunosuppression response on autologous effector T cells. Conversely, healthy Tregs had suppressive potential on hyperreactive Tresp or Tcyt from AA patients. Collectively, Tregs from AA patients were indeed inherently dysfunctional in their suppressive capacity.
Impaired Treg-mediated immunosuppression was because of intrinsic defects in Tregs, rather than resistance of effector T cells. (A) Tregs from AA patients (n = 6) could not suppress Tresp from controls (n = 6, 7.1% ± 3.8%) to the same degree as Tregs from controls (33.9% ± 3.4%, P = .035), and Tregs from controls had more suppressive potential for Tresp from AA patients (27.4% ± 0.6%) than that of Tregs from AA patients (12.1% ± 1.6%, P = .043). (B) Tregs from AA patients had less efficiency in suppressing healthy Tcyt (7.7% ± 2.6%), but healthy Tregs could effectively inhibit its autologous Tcyt (29.8% ± 3.5%, P = .043). Likewise, it was healthy Tregs (28.1% ± 1.7%) but not for Tregs from AA patients (9.1% ± 0.4%) that exerted immunosuppressive response for Tcyt from AA patients (P = .047). * P < .05.
Impaired Treg-mediated immunosuppression was because of intrinsic defects in Tregs, rather than resistance of effector T cells. (A) Tregs from AA patients (n = 6) could not suppress Tresp from controls (n = 6, 7.1% ± 3.8%) to the same degree as Tregs from controls (33.9% ± 3.4%, P = .035), and Tregs from controls had more suppressive potential for Tresp from AA patients (27.4% ± 0.6%) than that of Tregs from AA patients (12.1% ± 1.6%, P = .043). (B) Tregs from AA patients had less efficiency in suppressing healthy Tcyt (7.7% ± 2.6%), but healthy Tregs could effectively inhibit its autologous Tcyt (29.8% ± 3.5%, P = .043). Likewise, it was healthy Tregs (28.1% ± 1.7%) but not for Tregs from AA patients (9.1% ± 0.4%) that exerted immunosuppressive response for Tcyt from AA patients (P = .047). * P < .05.
Impairment of Treg-mediated inhibition of IFN-γ–producing Th1 response
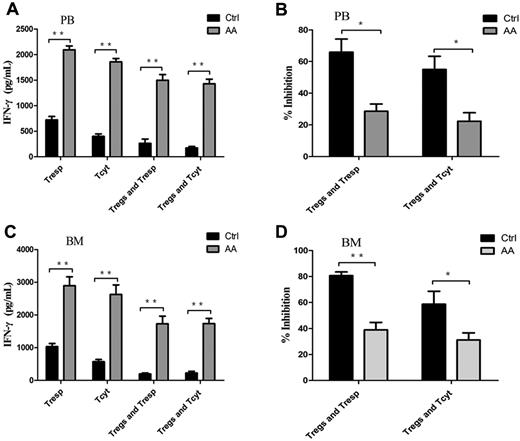
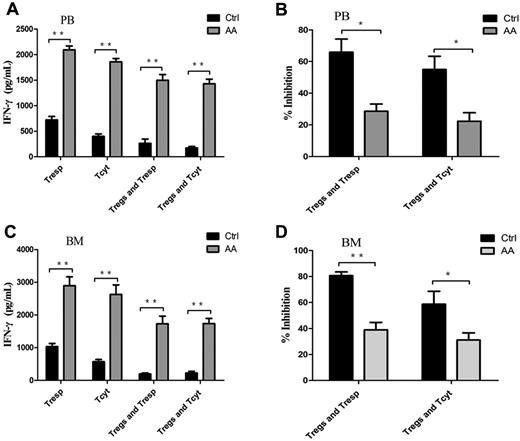
IFN-γ, the most importantly inhibitory cytokine in Th1 immune response, can mediate the destruction of hematopoiesis29,30 by direct toxicity to autologous CD34+ cells31 in AA patients. We assessed the Treg-mediated inhibition of IFN-γ production by effector T cells using coculture assays. Both PB- and BM-derived Tresp and Tcyt from AA patients produced significantly high levels of IFN-γ compared with those from controls (P < .001 and P < .001, for PB-derived Tresp and Tcyt, respectively, Figure 5A; P < .001 and P = .030, for BM-derived Tresp and Tcyt, respectively, Figure 5C). The same was true of IFN-γ production by Tresp and Tcyt populations, even postcocultured with autologous Tregs. PB- or BM-derived Tregs from AA patients failed to suppress IFN-γ production by autologous Tresp and Tcyt populations compared with those from controls (P = .005 and P = .001, for PB-derived Tresp and Tcyt, respectively; P < .001 and P < .001, for BM-derived Tresp and Tcyt, respectively; Figure 5B,D). These results provided further evidence that Tregs in AA patients had decreased ability of control and suppression for Th1-type cytokine production by effector T cells in vitro.
Impairment of Treg-mediated inhibition of IFN-γ production by effector T cells in AA. (A,C) The levels of IFN-γ measured in the supernatants from the proliferation and suppression assays showed that both PB- and BM-derived Tresp and Tcyt from AA patients (n = 6) postcocultured with autologous Tregs had significantly higher levels of IFN-γ production compared with those of controls (n = 6). (B,D) Percentages of inhibition of IFN-γ production were shown. *P < .05; **P < .001.
Impairment of Treg-mediated inhibition of IFN-γ production by effector T cells in AA. (A,C) The levels of IFN-γ measured in the supernatants from the proliferation and suppression assays showed that both PB- and BM-derived Tresp and Tcyt from AA patients (n = 6) postcocultured with autologous Tregs had significantly higher levels of IFN-γ production compared with those of controls (n = 6). (B,D) Percentages of inhibition of IFN-γ production were shown. *P < .05; **P < .001.
Defective immunosuppression by AA Tregs contributed to impaired hematopoiesis in vitro
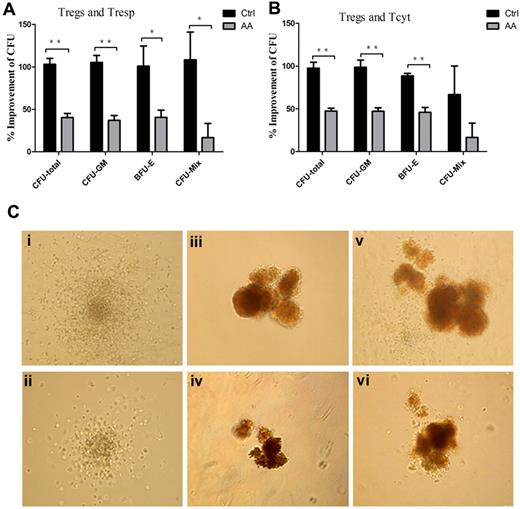
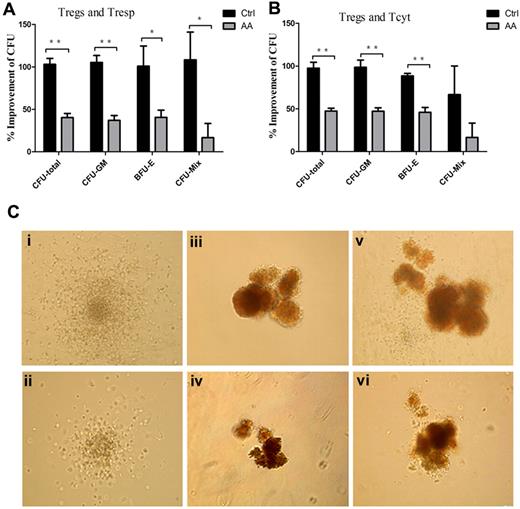
Previous reports demonstrated that lymphocytes from AA patients could inhibit allogeneic and autologous hematopoietic colony formation in vitro32 and removal of lymphocytes improved colony numbers in tissue culture.33 To address whether defective AA Tregs could contribute to the impaired hematopoiesis by effector T cells, we assessed influence of the supernatants obtained from effector T cells/Treg coculture systems on CFU formations of cord blood CD34+ cells. The numbers of total CFU (CFU-total), CFU-granulocyte, macrophage (CFU-GM), burst-forming unit-erythroid (BFU-E), and CFU-granulocyte, erythroid, macrophage, megakaryocyte (CFU-Mix) in the presence of the supernatants from AA Tresp, Treg/Tresp, Tcyt, and Treg/Tcyt populations were significantly less than those from controls (Table 1). Furthermore, the increased percentages of CFU formations in AA patients were significantly lower than those in controls (CFU-total: 40.3% ± 4.9% vs 103.0% ± 7.1%, 47.5% ± 3.2% vs 97.6% ± 6.8%, for Tresp and Tcyt, respectively; CFU-GM: 37.0% ± 5.8% vs 105.2% ± 8.2%, 47.2% ± 9.7% vs 98.4% ± 8.6%, for Tresp and Tcyt, respectively; BFU-E: 37.0% ± 8.5% vs 100.8% ± 23.8%, 46.0% ± 5.7% vs 88.4% ± 7.3%, for Tresp and Tcyt, respectively; CFU-Mix: 16.7% ± 16.7% vs 108.3% ± 32.7%, 16.7% ± 16.7% vs 66.7% ± 33.2%, for Tresp and Tcyt, respectively; Figure 6A-B). In addition, the sizes of CFU-GM, BFU-E, and CFU-Mix in the presence of the coculture supernatants from AA patients (Figure 6Cii,iv,vi) were significantly smaller than those from controls (Figure 6Ci,iii,v). Thus, defective immunosuppression by AA Tregs could contribute to impaired hematopoiesis conducted by effector T cells in vitro. We further performed coculture of CD34+ cells with Tregs, or CD34+ cells, effector T cells with or without Tregs from AA or controls. We found the similar numbers of CFU with or without Tregs from AA and controls, which suggested that cell-to-cell interaction between hematopoietic progenitors and Tregs or effector T cells had no direct inhibition on hematopoiesis. But the supernatants of cocultures of Tregs and effector T cells could alleviate the inhibition on hematopoiesis by effector alone in healthy control, other than in AA patients (Table 1).
Defective immunosuppression by AA Tregs contributed to impaired hematopoiesis in vitro. (A-B) Percentages of improvement of the numbers of CFU in presence of the supernatants obtained from the cocultured systems (AA patients, n = 6; controls, n = 6). (C) The sizes of CFU-GM, BFU-E, and CFU-Mix in presence of the cocultured supernatants from AA patients (ii,iv,vi) were significantly smaller than those from controls (i,iii,v). *P < .05; **P < .001.
Defective immunosuppression by AA Tregs contributed to impaired hematopoiesis in vitro. (A-B) Percentages of improvement of the numbers of CFU in presence of the supernatants obtained from the cocultured systems (AA patients, n = 6; controls, n = 6). (C) The sizes of CFU-GM, BFU-E, and CFU-Mix in presence of the cocultured supernatants from AA patients (ii,iv,vi) were significantly smaller than those from controls (i,iii,v). *P < .05; **P < .001.
Discussion
Recently, it has been shown that defective immune homeostasis between regulatory T cells and effector T cells plays an important role in AA.4,5,13 As the key lymphocyte subpopulation in the induction of immune tolerance, Tregs are believed to control development and progression of autoimmunity by suppressing autoreactive T cells. Accumulating data provided evidence that impaired function of CD4+CD25+ Tregs contributed to the development of autoimmunity diseases, such as autoimmune hepatitis,22,23 type 1 diabetes,34 multiple sclerosis,35 rheumatoid arthritis,36 and systemic lupus erythematosus.37 But little is known regarding the function of Tregs in AA because of the attack of autologous T cells on BM hematopoietic progenitors.
Mechanisms of impaired Treg regulation in the setting of human autoimmune diseases included 3 categories: inadequate of numbers of Tregs; defects in Treg function; and resistance of effector T cells to suppression of Tregs.8 Previous data have shown inadequate numbers of PB Tregs in patients with AA.13 But there is no evidence so far obtained to answer whether the defects in Treg function or resistance of effector T cells is the key point in the out-of-balance immune homeostasis. Our study revealed several impairments of Tregs in AA, including decreased frequencies of Tregs in PB and BM, reversed ratio of Treg frequencies of BM versus PB, the abnormality of migratory potential, defective immunosuppression on effector T cells in vitro which could contribute to impaired hematopoiesis, and less inhibition of Th1 response cytokine production.
To function properly, Tregs must modulate the activities of a wide variety of effector T cells by cell-contact inhibition, which depends on their ability to move into physical proximity with their targets by migrating to specific tissue and microenvironment.10,27,28 So, the ability of Treg homing to BM, the main target organ attacked by effector T cells in AA, plays a critical role in immunosuppression for autoreactive effector T cells. Recent studies have revealed the importance of different homing receptors for the appropriate tissue distribution and function of Tregs.38–40 CXCR4 was confirmed as the specific trafficking receptor responsible for Treg homing to BM,15 a significant reservoir for CD4+CD25+ regulatory T cells that traffics through the SDF-1α/CXCR4 signal.14 But the significance of CXCR7 expression, a newly identified receptor of SDF-1α,16,17 in Tregs is uncertain. Our data demonstrated that the levels of SDF-1α were similar between AA patients and controls in BM fluids, and healthy Tregs had the equivalent migration abilities toward BM fluids from AA patients or controls. These data excluded the possibility that abnormal secretion of SDF-1α resulted in the decreased migratory potential in AA. Further studies demonstrated that lower CXCR4 expression (but not for CXCR7 expression) instead of abnormal attenuation of chemotactic signals from BM was responsible for the impaired migration ability of Tregs from AA patients. Interestingly, our data showed that the impaired migratory potential of Tregs from AA correlated with disease severity, which provided further evidence that the impaired migratory potential of Tregs contributed to the severity of destruction of hematopoietic progenitor/stem cells by autoreactive effector T cells because of less immunosuppressive strength in BM. Logically, a Treg-enhanced immunosuppressive strategy might alleviate the disease severity and be beneficial to improve hematopoietic recovery, which was supported by the fact that antithymocyte globulin could promote expansion of functional Tregs in vitro.41,42 In addition, Tregs from AA patients had less capacity to suppress proliferation and cytokine production by autologous effector T. Our study provided strong evidence that the impaired Treg-mediated immunosuppression was because of intrinsic defects in Tregs, rather than resistance of effector T cells. We herein speculated that it was the impaired Tregs (but not for effector T cells) that played a more critical role in the pathophysiology of AA.
Different from the mechanisms of effector T-cell resistance, the functional mechanisms of Tregs were more complex and still incompletely understood because of Tregs using a variety of immunosuppressive mechanisms to regulate immune response, and the choice of mechanisms seemed to be influenced by both the tissue site and the character of the immune response. So, it is difficult to accurately probe the intrinsic defects of Tregs in human autoimmunity diseases. The majority of results about Treg defects were obtained from animal models, such as Treg activity controlled by T-bet, interferon regulatory factor 4 (IRF4), signal transducer and activator of transcription 3 (STAT3).10 The latest data in mice provided evidence that suppressor of cytokine signaling 1 (SOCS1)43 and GATA-344 were essential for Treg function by preventing loss of FoxP3 expression as well as Th1 and Th17 response. Solomou et al also found decreased transcription factor NFAT1 expression could explain low FoxP3 expression and diminished Treg frequency in AA.13 In line with the data from proliferation and suppression assays, AA Tregs could not inhibit IFN-γ production and had significantly less capacity to improve hematopoietic recovery, which further strengthened the evidence of intrinsic defects of Tregs in BM failure.
In conclusion, our study provided powerful evidence that impairment of Tregs—including decreased frequencies in PB and BM, less migration capacity, and defective immunosuppression—could contribute to impaired hematopoiesis conducted by effector T cells in vitro in AA. Thus, patients with AA might greatly benefit from a Treg-oriented immunosuppressive strategy.
The publication costs of this article were defrayed in part by page charge payment. Therefore, and solely to indicate this fact, this article is hereby marked “advertisement” in accordance with 18 USC section 1734.
Acknowledgments
The authors thank all of the doctors and nurses in the Therapeutic Center of Anemic Diseases and the researcher team of the Clinical Laboratory Center for their professional assistance.
This work was supported by a grant from the National Basic Research Program of China (no. 2011CB964800), a grant from the National Natural Science Foundation of China (no. 30800495) and a grant from the Tianjin Municipal Science and Technology Commission (no. 10JCZDJC19500).
Authorship
Contribution: J.S. and M.G. contributed equally to this work to design research, analyze and interpret data, and write the manuscript; M.G., S.L., and X.L. performed the experiments and analyzed the data; Y.S., J.H., Z.H., J.Z., and N.N. contributed to data collection and sample preparation; and Y.Z. contributed to the design of the research and the writing of the manuscript as well as to the approval of the final manuscript.
Conflict-of-interest disclosure: The authors declare no competing financial interests.
Correspondence: Yizhou Zheng, MD, PhD, Severe Aplastic Anemia Studying Program, State Key Laboratory of Experimental Hematology, Institute of Hematology & Blood Diseases Hospital, Chinese Academy of Medical Science & Peking Union Medical College, 288 Nanjing Rd, Tianjin 300020, People's Republic of China; e-mail: zheng_yizhou@hotmail.com.
References
Author notes
J.S. and M.G. contributed equally in this study and should be considered co-first authors.

