Abstract
The developmental origin of IFN-producing plasmacytoid dendritic cells (pDCs) has been uncertain. In the present study, we tracked the development of pDCs in cultures of BM precursors stimulated with Flt3 ligand. Common myeloid precursors (CMPs) produced both conventional DCs (cDCs) and pDCs via the DC-restricted common DC precursor. Common lymphoid precursors (CLPs) produced only a few cDCs with variable efficiency, but produced pDCs via a transient intermediate precursor with B-cell potential. The pDCs of both origins produced IFN-α when stimulated with CpG oligonucleotides. The pDCs of CLP origin showed evidence of past RAG1 expression and had D-J rearrangements in IgH genes. Most pDCs and all cDCs of CMP origin lacked these signs of a lymphoid past. However, in these cultures, some pDCs of CMP origin showed evidence of past RAG1 expression and had D-J IgH gene rearrangements; most of these derived from a subset of CMPs already expressing RAG1.
Key Points
One cell type can develop from multiple pathways.
Cells that have developed from different routes perform similar functions, but can be told apart by the molecules they once expressed.
Introduction
Plasmacytoid dendritic cells (pDCs) are a subset of DCs that circulate through the blood and peripheral tissues.1,2 After activation, pDCs develop dendritic processes, up-regulate expression of major histocompatibility (MHC) class II molecules, and become APCs. Further, on activation, they secrete type 1 IFN and are therefore also known as IFN-producing cells. Despite their classification as DCs, pDCs have many of the attributes of B cells, including the expression of several surface receptors, use of similar antigen presentation machinery, and similar morphology in the unstimulated state.3-5
The developmental origin of pDCs has long been unclear. Early studies showed that both common myeloid progenitors (CMPs) and common lymphoid progenitors (CLPs) had the potential to produce pDCs after transfer into irradiated mice,6,7 but it was unclear whether these potentials were expressed in steady state. Similar potential has been found in CLPs and CMPs from human cord blood.8 Later it was shown that some pDCs in the BM and spleen of unmanipulated mice expressed recombination activating gene 1 (RAG1)9 and possessed D-J rearranged genes at the IgH locus.9,10 Such gene rearrangement events have been considered as indicators of a lymphoid developmental history. A recent study described a cell-intrinsic requirement for IL-7 signaling in the development of a subset of both splenic cDCs and pDCs, and concluded that some DCs were of lymphoid origin.11 These results suggested that the pDCs found in normal mice had 2 different origins: myeloid and lymphoid progenitors.
Conversely, in a subsequent study, IgH gene rearrangements were found in pDCs derived after transfer from CMPs and CLPs.12 The investigators concluded that the IgH gene rearrangements were not necessarily markers of a lymphoid developmental history, but rather an accidental by-product of the similarity in transcriptional programs between B cells and pDCs. In addition, a precursor restricted to production of pDCs and conventional DCs (cDCs), termed a common dendritic cell precursor (CDP) or pro-DC, has been isolated from BM.13,14 The CDP is downstream of the CMPs13 and so is considered a myeloid lineage cell. As a result of these findings, only the myeloid origin of pDCs tends to be considered at present.
To investigate in detail the pathway of pDC differentiation, in the present study, we used a BM culture system driven by fms-like tyrosine kinase 3 ligand (FL).15-17 We have previously demonstrated that this system models the pathway of steady-state spleen DC development, including production of pDCs and cDCs from a CDP intermediate.14 We now combine RAG1 gene expression and IgH gene rearrangement analysis with the isolation of distinct intermediate precursors to demonstrate the existence of separate myeloid and lymphoid pathways, both leading to cells that would be classified as pDCs based on their surface phenotype and capacity to produce IFNα. We found that although the CMP fraction includes a proportion of precursors expressing RAG1 and produces some pDCs with D-J gene rearrangements, most D-J–rearranged pDCs appear to derive from lymphoid committed precursors.
Methods
Mice
Unless otherwise indicated, experiments were performed using C57BL/6J Wehi (CD45.2) mice 6-12 weeks of age. Where indicated, C57BL/6-RAG1tm1/lmku (RAG1-GFP) or C57BL/6JTG30Scha/J (UBC-GFP) mice were used as the source of precursors. C57BL/6 Pep3b (CD45.1) mice were used as the source of BM feeder cells for cultures. Mice were bred under specific pathogen-free conditions at The Walter and Eliza Hall Institute in accordance with the guidelines of the animal ethics committee.
mAbs
Unless otherwise stated, Abs were generated, purified, and conjugated in house. The mAb hybridoma clones used were: CD2 (RM2-1), CD3 (KT3), CD8 (YTS169.4 or 53-6.7), CD19 (1D3), CD45R (RA36B2), CD45RA (14.8), CD11b (M1/70), TER119 (TER119), CD45.1 (A20.1), CD45.2 (S450-15.2), CD11c (N418), F4/80 (F4/80), sca-1 (E13 161-7), c-kit (ACK2), flt3 (A2F10.1), BST-2 (120G8), CD34 (RAM34), CD127 (A7R34), and CD16/32 (2.4G2). The mAbs were conjugated to one of the following fluorochromes (from Molecular Probes): biotin; phycoerythrin (PE); Alexa Fluor 594 (Alexa594); Alexa Fluor 633 (Alexa633); Alexa Fluor 680 (Alexa680); phycoerythrin-cyanine 7 (PECy7); peridinin chlorophyll protein cyanine 5.5 (PerCP-Cy5.5); FITC or allophycocyanin (from Prozyne). The commercially produced mAb conjugates used were: A2F10.1 (flt3)-PE and 53-6.7 (CD8α-PerCP-Cy5.5; BD Biosciences). The mAbs were titrated on spleen cells or purified DCs to determine the optimal staining concentration.
Isolation of precursor cells from BM
Erythrocytes, dead cells, and dense cells were first eliminated from BM cell suspensions by centrifugation in Nycodenz (Nycomed Pharma) medium (1.086 g/cm3, 4°C, mouse osmolarity). The BM cells were then coated with mAb against the lineage antigens CD2, CD3, CD8, CD19, CD45R, CD11b, TER119, and Ly6G. For isolation of the pDC/B-cell progenitors, the cells were coated with mAbs against CD3, CD11b, CD19, TER119, and Ly6G. The cells were then incubated with sheep anti–rat IgG magnetic beads (QIAGEN) at 8 beads/cell. The beads were removed using a magnet and unbound cells were stained for specific precursor cells. Nonspecific binding was blocked with polyclonal rat Ig, and if CD16/32 was not used for sorting, with anti-CD16/32 before staining. Progenitors were sorted as follows: LSK cells, lin−c-kit+sca-1+; CMPs, lin−c-kit+sca-1−CD16/32lowCD34+; and CLPs, lin−CD127+c-kitintsca-1+. The purity of precursors ranged from 95%-96%. The absence of lineage marker bearing cells was verified by staining with anti–rat Ig. Propidium iodide was included in the final stains to gate out dead cells.
Precursor isolation from culture
CDPs were isolated from culture as described previously.14 BM was labeled with CFSE (Molecular Probes) or PKH-26 (Sigma-Aldrich) and cultured with flt3L (FL; 200 ng/mL). After 3.5 days, light-density cells were isolated by centrifugation in Nycodenz medium (1.086 g/cm3); coated with biotinylated Abs against CD19, Ly6G, CD127, MHC class II, CD11c, Ly6C, and TER119; incubated with anti-biotin magnetic beads; and then removed using a MACS magnetic column (Miltenyi Biotec). The depleted fraction was incubated with streptavidin-PE.Cy7 or streptavidin-PerCPCy5.5. CDPs were sorted as PECy7− or PerCPCy5.5− and CFSElow or PKH-26low. For isolation of the pDC/B-cell precursors from cultures, CLPs were isolated and cultured with CD45.1 feeder cells and FL (200 ng/mL). After 2 days, precursors were sorted as CD45.2+CD45.1−CD11c−BST-2+.
FL-stimulated BM culture systems for pDC development
Cells extracted from the femur and tibia bones were briefly exposed to red cell removal buffer, resuspended in 10 mL of RPMI 1640-FCS, washed by centrifugation, and then passed through a sieve. Where indicated, preexisting pDCs were first removed from the BM by incubating the cells with anti–BST-2 and then eliminating the coated cells with anti-Ig magnetic beads. Cells were suspended in culture medium at 1.5-3 × 10⁶ cells/mL with FL (200 ng/mL).
Clonal assays
LSK progenitors or CDPs from UBC-GFP mice were sorted from BM or 3.5-day BM cultures.14 Single cells were deposited by a FACSDiva into each well of a 96-well U-bottom culture plate containing wild-type GFP− feeder cells (750 culture-derived CDP in 0.2 mL of 3-day conditioned medium or 0.3 × 10⁶ BM cells in 0.2 mL of fresh medium with 200 ng/mL of FL). After 5 days (CDPs) or 8 days (LSK cells), wells were screened under UV light for the presence of GFP+ progeny. Wells with detectable GFP+ cells were harvested and the entire contents of the well stained.
Reculture of isolated precursors
Progenitors were isolated (see “Isolation of precursor cells from BM”) and added to erythrocyte-depleted CD45.1 BM to a final concentration of 1.5 × 10⁶ cells/mL, then cultured with FL as described in “FL-stimulated BM culture systems for pDC development.” After 5 days, cells were analyzed by flow cytometry for the presence of CD11c+CD45RA− or BST-2−cDCs and CD11c+CD45RA+ or BST-2+ pDCs. Progenitor-derived cells were identified as CD45.1−CD45.2+.
Adoptive transfers for pDC generation and assessment of developmental potential
CLPs or downstream precursors were isolated from C57BL/6 BM as in “Isolation of precursor cells from BM” and IV injected into irradiated CD45.1 recipients. After 6 or 14 days, spleen and BM was harvested and analyzed by flow cytometry for CD3+ T cells, CD19+CD24+ B cells, CD11c+SiglecH− cDCs, CD11cintSiglecH+ pDCs, and CD49b+CD161c+ natural killer (NK) cells. Donor-derived cells were identified as CD45.2+CD45.1−. Appropriate gating was determined by reference to the CD45.1+CD45.2− host cell progeny. For assessment of IFNα production, CLP-derived splenic pDCs were sorted at day 14 as CD45.2+CD11c+BST-2+.
Culture system for B-cell development
OP9 cells (4000) were plated into wells of 96-well flat-bottomed culture plates. Progenitors (< 1000) were cultured in modified MEM with 50mM β-mercaptoethanol, 10% FCS, 5 ng/mL of FL, and 2% of the supernatant of an IL-7–producing line. Cultures were harvested at 7 days and analyzed for CD19+ B cells, CD11c+BST-2− cDCs, and CD11c+BST-2+ pDCs.
Culture system for NK cell development
OP9 cells (80 000) were plated into wells of 24-well flat-bottomed culture plates and allowed to adhere. CLPs (2000) or up to 15 000 progenitors were cultured in IMDM with 50mM β-mercaptoethanol, 10% FCS, 50 ng/mL of IL-15, 50 ng/mL of SCF, and 5 ng/mL of FL. Half of the medium and the cytokines were replenished after 4 days of culture. Cultures were harvested at 6 and 14 days and analyzed for the presence of CD49b+NK1.1+ NK cells, CD11c+BST-2− cDCs, and CD11c+BST-2+ pDCs.
PCR analysis for IgH gene rearrangements
PCRs for IgH rearrangements were performed as described previously.18 Sorted cells were washed with PBS and resuspended at 106 cells/mL in PCR lysis buffer. Amplification of the RAG1 gene served as a template concentration control. DNA was titrated to give an equivalent amount of product in the control reactions and to ensure that reactions were performed within the linear range. D-J rearrangements were detected as amplified fragments of approximately 1033, 716, or 333 nucleotides depending on whether JH1, JH2, or JH3 was rearranged, respectively. PCR products were quantified using a PhosphorImager (Molecular Dynamics). PCR products were detected and quantified by Southern blotting and hybridization with the appropriate Ig gene probes.
Assay for IFNα production
Progenitors were isolated (see “Isolation of precursor cells from BM”) and recultured with FL and BM feeders (see “FL-stimulated BM cultures systems for pDC development”) or transferred into irradiated recipients. Progenitor-derived pDCs were sorted and recultured at 106 cells/mL with 0.5μM CpG2216 (Proligo). After 20 hours, culture supernatants were harvested and the concentration of IFNα analyzed by ELISA as described previously.19 The capture Ab was RMMA-1 (PBL Interferon Source). Polyclonal rabbit anti-IFNα (PBL Interferon Source) followed by anti–rabbit Abs conjugated to HRP was used for detection. The reaction was visualized by the addition of ABTS. The optical density was read with a kinetic microplate reader set to 405-490 nm (Molecular Devices). Cytokine concentrations were interpolated from a standard curve.
Results
Kinetics of pDC development
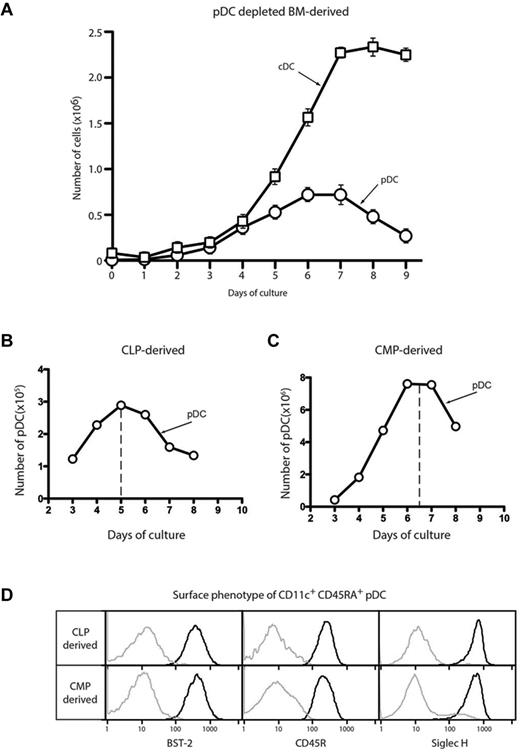
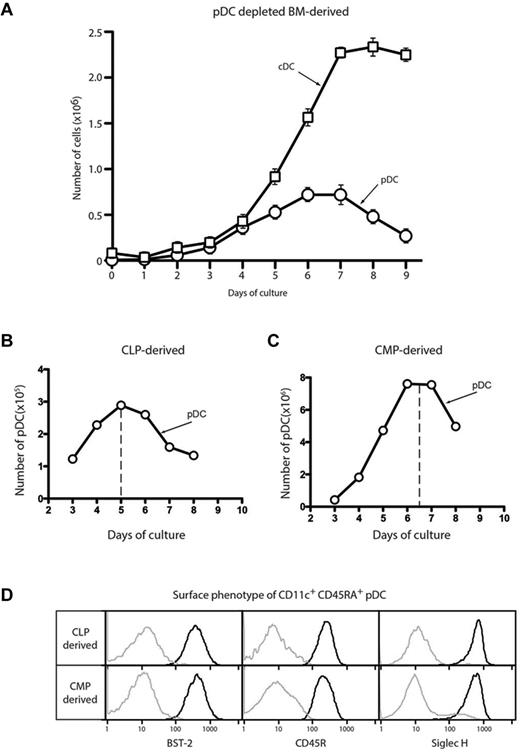
To investigate the development of pDCs in detail, we used FL-driven BM cultures that model steady-state DC development. We determined the kinetics of new pDC production from total BM that had been depleted of BST-2+ cells to remove the population of preexisting pDCs. The peak of pDC production occurred at day 6, earlier than the peak of cDC production at day 8 (Figure 1A). We demonstrated previously that CDP numbers peak at day 3 in these cultures.14 Peak production of cDCs from CDPs occurred at day 5 on reculture, consistent with these precursors being the source of the day 8 cDC peak in the standard cultures. Although pDCs are produced on reculture of CDPs,14 the early peak of pDC development in the total BM cultures made it unlikely that this myeloid route via CDP was the only source of pDCs. We postulated that the pDCs produced in these cultures derived from both myeloid and lymphoid precursors, as has been suggested previously.7,9,10
Kinetics of pDC development in FL BM cultures. BM depleted of erythrocytes and BST-2+ cells (A), CLPs (B), or CMPs (C) were cultured with FL. The number of CD11c+CD45RA+ pDCs or CD11c+ CD45RA− cDCs was assayed each day by flow cytometry. (D) The CD11c+CD45RA+ pDC progeny of CLPs and CMPs sorted as in panels B and C were analyzed by flow cytometry for the expression of the pDC markers BST-2 (CD317), CD45R (B220), and Siglec H. Results are representative of 3 separate experiments.
Kinetics of pDC development in FL BM cultures. BM depleted of erythrocytes and BST-2+ cells (A), CLPs (B), or CMPs (C) were cultured with FL. The number of CD11c+CD45RA+ pDCs or CD11c+ CD45RA− cDCs was assayed each day by flow cytometry. (D) The CD11c+CD45RA+ pDC progeny of CLPs and CMPs sorted as in panels B and C were analyzed by flow cytometry for the expression of the pDC markers BST-2 (CD317), CD45R (B220), and Siglec H. Results are representative of 3 separate experiments.
To investigate whether these results might explain the kinetics of pDC development, we isolated CLPs20 and CMPs21 from BM according to the surface markers originally described and analyzed the kinetics of DC generation from each precursor. CMPs produced both cDCs and pDCs. The main peak of pDC production from CMPs occurred at day 7 (Figure 1B), which is consistent with a myeloid pathway in which CMPs give rise to CDPs, which in turn produce both pDCs and cDCs. In contrast, CLPs produced predominantly pDCs and the peak of production occurred earlier, at day 5 (Figure 1C), suggesting that such a lymphoid pathway might be responsible for many of the pDCs generated in these cultures. cDC production from CLPs varied greatly (data not shown), ranging from undetectable to 15% of the total DC progeny. The pDCs produced from both precursors displayed the typical pDC surface phenotype, namely expressing high levels of CD11c, BST-2 (CD317), CD45R (B220) and CD45RA, and Siglec H (Figure 1D). These markers were subsequently used interchangeably to define pDCs depending on particular fluorochrome and mAb staining combinations. Therefore, in this model of steady-state DC development, pDCs developed via both lymphoid and myeloid intermediates.
Production of pDC clones
We previously devised a clonal assay in which single green fluorescent protein (GFP)–expressing precursors were cultured with FL and BM feeder cells to assay the developmental potential of the different precursors.14 Using this assay, we compared clones derived from CDPs (DC-restricted, late myeloid precursors) with those derived from LSK cells (enriched for early multipotent precursors). We found that whereas 25% of the DC clones derived from CDPs contained pDCs, almost all of these included cDCs (Table 1). However, when LSK cells were used as precursors, giving the possibility of both myeloid and lymphoid developmental options, DC clones consisting of only pDCs were prevalent. Of the 77% of DC clones containing pDCs, almost 10% contained only pDCs (Table 1). We reasoned that these pure pDC clones must have been generated from a pathway not involving the CDP intermediate, likely a lymphoid pathway. However, single CLPs showed too low a cloning efficiency for analysis by this assay.
Immediate pDC precursor on the lymphoid pathway
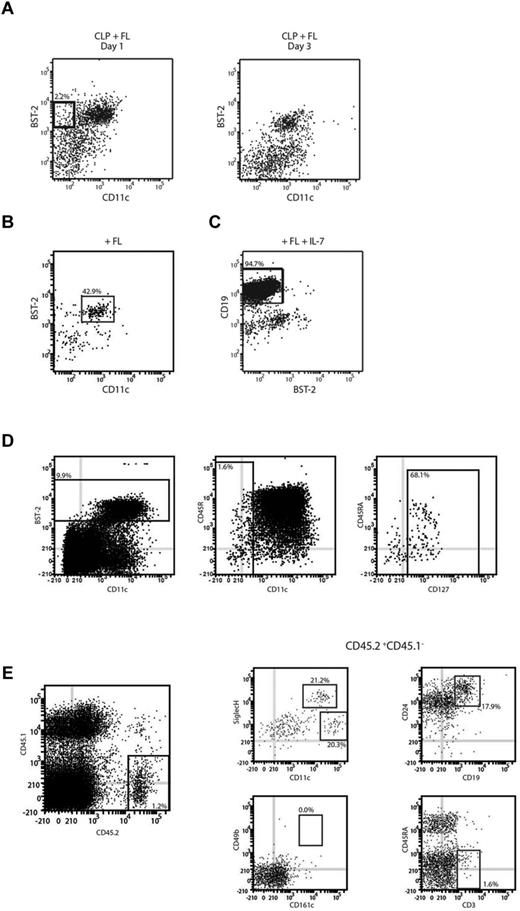
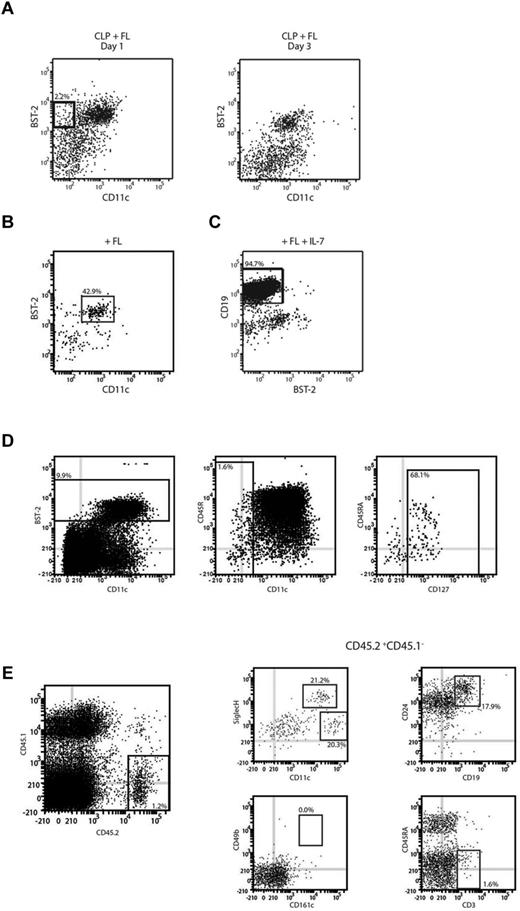
Because we had found that CLPs gave rise to pDCs in FL BM cultures, we attempted to map this lymphoid pathway downstream of the CLPs. CLPs were isolated from BM and cultured with FL and the cultures analyzed at various time points to determine intermediate stages en route to pDCs. We noted the emergence after 1-2 days, then disappearance by 3 days, of a population that differed from CLPs in expressing BST-2, a pDC marker, but did not yet express the pan-DC marker CD11c (Figure 2A). To determine the fate of this CD11c−BST-2+ CLP-derived population, it was sorted from cultures at day 2 and then recultured with FL. After 1-2 days of reculture, CD11c+BST-2+ pDCs appeared and constituted most of the cells recovered, although a minor population of cDCs was also produced (Figure 2B). However, it was not clear whether all cells with the CD11c−BST-2+ phenotype were engaged in pDC production. Because CLPs are efficient progenitors of B cells and NK cells, we investigated whether the CLP-derived, CD11c−BST-2+ population retained this potential. The precursors were isolated from cultures and then recultured under conditions known to be optimal for the generation of B cells or NK cells. After 7 days of culture, these precursors produced B cells (Figure 2C). However, the progeny of the CD11c−BST-2+ progenitors were uniformly CD49b−NK1.1−, indicating a lack of NK cell potential (data not shown). Under the same conditions, CLPs efficiently gave rise to CD49b+NK1.1+CD161c+ NK cells.
Identification of intermediate CLP-derived pDC precursors. (A) The transient pDC precursor. CLPs were cultured with FL for 1-2 days. CLP-derived cells were analyzed for expression of the DC markers BST-2 and CD11c. (B) pDC products of this precursor. CD11c−BST-2+ cells were sorted after 2 days of culture, recultured with FL, and analyzed after 2 days for the presence of CD11c+BST-2+ pDCs. (C) B-cell products of this precursor. CD11c−BST-2+ precursors were sorted and cultured on OP9 stromal cells with IL-7 and FL. Progeny were analyzed after 7 days for the presence of CD19+ B cells. (D) An equivalent precursor population in BM. BM from C57Bl/6 was depleted for a selection of lineage antigens (CD3, CD11b, CD19, TER119, and Ly6G) and then BST-2+CD11c−IL-7Rα+ cells were sorted from the lin− BM. (E) In vivo products of this BM precursor. The sorted cells were adoptively transferred into lethally irradiated CD45.1 recipients. Six to 14 days after transfer, recipient spleens were analyzed for the presence of CD45.2+ donor-derived cells and within the donor-derived cells for the presence of Siglec H+CD11cint pDCs, Siglec H−CD11chigh cDCs, CD24+CD19+ B cells, CD49b+CD161c+ NK cells, and CD3+ T cells. Results represent the peak responses at day 6 for DCs and at day 14 for lymphoid cells. Results are representative of 5 (A), 3 (B), or 2 (C-E) independent experiments.
Identification of intermediate CLP-derived pDC precursors. (A) The transient pDC precursor. CLPs were cultured with FL for 1-2 days. CLP-derived cells were analyzed for expression of the DC markers BST-2 and CD11c. (B) pDC products of this precursor. CD11c−BST-2+ cells were sorted after 2 days of culture, recultured with FL, and analyzed after 2 days for the presence of CD11c+BST-2+ pDCs. (C) B-cell products of this precursor. CD11c−BST-2+ precursors were sorted and cultured on OP9 stromal cells with IL-7 and FL. Progeny were analyzed after 7 days for the presence of CD19+ B cells. (D) An equivalent precursor population in BM. BM from C57Bl/6 was depleted for a selection of lineage antigens (CD3, CD11b, CD19, TER119, and Ly6G) and then BST-2+CD11c−IL-7Rα+ cells were sorted from the lin− BM. (E) In vivo products of this BM precursor. The sorted cells were adoptively transferred into lethally irradiated CD45.1 recipients. Six to 14 days after transfer, recipient spleens were analyzed for the presence of CD45.2+ donor-derived cells and within the donor-derived cells for the presence of Siglec H+CD11cint pDCs, Siglec H−CD11chigh cDCs, CD24+CD19+ B cells, CD49b+CD161c+ NK cells, and CD3+ T cells. Results represent the peak responses at day 6 for DCs and at day 14 for lymphoid cells. Results are representative of 5 (A), 3 (B), or 2 (C-E) independent experiments.
We then investigated whether an equivalent of these progenitors existed in vivo. Within BM, the site of pDC production, we found a population of lin−BST-2+CD11c− cells constituting 0.15% of the BM. Most of these also expressed IL-7Rα, suggesting that they were lymphoid derived (Figure 2D). To determine whether these cells were developmentally distinct from CLPs, we adoptively transferred them into lethally irradiated congenic recipients. Very few progenitor-derived cells were detectable in recipient BM between day 6 and 14 after transfer, but within the spleen we found progenitor-derived pDCs, B cells, and some cDCs (Figure 2E). No significant production of NK cells was seen at any time point, but a marginal production of T cells was seen at day 14. Overall, the BM CD11c−BST-2+IL-7Rα+ progenitors, like their culture derived counterparts, maintained the B-cell and DC potential of CLPs, but lost much of their ability to give rise to other lymphoid lineages, suggesting a tight developmental lineage between these pDCs and B cells.
Both CMPs and CLPs give rise to pDCs with a history of RAG1 expression
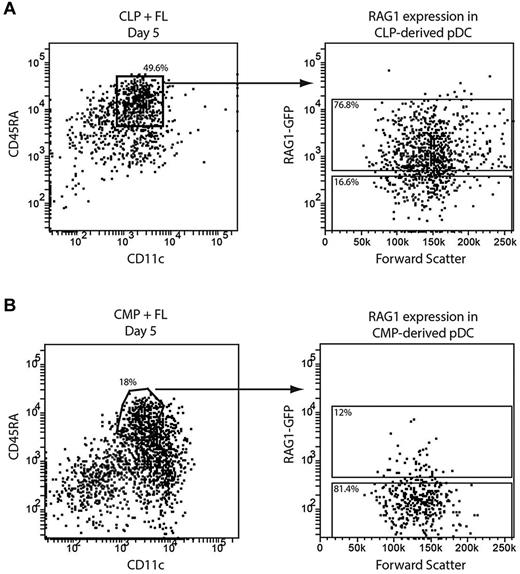
The incidence of D-J IgH gene rearrangements and a history of RAG1 expression suggested that some pDCs in steady state were of lymphoid origin.9,10 However, this was called into question by the finding that some CMP-derived pDCs also have IgH gene rearrangements.12 To determine whether the culture generated pDCs from both lymphoid and myeloid sources showed the “lymphoid” characteristic of recent RAG1 expression, we isolated CMPs and CLPs from the BM of RAG1-GFP reporter mice. Cells expressing RAG1 show strong GFP fluorescence when RAG1 is expressed, although this declines once RAG1 expression ceases. The CD45.2 progenitors were cultured with congenic CD45.1 BM feeder cells and FL and their progeny were analyzed after 5 days of culture for GFP expression.
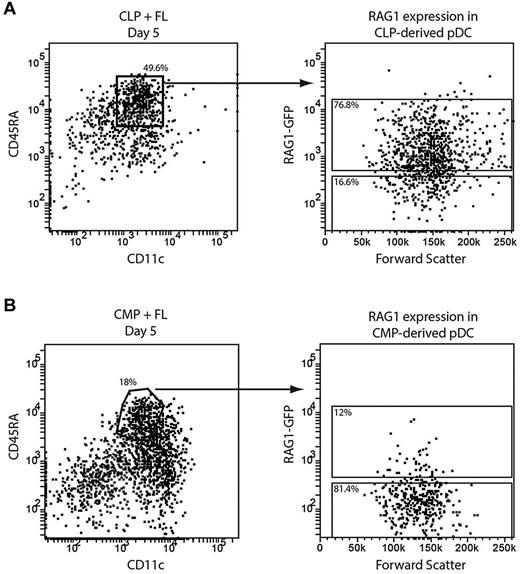
CLP-derived pDCs uniformly showed some level of GFP expression (Figure 3A), indicating that at some point in their developmental history they had expressed RAG1. Interestingly, whereas most CMP-derived pDCs were GFP−, a subset had detectable GFP expression (Figure 3B). Therefore, in agreement with the analysis of IgH gene rearrangements,12 some pDCs derived from a myeloid precursor showed a marker traditionally associated with development from a lymphoid precursor.
RAG1 expression in pDCs from lymphoid and myeloid progenitors. CLPs (A) or CMPs (B) were isolated from the BM of RAG1-GFP reporter mice and cultured with FL and congenic BM feeder cells. After 5 days, pDCs were identified as CD11c+CD45RA+ and their GFP expression assessed by flow cytometry. Results are representative of 2 (A) or 6 (B) independent experiments.
RAG1 expression in pDCs from lymphoid and myeloid progenitors. CLPs (A) or CMPs (B) were isolated from the BM of RAG1-GFP reporter mice and cultured with FL and congenic BM feeder cells. After 5 days, pDCs were identified as CD11c+CD45RA+ and their GFP expression assessed by flow cytometry. Results are representative of 2 (A) or 6 (B) independent experiments.
A history of RAG1 expression in pDCs indicates development from RAG1+ precursor
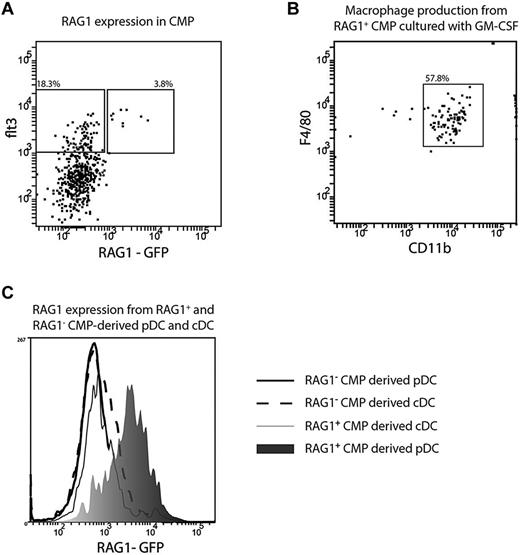
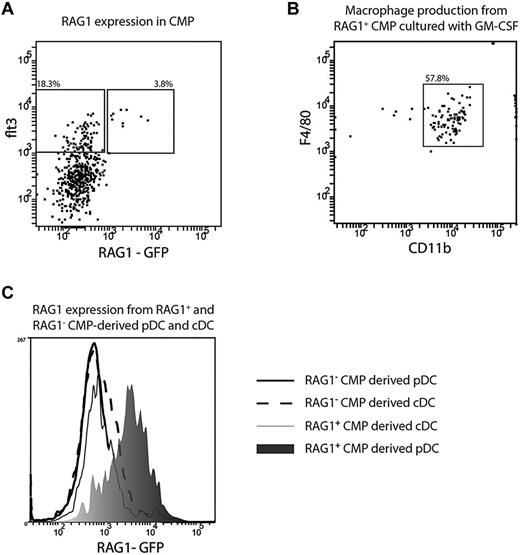
The CMP-derived pDCs with a history of RAG1 expression may have “ectopically” activated RAG1 as a consequence of their transcriptional similarity with B cells, as was postulated previously.12 Alternatively, RAG1 may have already been expressed at the precursor stage. Although CMPs were originally described as being myeloid restricted, the original study by Akashi et al indicated a low frequency of B-cell progenitors in this fraction.21 Further, on adoptive transfer, CMPs give rise to some B cells.7 To investigate the possibility of a subset of CMPs with some lymphoid characteristics, we examined the CMPs from RAG1-GFP mice. We found both RAG1+ and RAG1− subsets within the CMP fraction and these were entirely within the Flt3-expressing fraction known to contain the DC precursors7 (Figure 4A). The RAG1+Flt3+ CMPs subset retained myeloid potential, because it produced macrophages with high efficiency after 7 days of culture with GM-CSF (Figure 4B), whereas CLPs did not produce any macrophages (data not shown). The Flt3+, RAG1+, and RAG1− subsets of CMPs were sorted and cultured with congenic BM cells and FL and the progeny DCs analyzed. Both subsets gave rise to both pDCs and cDCs. The cDCs derived from either subset had no detectable GFP fluorescence, indicating that any initial RAG1 expression had not persisted. However, the pDCs derived from the RAG1+ subset still had GFP expression, whereas the pDCs derived from the RAG1− subset had no detectable GFP fluorescence (Figure 4C). Therefore, a history of RAG1 expression in CMP-derived pDCs largely reflected development from a progenitor already expressing RAG1.
RAG1 expression in CMP and CMP-derived pDCs. CMPs were isolated from the BM of RAG1-GFP reporter mice and analyzed by for expression of flt3 and RAG1 (A), Flt3+ RAG1+ (B), or flt3+RAG1+ and flt3+RAG1− CMP were sorted from the BM of RAG1-GFP reporter mice and cultured with GM-CSF (B; 10 ng/mL) or FL (C). (B) Progeny were analyzed after 7 days and macrophages identified as CD11bhighF4/80+. (C) After 5 days, pDCs were identified as CD11c+ BST-2+ and cDCs identified as CD11c+BST-2−. The GFP expression of RAG1+ CMP-derived cDCs (light gray shaded histogram) and pDCs (dark gray shaded histogram) and RAG1− CMP-derived cDCs (dashed line) and pDCs (solid line) was analyzed by flow cytometry. Plots are representative of 5 (A), 2 (B), or 4 (C) independent experiments.
RAG1 expression in CMP and CMP-derived pDCs. CMPs were isolated from the BM of RAG1-GFP reporter mice and analyzed by for expression of flt3 and RAG1 (A), Flt3+ RAG1+ (B), or flt3+RAG1+ and flt3+RAG1− CMP were sorted from the BM of RAG1-GFP reporter mice and cultured with GM-CSF (B; 10 ng/mL) or FL (C). (B) Progeny were analyzed after 7 days and macrophages identified as CD11bhighF4/80+. (C) After 5 days, pDCs were identified as CD11c+ BST-2+ and cDCs identified as CD11c+BST-2−. The GFP expression of RAG1+ CMP-derived cDCs (light gray shaded histogram) and pDCs (dark gray shaded histogram) and RAG1− CMP-derived cDCs (dashed line) and pDCs (solid line) was analyzed by flow cytometry. Plots are representative of 5 (A), 2 (B), or 4 (C) independent experiments.
Most pDCs with IgH gene rearrangements derive from RAG1+ precursors
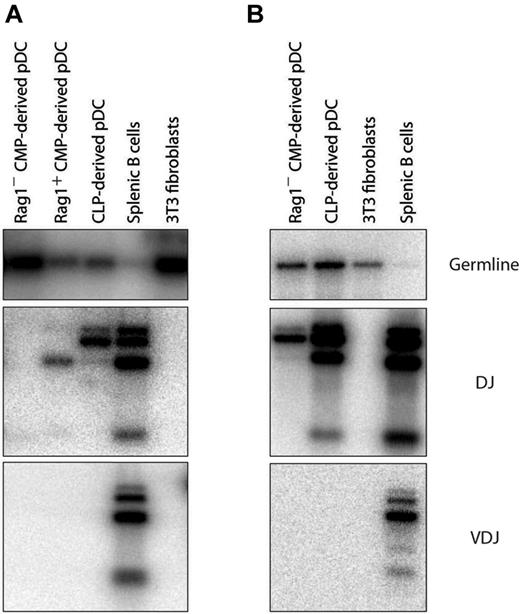
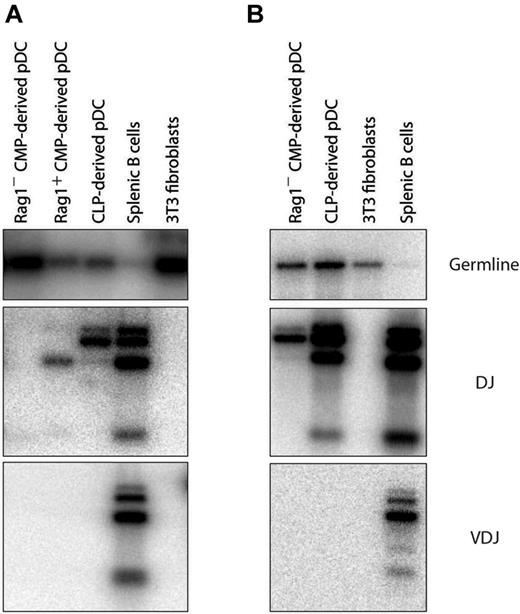
We had found in previous experiments that the DCs produced in our cultures were similar in IgH gene rearrangement status to the DCs from normal mouse spleen10 ; a proportion of the pDCs displayed D-J rearrangements, whereas the cDCs were all in the germline state. We had assumed that the D-J IgH gene rearrangements in pDCs indicated development from a lymphoid precursor, and such D-J rearrangements in pDCs were shown previously to be correlated with a history of RAG1 expression.9 However, in view of the finding of rearrangements in pDCs derived from CMPs,12 we reexamined this issue. CLPs, RAG1+ CMPs, and RAG1− CMPs were isolated and cultured with congenic BM cells and FL, and 5 days later the pDC progeny were sorted and analyzed by PCR for IgH gene rearrangements. The pDCs derived from CLPs always displayed D-J rearrangements in the IgH genes, but no V-D-J rearrangements (Figure 5A). The few pDCs derived from the RAG1+ CMPs also displayed D-J rearrangements. The pDCs derived from the RAG1− CMPs usually did not display D-J rearrangements (Figure 5A). However, in occasional experiments, D-J rearrangements were revealed, even in the pDCs from the RAG1− CMP fraction (Figure 5B). We suggest that this reflects a low frequency of rearrangement events not always detected with this nonquantitative PCR assay. We conclude that pDCs with D-J rearrangements in IgH genes are generally derived from progenitors already expressing RAG1, as had been suggested previously,9 but that the downstream process of pDC development does sometimes allow ectopic lymphoid-like rearrangement events, as also proposed previously.12
Gene rearrangements in pDCs from different sources. RAG1+ CMPs, RAG1 CMPs, or CLPs were cultured with congenic CD45.1+ total BM feeder cells and FL. Progenitor-derived pDCs were identified as CD45.1−CD45.2+CD11c+BST-2+ after 5 days. pDCs were analyzed by PCR for the presence of D-J rearrangements at their IgH locus. (A) More frequent result of no detectable rearrangement in pDCs from CMPs. (B) Occasional result of Ig gene D-J rearrangements in pDCs from CMPs.
Gene rearrangements in pDCs from different sources. RAG1+ CMPs, RAG1 CMPs, or CLPs were cultured with congenic CD45.1+ total BM feeder cells and FL. Progenitor-derived pDCs were identified as CD45.1−CD45.2+CD11c+BST-2+ after 5 days. pDCs were analyzed by PCR for the presence of D-J rearrangements at their IgH locus. (A) More frequent result of no detectable rearrangement in pDCs from CMPs. (B) Occasional result of Ig gene D-J rearrangements in pDCs from CMPs.
Type 1 IFN production by myeloid- and lymphoid-derived pDCs
The ability to produce large amounts of type 1 IFN when appropriately stimulated is a key characteristic of pDCs.1 The RAG1+ and RAG1− subsets of splenic pDCs had been found previously to differ in the quantity of IFNα that they produced after CpG stimulation,9 suggesting that developmentally distinct pDCs may differ in this function. The pDCs produced in vivo by adoptive transfer of CMPs and CLPs7 had not been tested for IFN production, so their identification as “true” pDCs had been questioned.12 Because in the present study, multiple pathways produced cells with a pDC surface phenotype, we examined whether these pDCs differed in this key function. The pDCs derived in culture from total BM, CMPs, CDPs, or CLPs were purified and then compared for their ability to produce IFNα in culture in response to CpG stimulation.
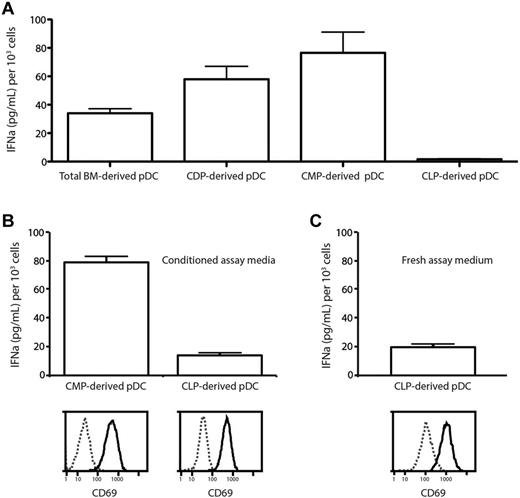
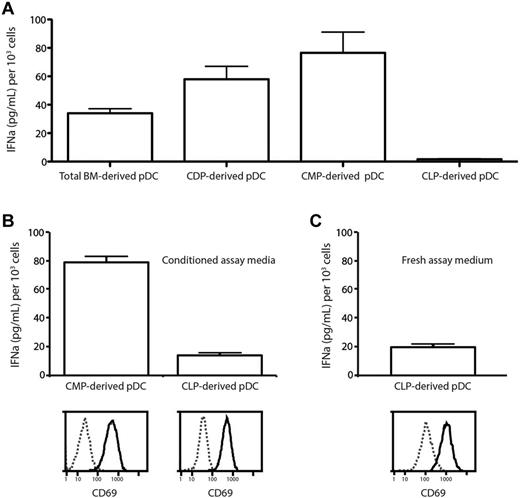
When the pDCs that developed in the FL-stimulated cultures were first tested by stimulation by CpG in fresh culture medium, the pDCs from total BM produced IFNα, the pDCs derived via the myeloid route from CMPs or CDPs produced higher levels of IFNα, but the CLP-derived pDCs appeared to be inactive (Figure 6A). However, the CLP-derived pDCs were found to be dead after overnight culture in the fresh medium of these assays, suggesting cell death due to the lack of some survival factor may have been the reason for the failure to produce IFNα. The capacity of CLP-derived pDCs to respond to CpG stimulation and produce IFNα was therefore tested under other conditions. Because the pDCs were viable in the original cultures, the CpG stimulation experiments were repeated in conditioned medium recovered from day-7 FL-stimulated BM cultures; this medium was found to be free of IFNα. The pDCs generated from both CLPs and CMPs survived under these reculture conditions and both responded to CpG stimulation by up-regulation of CD69, indicating that they had a functioning TLR9. Both then produced IFNα, although the CLP-derived pDCs produced less (Figure 6B). Despite showing a similar initial viability (92% for CLP-derived pDCs and 96% for CMP-derived pDCs based on propidium iodide exclusion), the CLP-derived pDCs showed reduced viability by the time of supernatant harvest (28% for CLP-derived pDCs compared with 67% for CMP-derived pDCs). This difference in viability may account for the difference in IFNα production. To confirm that pDCs developing by the lymphoid route in vivo were IFNα-producing cells, CLPs were purified and transferred into irradiated congenic recipients and the pDC progeny were isolated 7 days after transfer and tested for IFNα production after CpG stimulation in culture. These pDCs derived from CLPs in vivo up-regulated CD69 and produced IFNα, even when stimulated in fresh culture medium (Figure 6C). We conclude that pDCs derived from both myeloid and lymphoid routes are IFN-producing cells and so can be considered true functional plasmacytoid cells.
Differences in IFNαproduction by pDCs from different lineages. (A) Total BM cells, CMPs, CDPs, or CLPs from C57BL/6 BM were cultured with FL and CD45.1 total BM feeder cells. After 5 days, pDCs were sorted as CD11c+BST-2+ and cultured with CpG2216. After 20 hours, supernatant was harvested and analyzed by ELISA for the presence of IFNα. (B) CLPs and CMPs were cultured and the resulting pDCs at day 5 were isolated as in panel A. pDCs were recultured in medium collected from day-7 FL BM cultures with CpG2216. After 20 hours, supernatant was harvested and analyzed by ELISA for the presence of IFNα and pDCs were analyzed by flow cytometry for CD69 expression and viability by propidium iodide exclusion. At the time of harvest, 67% of CMP-derived pDCs but only 28% of CLP-derived pDCs remained viable. (C) CLPs were isolated from C57BL/6 BM and transferred into irradiated CD45.1 recipients. After 14 days, pDCs were sorted as CD11cintBST-2+ and cultured with CpG2216. After 20 hours, supernatant was harvested and analyzed by ELISA for the presence of IFNα. Results are pooled from 4 independent experiments (A) and from 3 independent samples from 1 experiment (B-C). Error bars show means ± SEM.
Differences in IFNαproduction by pDCs from different lineages. (A) Total BM cells, CMPs, CDPs, or CLPs from C57BL/6 BM were cultured with FL and CD45.1 total BM feeder cells. After 5 days, pDCs were sorted as CD11c+BST-2+ and cultured with CpG2216. After 20 hours, supernatant was harvested and analyzed by ELISA for the presence of IFNα. (B) CLPs and CMPs were cultured and the resulting pDCs at day 5 were isolated as in panel A. pDCs were recultured in medium collected from day-7 FL BM cultures with CpG2216. After 20 hours, supernatant was harvested and analyzed by ELISA for the presence of IFNα and pDCs were analyzed by flow cytometry for CD69 expression and viability by propidium iodide exclusion. At the time of harvest, 67% of CMP-derived pDCs but only 28% of CLP-derived pDCs remained viable. (C) CLPs were isolated from C57BL/6 BM and transferred into irradiated CD45.1 recipients. After 14 days, pDCs were sorted as CD11cintBST-2+ and cultured with CpG2216. After 20 hours, supernatant was harvested and analyzed by ELISA for the presence of IFNα. Results are pooled from 4 independent experiments (A) and from 3 independent samples from 1 experiment (B-C). Error bars show means ± SEM.
Discussion
The earlier findings that both CMP and CLP populations from mouse BM have the potential to produce pDCs on adoptive transfer to irradiated mice7 led to the original concept that pDCs might in steady state be produced by both myeloid and lymphoid routes. However, because both of these precursor populations show heterogeneity and isolated CMPs are able to produce some B cells on transfer to irradiated recipients,7,21 doubt may be cast on this interpretation. The presence of D-J–rearranged IgH genes in some but not all normal mouse spleen pDCs9,10 seemed to support the dual origin hypothesis, because these DNA changes serve as an indelible marker of a past rearrangement process normally restricted to lymphoid lineage cells. However, this has also been interpreted as an ectopic event that occurs even with a myeloid pDC origin12 because, in forming pDCs, transcriptional programs similar to those involved in B-cell development must be activated. In the present study, we used a culture system that produces DCs similar to those found in the spleen14 to demonstrate that separate pathways with separate intermediate precursors are involved in pDC development. We also reconcile the 2 interpretations of the origin of the D-J IgH gene rearrangements in pDCs.
One pathway to pDCs had already been documented by the detailed studies in this and other laboratories on DC development.13,14 It begins with myeloid precursors (CMPs) and proceeds via DC-restricted CDPs, which eventually produce both pDCs and cDCs. Another pathway we now delineate begins with lymphoid precursors (CLPs) and produces pDCs but few cDCs. This pathway proceeds via a precursor resembling a pro-B cell and produces pDCs and B cells but no NK cells and few T cells. The relative infrequency of these progenitors suggests they are a transient intermediate. Further, it is unclear whether all CLPs must transit through this intermediate en route to pDCs. Mice deficient in E2-2, a transcription factor essential for pDC development, accumulate within the BM a population of CD11c+BST-2− cells that were postulated to be an arrested stage in pDC development.22 This progenitor may represent a normal alternate intermediate between CLPs and pDCs; however, its appearance may also be an experimental artifact of the inability of these cells to express BST-2, a direct transcriptional target of E2-2.23 It should be noted that the CDPs and the transient pDC/B-cell precursors isolated from these cultures differ in surface phenotype and are the product of distinct developmental pathways, because CLPs could not give rise to CDPs in vivo.13 Both progenitors have equivalents in normal BM.
The results of the present study suggest that most pDCs with D-J IgH gene rearrangements have developed via a lymphoid route involving a lymphoid-restricted precursor such as the CLPs, as was suggested previously.9,10 However, we confirmed herein that some pDCs with D-J IgH gene rearrangements do arise from CMPs, as reported previously by Shigematsu et al.12 This led to our interesting finding of a small subset of RAG1-expressing Flt3+ precursors within the CMP fraction. Despite this lymphoid feature, these RAG1+ CMPs retained the myeloid potential of forming macrophages, so were functionally distinct from CLPs. We suggest that these cells represent the CMP subset able to produce some B cells in vitro and on adoptive transfer.7,21 Although we found that most pDCs arising via the myeloid, CMP to CDP route do not show a history of RAG1 expression and do not display IgH gene D-J rearrangements, a variant of the myeloid route involves RAG1 expression, leading to IgH gene rearrangements in some pDCs. RAG1 expression at the CMP stage may sometimes be transient, because it does not lead to persistent GFP fluorescence or IgH gene rearrangements in cDCs. This supports the concept proposed by Shigematsu et al that the similarity of gene activation profiles in B cells and pDCs allows ectopic gene rearrangement events during pDC development.12 Our present finding of very occasional D-J gene rearrangements even in pDCs derived from RAG1− CMPs is also consistent with this concept, because it suggests RAG1 expression and other requirements for gene rearrangement may be induced downstream of CMPs along the route to pDCs but not along the route to cDCs. Overall, these findings indicate substantial flexibility in the pathways leading to pDCs. It should be noted that BM from E2-2−/− mice fail to produce any pDCs in response to FL stimulation,22 suggesting that pDCs absolutely require E2-2 to develop, regardless of the pathway by which they differentiate.
In the model used in the present study, multiple separate pathways of hematopoietic development converge to produce cells that would be classified as pDCs. The important question is whether these pDCs products are identical aside from the DNA changes at the IgH locus. We found that they are similar in surface phenotype. We also found that all of the pDCs produced in our cultures were able to produce INFα in response to CpG stimulation regardless of whether they were of lymphoid or myeloid origin. Therefore, in addition to having the characteristic surface phenotype, they meet the main functional criterion of pDCs.
In the present study, we found that pDCs derived from CLPs appear to produce less IFNα in the assay cultures than pDCs derived from CMPs. Similar differences have been reported between RAG1+ and RAG1− pDCs from the spleen.9 In addition, there have been several recent reports of cells with a pDC surface phenotype that differ in their capacity to make IFNα.24-27 Important in this context is our finding herein of one set of conditions under which CLP-derived pDCs failed completely to produce IFNα, because of a high rate of pDC death. This reflected a requirement for a particular survival factor in the assay rather than an inability to produce IFNα. The results of the present study emphasize that differences in cytokine production between pDC populations may be because of differences in survival in the assay culture or slightly different maturation or activation states, rather than being due to fundamental functional differences. More extensive functional analysis and gene-expression profiling will be needed to determine whether there are any important functional differences between pDCs differing in lineage origin.
The publication costs of this article were defrayed in part by page charge payment. Therefore, and solely to indicate this fact, this article is hereby marked “advertisement” in accordance with 18 USC section 1734.
Acknowledgments
The authors thank M. Pritchard, L. Inglis, and E. Sutherland for animal husbandry; F. Battye and the flow cytometry facilities for cell sorting; and F. Ahmet for logistical support.
This work was supported by the National Health and Medical Research Council, Australia, and the University of Melbourne and was made possible through the Victorian State Government Operational Infrastructure Support and Australian Government (National Health and Medical Research Council of Australia Independent Research Institutes Infrastructure Support Scheme).
Authorship
Contribution: P.S. designed and performed the experiments and wrote the manuscript; D.V. and L.C. designed and performed the experiments; L.W. assisted with the experimental design and participated in discussions about the data; and K.S. designed the experiments and wrote the manuscript.
Conflict-of-interest disclosure: The authors declare no competing financial interests.
Correspondence: K. Shortman, 1G Royal Parade, Parkville VIC, Australia, 3051; e-mail: shortman@wehi.edu.au; or P. Sathe, 1425 Madison Ave, New York, NY; e-mail: priyanka.sathe@mssm.edu.

