Key Points
A motif associated with the gp41 loop region of HIV interacts with the T-cell receptor complex and inactivates antigen-specific T cells.
Abstract
Modulation of T-cell responses by HIV occurs via distinct mechanisms, 1 of which involves inactivation of T cells already at the stage of virus-cell fusion. Hydrophobic portions of the gp41 protein of the viral envelope that contributes to membrane fusion may modulate T-cell responsiveness. Here we found a highly conserved sequence (termed “ISLAD”) that is associated with the membranotropic gp41 loop region. We showed that ISLAD has the ability to bind the T-cell membrane and to interact with the T-cell receptor (TCR) complex. Furthermore, ISLAD inhibited T-cell proliferation and interferon-γ secretion that resulted from TCR engagement through antigen-presenting cells. Moreover, administering ISLAD (10 µg per mouse) to an experimental autoimmune encephalomyelitis (EAE) model of multiple sclerosis reduced the severity of the disease. This was related to the inhibition of pathogenic T-cell proliferation and to reduced pro-inflammatory cytokine secretion in the lymph nodes of ISLAD-treated EAE mice. The data suggest that T-cell inactivation by HIV during membrane fusion may lie in part in this conserved sequence associated with the gp41 loop region.
Introduction
HIV adopts several strategies to modify cellular pathways and to evade the immune response in order to infect and persist in the host.1-3 A remarkable example of this is the ability of HIV to modulate immune receptor signaling.3,4 The membrane-bound T-cell receptor (TCR) complex is 1 of the most complex receptor structures and plays a critical role in the proliferation, survival, and function of T cells.5 One basic and 2 acidic transmembrane residues are required for assembling each of the 3 CD3 signaling dimers (δ-ε, γ-ε, ζ-ζ) with TCRs.6,7 Specifically, the stable interactions between TCR-α and CD3 are localized to a short region within the transmembrane domain (TMD) of TCR-α, which consists of the essential basic amino acids Arg and Lys. The external addition of a core peptide (CP) derived from this TCR-α–TMD interferes with the assembly of the native TCR-CD3 complex and modulates TCR function.8 Studies have shown that HIV suppresses the immune response via several mechanisms. These include (1) interfering with the expression of the costimulatory molecules CD40 ligand and CD80 (B71);9 (2) inducing anergy in naive T lymphocytes through CD4-independent protein kinase A–mediated signaling;10 (3) inducing the dysfunction of uninfected bystander CD4+ T cells via interaction with both CD4 and coreceptors;11 (4) exposing CD4+ T cells during stimulation to noninfectious HIV with functional envelope protein (ENV), thus failing to provide activation signals to autologous dendritic cells (DCs);12 (5) inhibiting T-cell protein kinase C activity and intracellular calcium influx by the immunosuppressive unit (ISU) of the ENV;13,14 and (6) impairing DCs’ ability to stimulate T cells during HIV-1 infection.15
T-cell inactivation is already observed at the stage of HIV entry into T cells by membrane fusion.11,12 The entry step is mediated by the HIV ENV.16,17 ENV is composed of 2 noncovalently associated proteins, gp120 and gp41. The gp120 protein has an affinity to cell receptors and coreceptors, whereas the gp41 transmembrane protein facilitates the physical membrane fusion.18
The fusion peptide (FP) and the TMD of gp41 are hydrophobic portions of the protein19 that assist in lipid mixing and fusion.20,21 Because the membrane-bound TCR complex is located in the vicinity of the HIV fusion site,22 it is conceivable that FP and TMD can alter the function of the membrane-embedded portions of the TCR complex. Indeed, it has been shown that the FP and TMD modulate TCR complex signal transduction via different mechanisms.23,24 The gp41 loop region differs from the TMD and the FP because it is not a transmembrane segment. Nevertheless, the loop is 1 of the membranotropic portions of the protein25 and is structurally conserved in retroviruses.26 Importantly, emerging studies show that the loop region is involved in the actual lipid mixing step, thereby contributing to viral fusion.27,28 Therefore, we hypothesized that the loop region may modulate T-cell activity when bound to the T-cell membrane.
To investigate this hypothesis, we screened a database of all transmembrane ENVs of HIV and simian immunodeficiency virus (SIV) strains in search of highly conserved motifs within the loop region. Remarkably, such an element was discovered, which was associated with the loop. A peptide composed of the motif showed the inhibition of antigen-specific T cells both in vitro and in vivo. Thus, it was termed “immunosuppressive loop-associated determinant” (ISLAD). The mode of action and the specificity of ISLAD are addressed in the context of the events underlying HIV ENV–mediated T-cell fusion and pathogenesis.
Materials and methods
Detailed protocols of additional methods can be found in the supplemental methods.
Mice
C57Bl/6J mice were purchased from Jackson Laboratories (Bar Harbor, ME). All mice were 2 to 3 months old when used in the experiments. The Institutional Animal Care and Use Committee of the Weizmann Institute approved the experiments (permit number 03530710-3), which were performed in accordance with the relevant guidelines and regulations.
Cell lines
Antigen-specific T-cell lines were selected in vitro29 from primed lymph node cells derived from C57Bl/6J mice that had been immunized 9 days before with antigen (100 µg myelin peptide, MOG35-55) emulsified in complete Freund’s adjuvant (CFA) containing 150 µg Mycobacterium tuberculosis (Mt) H37Ra (Difco Laboratories, Detroit, MI). All T-cell lines were maintained in vitro in medium containing interleukin IL-2, with alternate stimulation with the antigen every 10 to 14 days. The human T-cell-line, Jurkat E6-1, was obtained through the AIDS Research and Reference Reagent Program, Division of AIDS, National Institute of Allergy and Infectious Diseases, National Institutes of Health, from Dr. Arthur Weiss.30 RAW264.7 macrophages were obtained from ATCC (ATCC TIB-71).
In vitro T-cell proliferative responses
T cells specific to MOG35-55 (mMOG35-55 T cells) were plated onto round, 96-well plates in medium containing RPMI-1640 supplemented with 2.5% fetal calf serum (FCS), 100 U/mL penicillin, 100 μg/mL streptomycin, 50 μM β-mercaptoethanol, and 2mM L-glutamine. Each of the 96 wells had a final volume of 200 μL and contained 20 × 103 T cells and 5 × 10⁵ irradiated (25 gray) syngeneic spleen cells as antigen-presenting cells (APCs), with or without 1 to 5 μg/mL of MOG35-55. In addition, the relevant HIV peptide was added. In order to exclude interaction between the examined peptides and the MOG35-55 antigen, we initially added the MOG35-55 antigen to the APCs in a test tube, and in a second test tube we added the examined peptides to the T cells. After 1 hour, the APCs were mixed with the T cells and were co-incubated for 48 hours in a 96-well, flat-bottomed plate. The T cells were pulsed with 1μCi (H3) thymidine, with a specific activity of 5.0 Ci/mmol and, after overnight incubation, the (H3) thymidine incorporation was measured using a Matrix 96 Direct β Counter (Packard Instrument, Meriden, CT). In several experiments, the T cells were directly activated with precoated CD3 and CD28 antibodies (LEAF-purified antimouse clones 145-2-C11 and 37.51, respectively, from Biolegend) at a final concentration of 2 µg/mL, or the T cells were activated with 50 ng/mL of PMA (phorbol 12-myristate 13-acetate) together with 1 μM of ionomycin (Sigma Chemical Co, Israel).
Induction of experimental autoimmune encephalomyelitis (EAE)
C57Bl/6J mice were injected subcutaneously at 1 site in the flank with 200 µL of emulsion containing MOG35-55 (200 µg), in CFA containing 300 µg Mt H37Ra. Mice received 300 ng pertussis toxin in 500 µL (phosphate-buffered saline) PBS in the tail vein immediately after and 48 hours after immunization. The HIV peptides were dissolved in PBS and added to the emulsion (0.5 mg/kg). Following the injection of the encephalitogenic inoculum, with or without HIV peptides, mice were observed and scored as previously described in Zhong et al.31
Ex vivo studies in mice
Mice were subcutaneously immunized with 150 μg MOG35-55 emulsified in CFA containing 150 μg Mt H37Ra with or without 0.5 mg/kg HIV peptides. Ten days after immunization, draining lymph nodes were removed and cultured in triplicate in the presence or absence of antigen, as previously described in Ben-Nun et al.32 The cultures were incubated for 72 hours at 37°C. [3H] thymidine (1 mCi per well) was added for an additional 16 hours of incubation, and the cultures were then harvested and counted using a β counter. Pro-inflammatory cytokine analyses of interferon-γ (IFN-γ), interleukin-12 (IL-12), and tumor necrosis factor-α (TNF-α) were determined by enzyme-linked immunosorbent assay (ELISA) 24 hours after cell activation, according to standard protocols from PharMingen (San Diego, CA), as described previously in Kaushansky et al.33
Colocalization of peptides with TCR molecules
Activated mMOG35-55 T cells (5 × 10⁴) were fixed with 3% paraformaldehyde for 20 minutes and washed with PBS. The cells were then treated with 10% FCS in PBS at room temperature to block unspecific binding. After 30 minutes, the cells were washed, and a rabbit anti–TCR-α polyclonal antibody (Santa Cruz Biotechnology, Inc) was added (1:100) in 2% FCS in PBS for 1 hour at room temperature. This was followed by the addition of rat anti-rabbit fluorescein isothiocyanate (FITC) antibody (1:100; Santa Cruz Biotechnology, Inc) for 40 minutes at room temperature. The rhodamine (Rho)-labeled fluorescent peptide was added during the last 10 minutes of incubation at a final concentration 1 µM. The cells were then washed with PBS and deposited onto a glass slide. The labeled cell samples were observed under a fluorescence confocal microscope (Olympus FV1000).
Immunoprecipitation of fluorescently labeled peptides with TCR
Jurkat T cells (4 × 10⁶) were incubated overnight at 37°C in the presence of 1 μM rhodamine-labeled ISLAD and lysed. The lysate was then incubated overnight with TCR-α or green fluorescent protein (GFP) antibodies (2 µg) following 2 hours of incubation with protein G-Plus Agarose beads (Santa Cruz Biotechnology Inc). Next, the beads were washed with lysis buffer and boiled for 10 minutes; the protein supernatant was then run in a 12% sodium dodecyl sulfate polyacrylamide gel electrophoresis (SDS-PAGE). The presence of co-immunoprecipitated peptide was detected by the Typhoon 9400 variable mode imager.
Statistical analysis
Data representing the means ± standard deviation (SD) or means ± standard error (SE) of the results were compared by one-tailed Student t test.
Results
Identification of a highly conserved motif in the transmembrane ectodomains of HIV and SIV ENVs
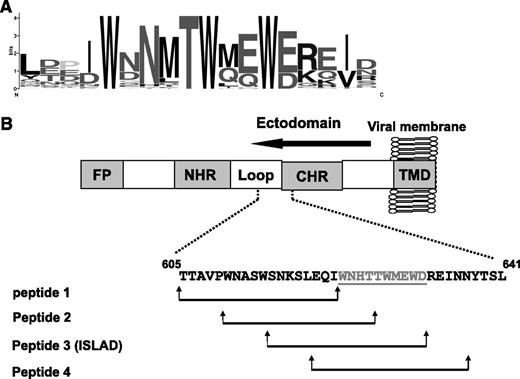
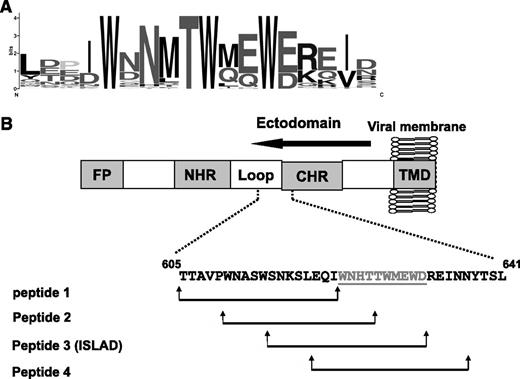
With the aim of finding HIV and SIV motifs that may modulate T-cell activation, a database was created from all reported transmembrane ENVs from HIV and SIV strains. Then bioinformatic analysis was applied to search for a motif that is short and unique and with no repeats in the protein. The located motifs were automatically arranged by their E value, which is an estimate of the expected number of motifs with the given log likelihood ratio that one would find in a similarly sized set of random sequences. A top-ranked motif, with an E value of 1.1e−586, based on 75 sites contributing to the construction of the motif, was found to be associated with the loop region of the ectodomain of the ENV transmembrane protein. It consists of a repeat of 3 Trp residues that are adjacent to acidic residues (Glu and Asp; Figure 1A).
Conservation of the amino acids within the motif. (A) The y-axis is in bits, which is equal to the relative entropy of the motif in relation to a uniform background frequency model. (B) The figure is a schematic representation of regions within the ectodomain of gp41. Starting from the N terminus is the FP, N-heptad repeat (NHR), loop, CHR, and TMD. The location of the motif is presented, as well as the peptides derived from that region (peptides 1-4). Residue numbers and sequence correspond to the HXB2 HIV-1 gp160 variant.
Conservation of the amino acids within the motif. (A) The y-axis is in bits, which is equal to the relative entropy of the motif in relation to a uniform background frequency model. (B) The figure is a schematic representation of regions within the ectodomain of gp41. Starting from the N terminus is the FP, N-heptad repeat (NHR), loop, CHR, and TMD. The location of the motif is presented, as well as the peptides derived from that region (peptides 1-4). Residue numbers and sequence correspond to the HXB2 HIV-1 gp160 variant.
Inhibition of activated MOG35-55–specific line T cells by peptides composed of the highly conserved motif
Sequences were screened within gp41 along the loop region toward the C-heptad repeat (CHR) region (33 residues) in order to cover residues from each side of the motif. We divided them into shorter fragments of 18 residues each (termed “peptide 1,” “peptide 2,” “peptide 3,” and “peptide 4”). Each sequence is shifted in its position with an overlapping of 8 residues in relation to the previous sequence (Figure 1B and Table 1).
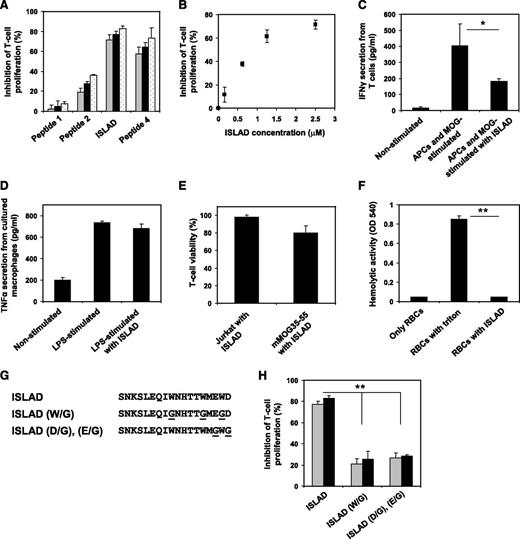
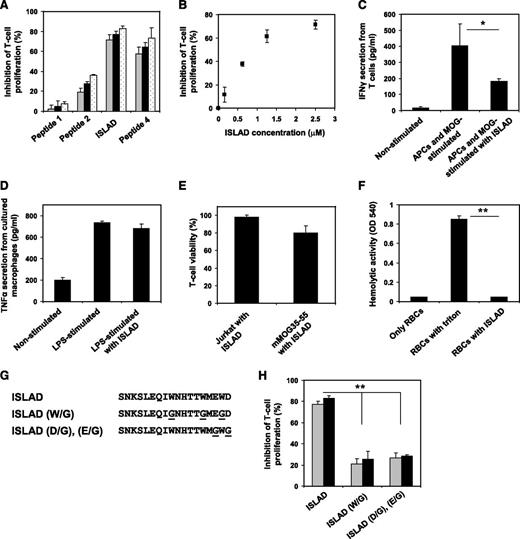
To investigate the efficacy of the different peptides composed of the highly conserved motif at inhibiting the stimulation of antigen-specific line T cells, we used MOG35-55specific murine line T cells (mMOG35-55 T cells) prepared especially for this study (detailed in “Materials and methods”). Figure 2A shows that the peptides exhibited dose-dependent inhibition of T-cell proliferation that relied on the location of the peptides with regard to the identified motif. The order of potency was as follows: peptide 1 (not active) < peptide 2 < peptide 3 (most active) > peptide 4. We named peptide 3, the most potent one, as the ISLAD. The inhibitory concentration of ISLAD at 50% proliferation (IC50) was 1.0 µM ± 0.3 µM (Figure 2B), which was significantly more potent than the known ISU of gp41 (supplemental Figure 1). Furthermore, MOG35-55–stimulated T cells showed a reduction in IFN-γ secretion when incubated with ISLAD (Figure 2C). However, the peptide did not inhibit TNF-α secretion from lipopolysaccharide (LPS)-stimulated macrophages (Figure 2D). ISLAD was not toxic to T cells up to 20-fold more than the IC50 of the peptide, which was the maximal concentration examined (Figure 2E). Hemolysis of red blood cells is often used to detect membranolytic activity of peptides. Importantly, ISLAD was not hemolytic up to 100-fold more than the IC50 of the peptide, which was the maximal concentration examined (Figure 2F).
Inhibition of MOG35-55–specific T cells by ISLAD. MOG35-55–specific line T cells were cultured in microtiter plates with irradiated syngeneic splenocytes as APCs and MOG35-55 in the presence or absence of several HIV peptides. Their proliferative response was measured in an H3-thymidine proliferation assay. (A) The graph shows the inhibition of proliferation by HIV peptides 1-4 with increasing concentrations of 2.5 µM, 5 µM, and 10 µM (gray, black, and white, respectively). Results presented are the mean % inhibition ± SE of the proliferative response to MOG35-55 peptide relative to the control (in the absence of HIV peptides) from a representative experiment (out of 4 experiments). Uninhibited T-cell proliferative responses were 7866 ± 563 cpm. The background proliferation in the absence of antigen was 132 ± 35 cpm. (B) The graph shows dose-dependent inhibition of MOG35-55–specific T-cell proliferation of peptide 3 (ISLAD) starting from the nanomolar concentration range. (C) ISLAD inhibits IFN-γ secretion by MOG35-55–stimulated T cells. T cells were cultured with APCs and MOG35-55 in the presence of 1 µM of ISLAD. After 48 hours, the media were collected and levels of IFN-γ were detected by ELISA. Results are mean ± SE, n = 3. (D) ISLAD does not inhibit TNF-α secretion by LPS-stimulated macrophages. RAW264.7 macrophages were incubated for 2 hours in the presence of 1 µM of ISLAD, and then stimulated with LPS (10 ng/mL) for 5 hours. The media were collected, and the levels of TNF-α were detected by ELISA. Results are mean ± SE, n = 3. (E) ISLAD is not toxic to T cells. Jurkat T cells and MOG35-55–specific T cells were incubated with 20 µM of ISLAD for 4 hours. Then the viability of the cells was analyzed by an XTT cytotoxicity assay. Results are the mean % viability ± SD from the control (cells with no peptide added), n = 3. (F) ISLAD is not hemolytic. Red blood cells were incubated with 100 µM of ISLAD for 1 hour. Hemolytic activity was measured by the release of hemoglobin into the media (OD 540 nm). Triton (1% vol/vol) served as a control for a hemolytic agent. Results are mean ± SD, n = 8. (G) The figure shows the generation of motif-related mutations in ISLAD. The conserved Trp residues and the conserved acidic residues (Glu and Asp) were mutated to Gly. (H) The graph shows the inhibition of MOG35-55–specific T-cell proliferation by the mutant peptides ISLAD (W/G) and ISLAD (D/G), (E/G) with increasing concentrations of 5 µM and 10 µM (gray and black, respectively). *P < .05; **P < .01. RBC, red blood cells.
Inhibition of MOG35-55–specific T cells by ISLAD. MOG35-55–specific line T cells were cultured in microtiter plates with irradiated syngeneic splenocytes as APCs and MOG35-55 in the presence or absence of several HIV peptides. Their proliferative response was measured in an H3-thymidine proliferation assay. (A) The graph shows the inhibition of proliferation by HIV peptides 1-4 with increasing concentrations of 2.5 µM, 5 µM, and 10 µM (gray, black, and white, respectively). Results presented are the mean % inhibition ± SE of the proliferative response to MOG35-55 peptide relative to the control (in the absence of HIV peptides) from a representative experiment (out of 4 experiments). Uninhibited T-cell proliferative responses were 7866 ± 563 cpm. The background proliferation in the absence of antigen was 132 ± 35 cpm. (B) The graph shows dose-dependent inhibition of MOG35-55–specific T-cell proliferation of peptide 3 (ISLAD) starting from the nanomolar concentration range. (C) ISLAD inhibits IFN-γ secretion by MOG35-55–stimulated T cells. T cells were cultured with APCs and MOG35-55 in the presence of 1 µM of ISLAD. After 48 hours, the media were collected and levels of IFN-γ were detected by ELISA. Results are mean ± SE, n = 3. (D) ISLAD does not inhibit TNF-α secretion by LPS-stimulated macrophages. RAW264.7 macrophages were incubated for 2 hours in the presence of 1 µM of ISLAD, and then stimulated with LPS (10 ng/mL) for 5 hours. The media were collected, and the levels of TNF-α were detected by ELISA. Results are mean ± SE, n = 3. (E) ISLAD is not toxic to T cells. Jurkat T cells and MOG35-55–specific T cells were incubated with 20 µM of ISLAD for 4 hours. Then the viability of the cells was analyzed by an XTT cytotoxicity assay. Results are the mean % viability ± SD from the control (cells with no peptide added), n = 3. (F) ISLAD is not hemolytic. Red blood cells were incubated with 100 µM of ISLAD for 1 hour. Hemolytic activity was measured by the release of hemoglobin into the media (OD 540 nm). Triton (1% vol/vol) served as a control for a hemolytic agent. Results are mean ± SD, n = 8. (G) The figure shows the generation of motif-related mutations in ISLAD. The conserved Trp residues and the conserved acidic residues (Glu and Asp) were mutated to Gly. (H) The graph shows the inhibition of MOG35-55–specific T-cell proliferation by the mutant peptides ISLAD (W/G) and ISLAD (D/G), (E/G) with increasing concentrations of 5 µM and 10 µM (gray and black, respectively). *P < .05; **P < .01. RBC, red blood cells.
The contribution of the motif within the peptide to its inhibitory activity was further investigated by either mutating the conserved Trp into Gly or by mutating the conserved acidic residues (Glu and Asp) into Gly (Figure 2G). In both cases, a significant reduction in ISLAD-inhibitory activity was observed (Figure 2H). Overall, the data suggest that ISLAD has a specific inhibitory effect on T-cell proliferation.
ISLAD is localized with T-cell membranes with high binding affinity
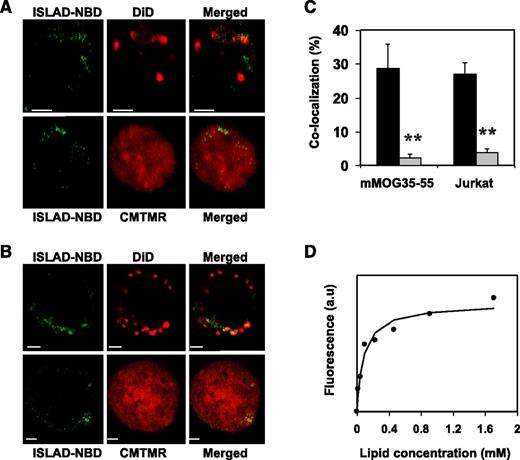
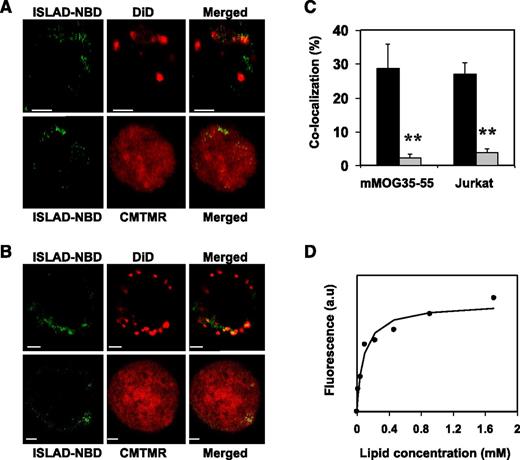
Analysis of the cellular localization of ISLAD in T cells may further suggest its plausible mode of action. For that purpose, human Jurkat T cells and mMOG35-55 T cells were probed with either the fluorescent cytoplasmic dye CMTMR or with the fluorescent membrane dye DiD, which is known to accumulate in cell-membrane compartments. Fluorescently labeled nitrobenzofurazan (NBD) peptides were then added to the cells and were monitored for their cellular localization using confocal microscopy. Figure 3 shows the analysis of mMOG35-55 T cells (Figure 3A) and Jurkat T cells (Figure 3B). The left column shows the peptides’ fluorescence (denoted in green), the central column shows cellular staining (red), and the right column shows a merged image of the two. In both experiments, a significant tendency was observed for ISLAD to colocalize with membranes of murine and human T cells (Figure 3C). Because Trp is known to change its emission in a hydrophobic environment, the binding affinity of ISLAD to the membrane was determined by measuring the fluorescence anisotropy of the peptides’ intrinsic Trp residue in the presence of the membrane (Figure 3D). The solution of peptides was titrated with increasing concentrations of large unilamellar vesicle (LUV) liposomes composed of phosphatidylcholine (PC) and cholesterol (Chol). The binding affinity constant was calculated by Equation 1 in the supplemental methods, yielding a value of 1.2 × 10⁴ M−1 ± 0.3 × 10⁴ M−1.
ISLAD colocalizes with T-cell membranes with high membrane binding affinity. T cells were loaded with the membrane fluorescent dye DiD or with the cytoplasmic fluorescent dye CMTMR, and then fluorescent NBD-ISLAD was added to cells. Cellular localization of the peptides in mMOG35-55 T cells (A) and in Jurkat T cells (B) were observed using confocal microscopy. The left column is the fluorescence of NBD-ISLAD alone (green). The middle column is the fluorescence of the cytoplasmic or membrane dye (red). The right column is the merged image of them. (C) The graphs shows the percentages of colocalization ± SD between ISLAD and cell membrane (black) or between ISLAD and cytoplasm of the cell (gray) in T cells. (D) The graph shows the fluorescent measurements of ISLAD-membrane interactions. Peptides were titrated with increasing concentrations of PC/Chol (9:1) LUVs, and changes in fluorescence anisotropy of their intrinsic Trp were measured. The fitting curve from the nonlinear least-squares model is presented (supplemental methods, Equation 1), which gives the membrane binding affinity constant. Scale bars represent 2 µM. **P < .01. a.u, arbitrary units.
ISLAD colocalizes with T-cell membranes with high membrane binding affinity. T cells were loaded with the membrane fluorescent dye DiD or with the cytoplasmic fluorescent dye CMTMR, and then fluorescent NBD-ISLAD was added to cells. Cellular localization of the peptides in mMOG35-55 T cells (A) and in Jurkat T cells (B) were observed using confocal microscopy. The left column is the fluorescence of NBD-ISLAD alone (green). The middle column is the fluorescence of the cytoplasmic or membrane dye (red). The right column is the merged image of them. (C) The graphs shows the percentages of colocalization ± SD between ISLAD and cell membrane (black) or between ISLAD and cytoplasm of the cell (gray) in T cells. (D) The graph shows the fluorescent measurements of ISLAD-membrane interactions. Peptides were titrated with increasing concentrations of PC/Chol (9:1) LUVs, and changes in fluorescence anisotropy of their intrinsic Trp were measured. The fitting curve from the nonlinear least-squares model is presented (supplemental methods, Equation 1), which gives the membrane binding affinity constant. Scale bars represent 2 µM. **P < .01. a.u, arbitrary units.
The T-cell proliferative signal resulting from antigen-specific stimulation by APCs is inhibited by ISLAD’s interaction with the TCR
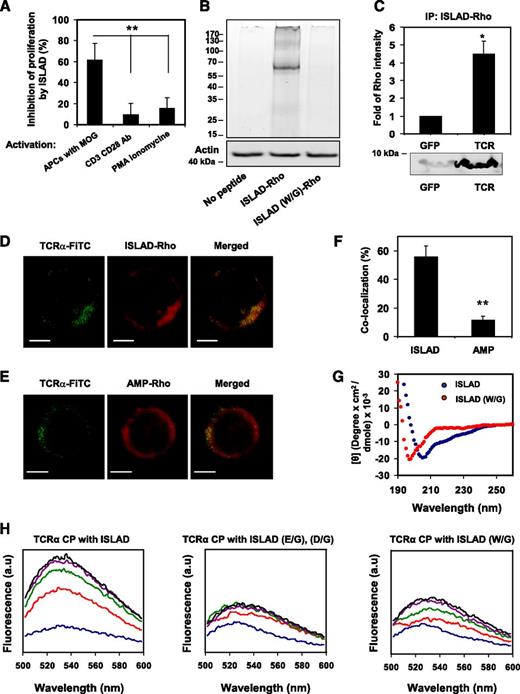
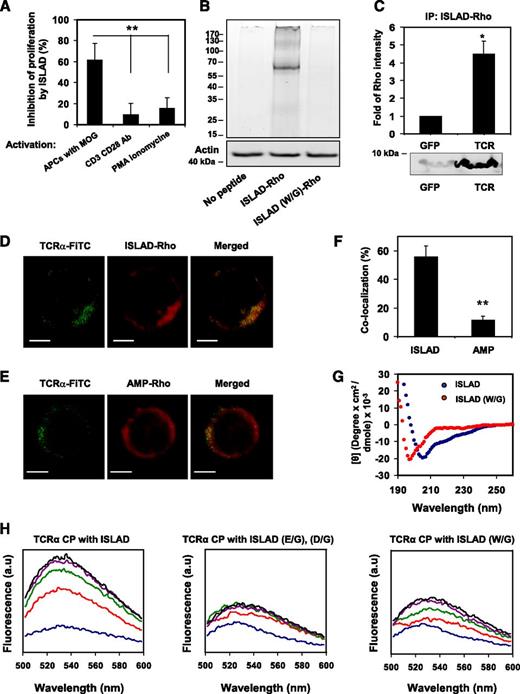
The inhibitory activity of ISLAD was investigated by pinpointing the signaling step at which ISLAD interfered. This was done by examining its effect on mMOG35-55 T cells, which were stimulated at different steps of the TCR complex signal transduction. ISLAD inhibited T-cell proliferative signals that result from cognitive TCR engagement through APCs. Nevertheless, the peptide did not inhibit anti-CD3/CD28 or PMA/ionomycin-stimulated T-cell proliferation (Figure 4A). This suggests that ISLAD might interact with the components of the TCR complex to achieve its inhibitory effect.
The interaction of ISLAD with the TCR complex. (A) ISLAD only inhibits T-cell proliferative signals that result from TCR engagement through APCs. MOG35-55–specific line T cells were activated in the presence of ISLAD (1 µM) by the following agents: (1) MOG35-55 antigen and APCs, (2) CD3 and CD28 antibodies (2 µg/mL), and (3) PMA (50 ng/mL) and ionomycin (1 μM). The uninhibited T-cell proliferative responses were 707 ± 97 cpm and 14 822 ± 1541 cpm for CD3/CD28 antibodies and PMA/ionomycin, respectively. The background proliferation levels in the absence of CD3/CD28 antibodies and PMA/ionomycin were 66 ± 6 cpm and 105 ± 17 cpm, respectively. Results presented are the mean % inhibition ± SD of the proliferative response relative to the control (in the absence of HIV peptide) from a representative experiment (out of 2 experiments). (B) Biochemical analysis of ISLAD’s interaction with T-cell proteins is shown. Jurkat T cells were incubated with 1 μM fluorescently labeled rhodamine (Rho)-ISLAD or its mutant Rho-ISLAD (W/G), and then cross-linked and lysed. The T-cell proteins were resolved by SDS-PAGE, and proteins bound to Rho-peptides were detected by the fluorescence of rhodamine (the ladder of protein sizes is indicated in kDa). Subsequently, the gel was transferred to a membrane and probed for actin. (C) Jurkat T cells were incubated with Rho-ISLAD, lysed, and immunoprecipitated with antibodies to TCR-α or GFP. Bound proteins were separated by SDS-PAGE and analyzed for the presence of the fluorescently labeled peptides. Results are presented as the mean fold of fluorescence intensity relative to the control (GFP) ± SD (n = 2). (D-E) The images show the colocalization of ISLAD with cellular TCR-α by using confocal microscopy. Activated mMOG35-55 T cells were probed with antibodies against TCR-α, followed by staining with secondary FITC-labeled antibodies (green, left column) and with rhodamine fluorescent peptides (red, middle column). The right column is the merged image of the molecules. In (D), the molecules were stained with Rho-labeled ISLAD, and in (E) they were stained with the Rho-labeled control peptide, AMP. (F) The graphs shows the percentage of colocalization ± SD between TCR-α and the peptides (ISLAD or AMP). (G) ISLAD forms an α-helical structure in a lipid environment; the graphs shows the circular dichroism spectra of ISLAD and its mutant, ISLAD (W/G), in 1% lysophosphatidylcholine in HEPES (N-2-hydroxyethylpiperazine-N'-2-ethanesulfonic acid). (H) The graphs show the changes in the membrane-bound state of the NBD-labeled CP of the TCR-α TMD upon the addition of ISLAD. The fluorescent experiments were performed using the NBD-labeled CP from the TCR-α TMD. Fluorescence spectra excitation was set at 467 nm, and an emission scan was at 500-600 nm. NBD-CP was first added to a dispersion of PC/Chol (9:1) LUVs in PBS. This was followed by the addition of unlabeled ISLAD (left) and the control peptides ISLAD (E/G), (D/G) (middle), and ISLAD (W/G) (right) in several sequential doses. Fluorescence spectra were obtained in different NBD-labeled CP/HIV peptide ratios ranging from 40:1 to 5:1 (corresponding to the blue line up to the black line, respectively). Scale bars represent 2 µM. *P < .05; **P < .01.
The interaction of ISLAD with the TCR complex. (A) ISLAD only inhibits T-cell proliferative signals that result from TCR engagement through APCs. MOG35-55–specific line T cells were activated in the presence of ISLAD (1 µM) by the following agents: (1) MOG35-55 antigen and APCs, (2) CD3 and CD28 antibodies (2 µg/mL), and (3) PMA (50 ng/mL) and ionomycin (1 μM). The uninhibited T-cell proliferative responses were 707 ± 97 cpm and 14 822 ± 1541 cpm for CD3/CD28 antibodies and PMA/ionomycin, respectively. The background proliferation levels in the absence of CD3/CD28 antibodies and PMA/ionomycin were 66 ± 6 cpm and 105 ± 17 cpm, respectively. Results presented are the mean % inhibition ± SD of the proliferative response relative to the control (in the absence of HIV peptide) from a representative experiment (out of 2 experiments). (B) Biochemical analysis of ISLAD’s interaction with T-cell proteins is shown. Jurkat T cells were incubated with 1 μM fluorescently labeled rhodamine (Rho)-ISLAD or its mutant Rho-ISLAD (W/G), and then cross-linked and lysed. The T-cell proteins were resolved by SDS-PAGE, and proteins bound to Rho-peptides were detected by the fluorescence of rhodamine (the ladder of protein sizes is indicated in kDa). Subsequently, the gel was transferred to a membrane and probed for actin. (C) Jurkat T cells were incubated with Rho-ISLAD, lysed, and immunoprecipitated with antibodies to TCR-α or GFP. Bound proteins were separated by SDS-PAGE and analyzed for the presence of the fluorescently labeled peptides. Results are presented as the mean fold of fluorescence intensity relative to the control (GFP) ± SD (n = 2). (D-E) The images show the colocalization of ISLAD with cellular TCR-α by using confocal microscopy. Activated mMOG35-55 T cells were probed with antibodies against TCR-α, followed by staining with secondary FITC-labeled antibodies (green, left column) and with rhodamine fluorescent peptides (red, middle column). The right column is the merged image of the molecules. In (D), the molecules were stained with Rho-labeled ISLAD, and in (E) they were stained with the Rho-labeled control peptide, AMP. (F) The graphs shows the percentage of colocalization ± SD between TCR-α and the peptides (ISLAD or AMP). (G) ISLAD forms an α-helical structure in a lipid environment; the graphs shows the circular dichroism spectra of ISLAD and its mutant, ISLAD (W/G), in 1% lysophosphatidylcholine in HEPES (N-2-hydroxyethylpiperazine-N'-2-ethanesulfonic acid). (H) The graphs show the changes in the membrane-bound state of the NBD-labeled CP of the TCR-α TMD upon the addition of ISLAD. The fluorescent experiments were performed using the NBD-labeled CP from the TCR-α TMD. Fluorescence spectra excitation was set at 467 nm, and an emission scan was at 500-600 nm. NBD-CP was first added to a dispersion of PC/Chol (9:1) LUVs in PBS. This was followed by the addition of unlabeled ISLAD (left) and the control peptides ISLAD (E/G), (D/G) (middle), and ISLAD (W/G) (right) in several sequential doses. Fluorescence spectra were obtained in different NBD-labeled CP/HIV peptide ratios ranging from 40:1 to 5:1 (corresponding to the blue line up to the black line, respectively). Scale bars represent 2 µM. *P < .05; **P < .01.
To investigate the interaction of ISLAD with the TCR, fluorescently labeled rhodamine-peptides were incubated with T cells, and then cross-linked with formaldehyde to maintain the interaction with their target proteins. The cross-linked T-cell lysate was resolved by SDS-PAGE, and proteins bound to rhodamine-peptides were detected by the fluorescence of rhodamine (Figure 4B). Remarkably, only 1 major fluorescent band was detected at the protein size of ∼70kDa that could match the stoichiometry corresponding to the TCR heterodimer. Fluorescent bands were neither observed in the T-cell lysates with no peptides added nor with the addition of the control mutant peptide rhodamine-ISLAD (W/G). Western blot for actin was used to assure equal loading. Immunoprecipitation using antibodies against the TCR confirmed that the labeled rhodamine-ISLAD interacts with the TCR. As a control, a nonrelated GFP antibody was used. Figure 4C shows that the rhodamine-ISLAD coprecipitated with the TCR.
Colocalization of ISLAD with the TCR was assessed by using confocal microscopy (Figure 4D-E). Antigen-stimulated mMOG35-55–specific line T cells were probed with antibodies against TCR-α, followed by staining with secondary FITC-labeled antibodies (green, left column) and with rhodamine-labeled ISLAD (red, middle column). To evaluate the colocalization between the molecules, a merged image was produced (right column). Figure 4D shows a capping shape of the TCR-α molecules in activated T cells, which were colocalized with a distribution shape similar to ISLAD’s. As a control, AMP, a nonrelated antimicrobial peptide,34 was labeled with rhodamine and its localization on T cells was detected. Unlike rhodamine-ISLAD, rhodamine-AMP was found throughout the cell membrane (Figure 4E). The colocalization percentages of the peptides with the TCR-α molecules were significantly higher in the ISLAD experiment than the ones displayed in the AMP experiment (Figure 4F).
The TCR complex’s TMD helices mediate receptor activation through the interactions between basic and acidic residues.6,7 Thus, it is reasonable that the membrane-bound acidic ISLAD would favor its interaction with the TMD of the TCR. Moreover, ISLAD exhibited an α-helical structure in the lipid environment (Figure 4G), which might facilitate its interaction with other transmembrane helices. To investigate this possibility, we used NBD fluorescence, which is sensitive to the membrane surroundings; its emission intensity is increased via membrane insertion.35 Thus, it enables one to track the membrane-bound state of a marked protein fragment. The CPs of TMD from TCR-α were labeled with NBD. Their initial fluorescence emission spectra were first measured in the presence of LUVs alone and then in the presence of several sequential doses of unlabeled ISLAD and its mutants (Figure 4H). NBD-CP exhibited low-fluorescence signals in the presence of liposomes alone. However, when unlabeled ISLAD was added, the fluorescence emission maxima of NBD-CP increased sharply, concomitant with a blue shift. Notably, when the peptide’s mutants, ISLAD (E/G), (D/G) and ISLAD (W/G) were added, only a slight increase was observed in the emission maxima of NBD-CP (Figure 4H). These results indicate that ISLAD specifically recognizes CPs, which leads to changes in its environment, probably by penetrating into the membrane.
Administration of ISLAD suppresses MOG35-55–induced experimental autoimmune encephalomyelitis by downregulation of pathogenic T cells
The finding that ISLAD inhibits mMOG35-55 T cells in vitro (Figure 2) suggests that it might also inhibit pathogenic MOG35-55–specific T cells in vivo. Therefore, we carried out experiments aimed at investigating the effect of ISLAD on EAE, an animal model of multiple sclerosis. Multiple sclerosis is an inflammatory autoimmune disease of the central nervous system (CNS) characterized by neurological impairment, resulting from primary demyelination and axonal damage. The pathogenic mechanism underlying disease development involves CNS-specific T-cell activation and TH1 differentiation, followed by infiltration of T cells, B cells, and macrophages into the CNS.36
First, the ISLAD toxicity was investigated by injecting naive C57Bl mice intravenously with 50 mg/kg of the peptides. No toxic effect was observed in these mice (n = 3). Then, C57Bl/6J mice that were induced to develop clinical EAE by immunization with MOG35-55/CFA were given a dose of ISLAD that was 100-fold less than the 1 examined in the toxicity assay, that is, 10 µg per mouse (0.5 mg/kg), or they were given PBS as a control. On day 10 after immunization, before the onset of clinical signs of EAE, the lymph node cells (LNCs) were analyzed ex vivo for their recall proliferative response to the immunizing MOG35-55 peptide and for the secretion of pro-inflammatory cytokines. As shown in Figure 5A, LNCs from mice that were treated with ISLAD exhibited a significant reduction in their proliferative responses to the immunizing MOG35-55 peptide, compared with LNCs from mice treated with PBS.
Administration of ISLAD suppresses MOG35-55–induced EAE by downregulation of pathogenic T cells. (A) The graph shows ex vivo downregulation of encephalitogenic MOG35-55–reactive T cells following ISLAD administration. C57Bl mice were injected for EAE induction with MOG35-55 peptide. Ten days after immunization, draining LNCs from each treatment group (n = 4 mice per group) were pooled and analyzed for their ex vivo recall proliferative response to MOG35-55. The LNCs from each treatment group were cultured for 72 hours in microtiter wells in triplicate (0.5 × 10⁶ per well) in the absence or presence of MOG35-55 (2.5 or 5 μg/mL). [H3] thymidine was added for the last 18 hours. Results are the means ± SD. The graphs in (B-D) present the secretion of pro-inflammatory cytokines from cultured LNCs derived from PBS- or ISLAD-administered EAE-mice. LNCs from each treatment group were cultured (5 × 10⁶/mL) in the absence or presence of MOG35-55 (5 μg/mL) for 24 hours, and the supernatants were collected for detecting the secreted IFN-γ (B), TNF-α (C), and IL-12 (D) by ELISA. Results are the mean ± SD. (E) Clinical EAE was induced in mice that were administered PBS (♦) or 0.5 mg/kg of ISLAD (▪), n = 10 mice per group. Following the encephalitogenic challenge, mice were observed and scored for clinical severity of the disease. The daily rated clinical score is the mean ± SE. Results are from a representative experiment (out of 2 experiments). *P < .05; **P < .01.
Administration of ISLAD suppresses MOG35-55–induced EAE by downregulation of pathogenic T cells. (A) The graph shows ex vivo downregulation of encephalitogenic MOG35-55–reactive T cells following ISLAD administration. C57Bl mice were injected for EAE induction with MOG35-55 peptide. Ten days after immunization, draining LNCs from each treatment group (n = 4 mice per group) were pooled and analyzed for their ex vivo recall proliferative response to MOG35-55. The LNCs from each treatment group were cultured for 72 hours in microtiter wells in triplicate (0.5 × 10⁶ per well) in the absence or presence of MOG35-55 (2.5 or 5 μg/mL). [H3] thymidine was added for the last 18 hours. Results are the means ± SD. The graphs in (B-D) present the secretion of pro-inflammatory cytokines from cultured LNCs derived from PBS- or ISLAD-administered EAE-mice. LNCs from each treatment group were cultured (5 × 10⁶/mL) in the absence or presence of MOG35-55 (5 μg/mL) for 24 hours, and the supernatants were collected for detecting the secreted IFN-γ (B), TNF-α (C), and IL-12 (D) by ELISA. Results are the mean ± SD. (E) Clinical EAE was induced in mice that were administered PBS (♦) or 0.5 mg/kg of ISLAD (▪), n = 10 mice per group. Following the encephalitogenic challenge, mice were observed and scored for clinical severity of the disease. The daily rated clinical score is the mean ± SE. Results are from a representative experiment (out of 2 experiments). *P < .05; **P < .01.
Given that the inhibition of the T-cell proliferative response by ISLAD was associated with a reduction in pro-inflammatory cytokine secretion in vitro (Figure 2C), we examined the corresponding effect of ISLAD ex vivo. LNCs derived from PBS-treated mice stimulated with the immunizing MOG35-55 peptide showed higher levels of IFN-γ secretion (25 ng/mL) compared with LNCs derived from ISLAD-treated mice (9 ng/mL; 64% inhibition; Figure 5B). Similarly, while LNCs derived from PBS-treated mice stimulated with the MOG35-55 peptide secreted 40 pg/mL TNF-α, the secretion of TNF-α by LNCs derived from ISLAD-treated mice was barely detected upon stimulation by MOG35-55 (90% inhibition; Figure 5C). IL-12 is a cytokine mostly produced by APCs. Primed LNCs (containing T cells, B cells, and APCs) from PBS- or ISLAD-treated mice showed a comparable significant basal level of secreted IL-12 without stimulation by MOG35-55 (Figure 5D). In LNCs from PBS-treated mice as opposed to LNCs from ISLAD-treated mice, ex vivo stimulation by the MOG35-55 peptide resulted in a slight, yet significant, increase in IL-12 secretion (Figure 5D). This does not necessarily mean suppression of IL-12 secretion by ISLAD. Rather, the slight increase in IL-12 secretion by PBS-treated mice LNCs compared with ISLAD-treated mice LNCs is more likely to be attributed to the higher level of IFN-γ secreted by stimulated MOG35-55–specific T cells (Figure 5B). By a positive-feedback mechanism, this may in turn promote IL-12 production inAPCs.37,38
Subsequently, we examined the onset of the clinical manifestation of EAE, which started on day 10 after the encephalitogenic challenge both in PBS- and in ISLAD-treated mice (Figure 5E). Importantly, from day 20, a significant reduction in EAE severity was observed in the ISLAD-treated group. The reduction in disease severity was found to result from downregulation of the encephalitogenic MOG35-55–reactive T cells by ISLAD (Figure 5A-D). This result demonstrates the ability of ISLAD to modulate antigen-specific T-cell activation in vivo.
Discussion
In this study, we report on a highly conserved motif associated with the HIV gp41 loop region. This motif contains a repeat of 3 Trp residues that are adjacent to acidic residues (Glu and Asp). Functionally, the unique HIV element inhibits antigen-specific T-cell proliferation and pro-inflammatory cytokine release both in vitro and in an animal model of the T-cell–mediated autoimmune disease multiple sclerosis. Therefore, this domain was named ISLAD. Moreover, we identified ISLAD’s target protein as the membrane-bound TCR complex.
It has been shown that 1 basic transmembrane residue of the TCR is required for assembly with 2 acidic residues of the CD3 signaling dimmer.6,7 The ISLAD motif possesses acidic Glu and Asp residues and a repeat of 3 Trp residues. Trp residues are often found at protein-membrane interfaces to facilitate interaction with the membrane.39 Knocking out the Trp residues significantly decreases the ability of ISLAD to inhibit T-cell proliferation. This is expected because the peptides’ anticipated mode of action is on the membrane-bound TCR complex. Importantly, knocking out the acidic Glu and Asp residues also significantly decreases the inhibitory activity of the peptides. Moreover, a much stronger interaction is observed between ISLAD and the TCR-α TMD than with the pair containing the ISLAD (E/G), (D/G) mutant. Overall, the data suggest that ISLAD interferes with basic-acidic–driven interactions of TMDs from the TCR complex, which subsequently leads to impaired antigen-specific stimulation of the complex and to inhibited cell proliferation. A nonviral example of interference with the TCR complex assembly is the ability of peptides derived from the TCR-α TMD to modulate TCR complex oligomerization and to inhibit antigen-specific T-cell activation.8
The sequence corresponding to ISLAD contains 2 N-linked glycosylation sites that are thought to impede antibody binding and may interfere with protein interaction. However, the inhibition of trimming glucosidase blocks HIV entry after CD4 binding, suggesting that deglycosylation is required for the ENV-mediated membrane fusion reaction.40,41 Moreover, it has been shown in macrophages and DCs that the Trp repeat within ISLAD is the binding site to caveolin-1 protein, which is associated with lipid rafts.42 Another binding site of the Trp residues is the N-terminal part of gp41, which forms the hairpin conformation of the protein in the late fusion steps.43 These reports further support the ability of ISLAD to interact with membrane-embedded proteins, demonstrated here by the TCR.
HIV ENV function is associated with impaired cross-talk between monocyte-derived DCs and T cells.11,12,22,44,45 Inactivation and apoptosis of bystander naive CD4+ T cells is linked to ENV-mediated hemifusion with HIV-infected T cells.46 Such defects have been observed in HIV-infected individuals whose CD4+ T cells fail to proliferate in response to antigen-specific stimulation.47 Thus, downregulation of lymphocytes by HIV affects the ability of the immune system to mount an effective response to the virus. Other viral proteins such as negative regulatory factor protein and trans-activator of transcription protein also modulate T-cell functions by either hyperactivation or downregulation of T-cell activity.4,48 Hence, inhibition of T-cell activation by ENV-derived ISLAD does not necessary mean that viral replication is decreased. Additionally, newly infected T cells must still undergo the minimal degree of activation needed to establish viral infection.49
In summary, gp41 loop–derived ISLAD inhibits T-cell proliferation by acting on the TCR complex. Interestingly, the hydrophobic loop region is also involved in the late steps of the membrane fusion reaction. Such dual activity further demonstrates how viruses have evolved to alter so many cellular processes with a limited amount of proteins. In addition, the data of this work may also serve as a new tool for the downregulation of T-cell–mediated inflammation, manifested here by multiple sclerosis.
The online version of this article contains a data supplement.
The publication costs of this article were defrayed in part by page charge payment. Therefore, and solely to indicate this fact, this article is hereby marked “advertisement” in accordance with 18 USC section 1734.
Acknowledgments
The authors thank Batya Zarmi for her valuable help with peptide purification and Vladimir Kiss for technical assistance with the confocal imaging.
This study was supported by the Israel Science Foundation.
Authorship
Contribution: A.A., O.F., N.K., A.B.-N., and Y.S. designed the experiments, analyzed the data, and wrote the paper. A.A., O.F., and N.K. performed the experiments.
Conflict-of-interest disclosure: The authors declare no competing financial interests.
The current affiliation for Y.S. is as the incumbent of the Harold S. and Harriet B. Brady Professorial Chair in Cancer Research, Department of Biological Chemistry, Weizmann Institute of Science.
Correspondence: Yechiel Shai, Department of Biological Chemistry, Weizmann Institute of Science, Rehovot, 76100 Israel; e-mail: yechiel.shai@weizmann.ac.il.
References
Author notes
A.A. and O.F. contributed equally to this work.

![Figure 5. Administration of ISLAD suppresses MOG35-55–induced EAE by downregulation of pathogenic T cells. (A) The graph shows ex vivo downregulation of encephalitogenic MOG35-55–reactive T cells following ISLAD administration. C57Bl mice were injected for EAE induction with MOG35-55 peptide. Ten days after immunization, draining LNCs from each treatment group (n = 4 mice per group) were pooled and analyzed for their ex vivo recall proliferative response to MOG35-55. The LNCs from each treatment group were cultured for 72 hours in microtiter wells in triplicate (0.5 × 10⁶ per well) in the absence or presence of MOG35-55 (2.5 or 5 μg/mL). [H3] thymidine was added for the last 18 hours. Results are the means ± SD. The graphs in (B-D) present the secretion of pro-inflammatory cytokines from cultured LNCs derived from PBS- or ISLAD-administered EAE-mice. LNCs from each treatment group were cultured (5 × 10⁶/mL) in the absence or presence of MOG35-55 (5 μg/mL) for 24 hours, and the supernatants were collected for detecting the secreted IFN-γ (B), TNF-α (C), and IL-12 (D) by ELISA. Results are the mean ± SD. (E) Clinical EAE was induced in mice that were administered PBS (♦) or 0.5 mg/kg of ISLAD (▪), n = 10 mice per group. Following the encephalitogenic challenge, mice were observed and scored for clinical severity of the disease. The daily rated clinical score is the mean ± SE. Results are from a representative experiment (out of 2 experiments). *P < .05; **P < .01.](https://ash.silverchair-cdn.com/ash/content_public/journal/blood/121/12/10.1182_blood-2012-11-468900/4/m_2244f5.jpeg?Expires=1768445786&Signature=EtqPJ3TpqQVgjNWjwYKfMJGqh-Cr7o--WTPn1Mr-w9GHQdBL4MolxNnFhdKpK-C38AEakHfr5PMFHDIk8J5yEYoU9SWPpY05ms2g7J7U2XPTNezWFEolzPWPMraguNHcb8X3weDYf9DJD0UzG5YTKIZlFY8HfDcvEeDBmbf1kwQz4eTmCe1Le68aK7UxXcNPGxuRdopbFOZ4YslXxiQX3xIZoOQqGJf5bMcxnngO0mhCRZ8TrUFe-mRyYp-NRuSeYdJYux5wvZFFZt1HmdUojyHroflVKYqVKOw1Rc4XMTv32E34Cyf-kKu9APmCOhgD3bhTMgtDW9a8VMxhYOpFog__&Key-Pair-Id=APKAIE5G5CRDK6RD3PGA)

![Figure 5. Administration of ISLAD suppresses MOG35-55–induced EAE by downregulation of pathogenic T cells. (A) The graph shows ex vivo downregulation of encephalitogenic MOG35-55–reactive T cells following ISLAD administration. C57Bl mice were injected for EAE induction with MOG35-55 peptide. Ten days after immunization, draining LNCs from each treatment group (n = 4 mice per group) were pooled and analyzed for their ex vivo recall proliferative response to MOG35-55. The LNCs from each treatment group were cultured for 72 hours in microtiter wells in triplicate (0.5 × 10⁶ per well) in the absence or presence of MOG35-55 (2.5 or 5 μg/mL). [H3] thymidine was added for the last 18 hours. Results are the means ± SD. The graphs in (B-D) present the secretion of pro-inflammatory cytokines from cultured LNCs derived from PBS- or ISLAD-administered EAE-mice. LNCs from each treatment group were cultured (5 × 10⁶/mL) in the absence or presence of MOG35-55 (5 μg/mL) for 24 hours, and the supernatants were collected for detecting the secreted IFN-γ (B), TNF-α (C), and IL-12 (D) by ELISA. Results are the mean ± SD. (E) Clinical EAE was induced in mice that were administered PBS (♦) or 0.5 mg/kg of ISLAD (▪), n = 10 mice per group. Following the encephalitogenic challenge, mice were observed and scored for clinical severity of the disease. The daily rated clinical score is the mean ± SE. Results are from a representative experiment (out of 2 experiments). *P < .05; **P < .01.](https://ash.silverchair-cdn.com/ash/content_public/journal/blood/121/12/10.1182_blood-2012-11-468900/4/m_2244f5.jpeg?Expires=1768525779&Signature=SEupSrD82XG9xP~9E2w2asetQCM6iux4ohuaaKQW3E-rIMWaLQSkLKiSq~IKQlWBDSvYyGGHXunhurT9q1Yk6ocARSeHGeHIFH5yxfU5p8Hy6pb8nJd-x5hWsuEifKsTZRSHdifazoqHEIUK7gaxPVjkc24egtx0NsWOsMmu7qnlXvVEjXEIjPZxMxLhf8FqnVTXrKMKJ0S4pAVYX1RT5~wqwD2jCBcXLZuRSfkl3VzJ3-yicqkmX3w63UbTVON0Cj1dT-YvINc5l1s~YiIrUJ2wpQZUVpq-PntVhS1dmP-Aok8K3t4YE52328gRMNkjDNfmzBXr55G4EUUmwj75bQ__&Key-Pair-Id=APKAIE5G5CRDK6RD3PGA)