Key Points
NKG2D, but not NKp46, has a modest, NK cell intrinsic influence on shaping the NK cell receptor repertoire.
NKG2D deficiency does not alter the NK cell response to MCMV infection.
Abstract
The immunoreceptors NKG2D and NKp46 are known for their capacity to activate natural killer (NK) cell cytotoxicity and secretory responses in the contexts of tumors and infections, yet their roles in NK cell education remain unclear. Here, we provide the first characterization of mice deficient for both NKG2D and NKp46 receptors to address the relevance of their concomitant absence during NK cell development and function. Our findings reveal that NK cells develop normally in double-mutant (DKO) mice. Mice lacking NKG2D but not NKp46 showed subtle differences in the percentages of NK cells expressing inhibitory Ly49 receptors and the adhesion molecule DNAM-1. A slightly increased percentage of terminally differentiated NK cells and functional response to in vitro stimuli was observed in some experiments. These alterations were modest and did not affect NK cell function in vivo in response to mouse cytomegalovirus infection. NKp46 deficiency alone, or in combination with NKG2D deficiency, had no effect on frequency or function of NK cells.
Introduction
Natural killer (NK) cells are potent, innate immune effector cells that use germ line–encoded receptors to recognize specific ligands on distressed target cells. Each NK cell expresses numerous receptors that include diverse activating, inhibitory, and adhesion receptors.1,2 NK cell development from common lymphoid progenitors and differentiation into mature effector cells are processes that have been correlated with the sequential acquisition of these receptors.3-6 Most NK inhibitory receptors recognize MHC class I (MHC-I) molecules. These receptors are grouped into 3 families including the CD94/NKG2A heterodimers shared by humans and mice, the killer-cell immunoglobulin-like receptors (KIR) family functional in humans only, and the C-type lectin-like proteins of the Ly49 family in mice.1,2,7 The inhibitory MHC-specific receptors are expressed in a variegated overlapping fashion so that each NK cell usually expresses several receptors, but there is variation in the set of receptors expressed by each NK cell. This pattern of expression accounts for the broad specificity of the NK cell repertoire and their capacity for “missing-self” recognition, which is the recognition of MHC-I–different or MHC-I–deficient cells.8 During NK cell development, engagement of the inhibitory receptors, or failure to do so, contributes to the NK education process, which tunes NK cell responsiveness and ensures tolerance to self-tissues.9-14
NK-activating receptors are involved in the elimination of tumors and infected cells. NK group 2, member D (NKG2D) is expressed on all mouse NK cells and also shared by other cell types including activated CD8+T, γδT cells, and some NKT cells.15 It specifically recognizes MHC-I–like self-ligands induced on damaged self-tissues undergoing transformation, infection, or autoimmune aggression.16-20 NKp46 is another potent stimulatory receptor that belongs to the immunoglobulin superfamily of natural cytotoxic receptors.1,21 Specifically expressed on NK cells and a few T cells, NKp46 recognizes viral hemagglutinin on infected cells22,23 and yet uncharacterized ligands on tumor cells. Ly49H is an activating receptor that binds to the mouse cytomegalovirus (MCMV) m157 protein on infected cells24,25 and was recently shown to influence NK activity in mice expressing m157.26,27
The relevance of activating receptors in NK cell differentiation is still poorly understood and controversial with regard to their ability to tune NK-cell responsiveness and shape the NK-cell repertoire.20,28-30 Here, we performed a thorough analysis of the role of NKG2D and NKp46 during NK cell development using a novel mouse model deficient in both activating receptors. Because these receptors signal differently and have previously been shown to provide synergistic signals for NK-cell activation,31 it is of considerable interest to determine whether they act synergistically, or redundantly, in their influence on NK-cell development. Therefore, we compared double and single mutants to wild-type (WT) littermates for their repertoire of cell surface receptors and maturation markers. Also, the NK-cell capacity to mediate NKG2D-independent functions was assessed in response to various stimuli in vitro and to infection with the MCMV in vivo.
Methods
Mouse colonies
Ncr1gfp/gfp mice (>15 backcrosses to C57BL/6 mice),30 kindly provided by Prof. Mandelboim (Hebrew University of Jerusalem, Israel), and Klrk1−/− mice (C57BL/6)20 were genotyped as previously described. All mice were bred and maintained in the animal facility at Imperial College London in a specific pathogen-free environment. Animal work was carried out in compliance with the British Home Office Animals Scientific Procedures Act 1986. BALB.B6-Cmv1r mice32 were maintained in the animal facility at the University of California, Berkeley in compliance with institutional guidelines.
NK cell function and repertoire analysis
Functional assays and generation of chimera mice were performed as previously described.20 Details are provided in the supplemental Methods section.
MCMV infection
Smith strain WT MCMV was obtained from Dr. Ann Hill (Oregon Health & Science University, Portland, OR). MCMV was amplified in vitro and titrated using NIH3T3 fibroblasts; Klrk1−/− and Klrk1+/+ mice that do not carry the gfp cassette were infected (intraperitoneally) with the indicated doses of virus. NK-cell depletion and NKG2D blocking were achieved with one injection of PK136 (200μg, intraperitoneally) or anti-NKG2D (250 µg, MI-6 clone, ebioscience), respectively, at day 1 before infection. On day 3 or 4 post infection, spleen, liver, and lung tissues were harvested and the virus was titrated in vitro in a plaque assay using NIH3T3 fibroblasts.
Statistics
Unpaired Student t test (2-tailed) was used for statistical analysis of all experiments using Prism software (GraphPad Software, Inc., CA). P values correspond to the following annotation: *P ≤ .05, **P ≤ .01, ***P ≤ .001, and ****P ≤ .0001.
Results
Normal number of NK cells in NKG2D/NKp46 double-deficient mice
Mice deficient for both NKG2D and NKp46 expression (Klrk1−/−; Ncr1gfp/gfp mice, designated “DKO”) were generated on a C57BL/6 background as described in supplemental Figure 1A. NK cell development was assessed in various tissues comparing DKO mice with single mutant and WT littermates.
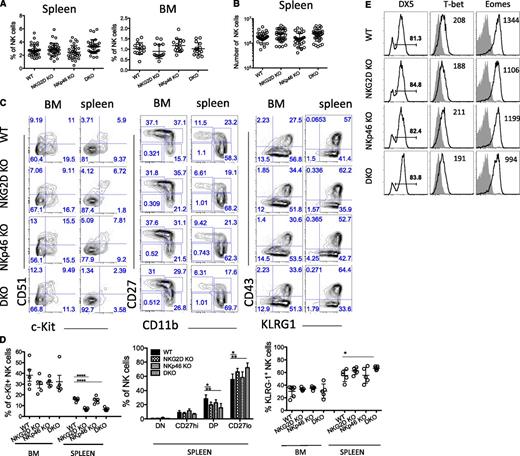
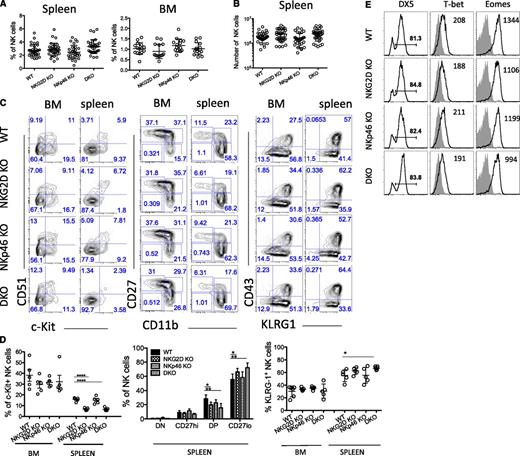
The frequencies of NK cells in the spleen, bone marrow (BM), liver, lung, and lymph nodes of DKO mice (Figure 1A and supplemental Figure 1B), as well as the absolute number of NK cells in the spleen of DKO mice (Figure 1B), were comparable with those in single mutants and in WT mice. Furthermore, the percentages of B cells, CD3+ T cells, and γδT cells were not significantly different in mice of each genotype (data not shown).20 Hence, NK-cell development in terms of cellularity is not impaired in the absence of either activating receptor separately or in the absence of both.
NKG2D and NKp46 are not necessary for NK-cell development. (A-B) Percentages of NK cells in the spleen and BM of WT and mutant mice are depicted for individual mice analyzed in 3 to 6 independent experiments; mean ±SD is shown for each genotype. Absolute numbers of NK cells in the spleen are shown in (B). (C-D) Representative fluorescence-activated cell sorting (FACS) profiles from a mouse of each genotype showing expression of the indicated markers (C), and percentages of cells expressing various marker combinations (n = 5 mice/genotype) (D). Data are representative of at least 4 independent experiments. (E) BM NK cells were stained for the cell-surface expression of DX5 and intracellular expression of the transcription factors T-bet and Eomes; median fluorescence intensities are indicated. Data are representative of 3 independent experiments.
NKG2D and NKp46 are not necessary for NK-cell development. (A-B) Percentages of NK cells in the spleen and BM of WT and mutant mice are depicted for individual mice analyzed in 3 to 6 independent experiments; mean ±SD is shown for each genotype. Absolute numbers of NK cells in the spleen are shown in (B). (C-D) Representative fluorescence-activated cell sorting (FACS) profiles from a mouse of each genotype showing expression of the indicated markers (C), and percentages of cells expressing various marker combinations (n = 5 mice/genotype) (D). Data are representative of at least 4 independent experiments. (E) BM NK cells were stained for the cell-surface expression of DX5 and intracellular expression of the transcription factors T-bet and Eomes; median fluorescence intensities are indicated. Data are representative of 3 independent experiments.
Terminally differentiated NK cells are more represented in DKO and NKG2D-KO mice
Markers expressed early in NK-cell development, including the interleukin (IL)-2/IL-15 receptor common-β-chain (CD122), the NK1.1 receptor (NKRP1C), and the IL-7 receptor-α chain (CD127) showed similar expression profiles on NK cells from all genotypes (data not shown). We observed a lower percentage of c-Kit+ (CD117) cells among splenic NK cells of NKG2D-KO, consistent with published results from analysis of a different NKG2D knockout (KO) strain,28 but among BM NK cells, the difference was not statistically significant (Figure 1C-D, left panel). The difference was also detected in DKO mice but not in NKp46-KO mice (Figure 1C-D, left panel).
We assessed NK cell differentiation status according to CD11b and CD27 expression.33,34 In the spleen, mature CD27loCD11bhi (referred to as CD27lo) NK cells tended to be slightly more represented in NKG2D-KO and DKO mice (Figure 1C-D, middle panel), but this trend was modest and was in fact not statistically significant in half of the experiments (7 of 14 independent experiments). A similar trend was observed in the BM, liver and lung tissues (supplemental Figure 1C and data not shown). We also observed that among splenic NK-cell subsets, c-Kit+ cells were less frequent among the mature CD11bhi CD27hi (referred to as DP) and CD27lo subsets in NKG2D-KO and DKO mice (supplemental Figure 1D), which correlated with the differences seen in the unseparated NK-cell population (Figure 1D, left panel).
Other markers associated with later stages of NK-cell development include DX5, CD43, and KLRG1; a slight increase in the percentage of KLRG1+ NK cells was noticed in absence of NKG2D, but the difference was significant in only half (4 of 8) experiments (Figure 1C-D, right panel). We also tested the level of expression of T-bet and Eomes, 2 transcription factors associated with NK-cell maturation,35,36 and saw no significant differences when comparing mutants to WT mice (Figure 1E). Altogether, these data indicated that NKG2D deficiency had a slight effect on NK-cell differentiation. This was not the case for NKp46 deficiency, and no synergistic or added effect was seen in DKO mice compared with NKG2D-KO mice.
Alterations in the repertoire of NK-cell receptors in mutant mice
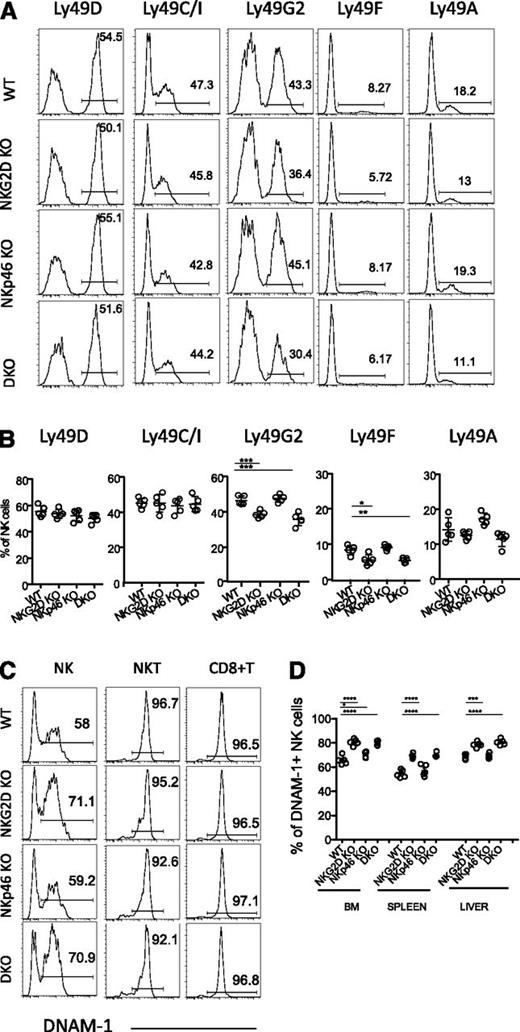
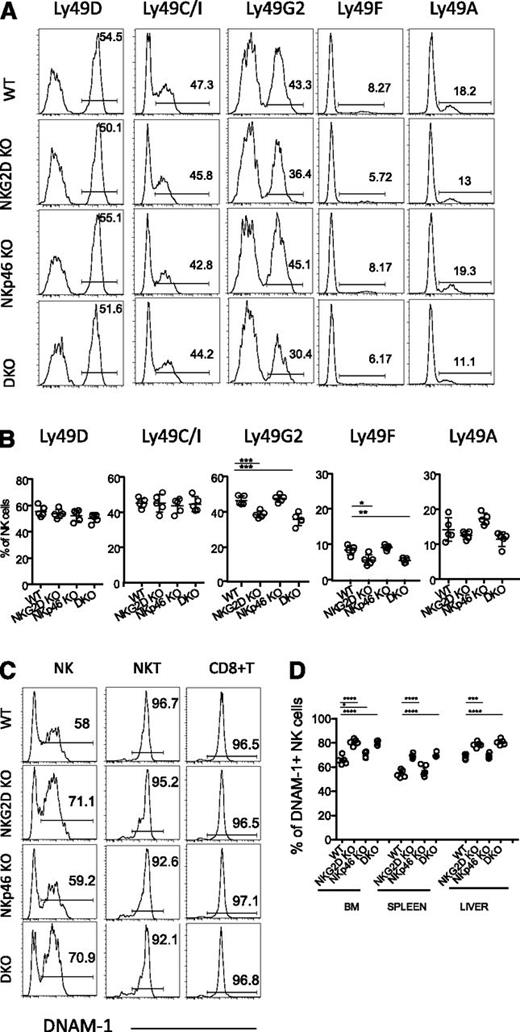
As shown in a previous report,20 a modestly lower mean percentage of NK cells expressed Ly49G2 in NKG2D-KO mice than in WT mice. The difference was statistically significant. A similar difference was seen in DKO mice but not in NKp46-KO mice (Figure 2A-B). The difference was also apparent among NK cells in the BM, lung, liver, and lymph nodes (supplemental Figure 2A and data not shown) and among both mature and immature NK cells (supplemental Figure 2B-C). Ly49F+ and Ly49A+ NK cells were also less represented in DKO and NKG2D-KO mice compared with WT mice in most experiments (Figure 2A-B, supplemental Figure 2A and data not shown), whereas Ly49C/I, Ly49D, NKG2A/C/E, and 2B4 were similarly expressed in each genotype (Figure 2A-B, supplemental Figure 2A and data not shown).
Differences in the NK-cell receptor repertoire in NKG2D-deficient mice. (A) Representative FACS histograms and (B) percentages of splenic NK cells expressing Ly49D, Ly49C/I, Ly49G2, Ly49F, and Ly49A are shown for 5 mice per genotype. Data are representative of at least 5 independent experiments. (C) Representative FACS histograms depicting DNAM-1 expression on splenic NK cells (CD3-gfp+), NKT cells (CD3lo, NK1.1+), and CD8+ T cells from 1 mouse of each indicated genotype (representative of at least 10 individual mice/genotype). (D) Percentages of DNAM-1–expressing NK cells in BM, spleen, and liver of 5 mice per genotype. Data are representative of at least 4 individual experiments.
Differences in the NK-cell receptor repertoire in NKG2D-deficient mice. (A) Representative FACS histograms and (B) percentages of splenic NK cells expressing Ly49D, Ly49C/I, Ly49G2, Ly49F, and Ly49A are shown for 5 mice per genotype. Data are representative of at least 5 independent experiments. (C) Representative FACS histograms depicting DNAM-1 expression on splenic NK cells (CD3-gfp+), NKT cells (CD3lo, NK1.1+), and CD8+ T cells from 1 mouse of each indicated genotype (representative of at least 10 individual mice/genotype). (D) Percentages of DNAM-1–expressing NK cells in BM, spleen, and liver of 5 mice per genotype. Data are representative of at least 4 individual experiments.
Interestingly, there was a higher percentage of DNAM-1–expressing NK cells in NKG2D-KO and DKO mice, whereas no such difference was observed in the case of NKT cells and CD8+ T cells (Figure 2C). The higher percentage of DNAM-1+ NK cells was observed among BM, spleen, liver, and lung deficient for NKG2D (Figure 2D and data not shown) and among mature as well as immature NK cells (supplemental Figure 2E). The level of DNAM-1 expression (mean fluorescence intensity of staining) was similar in DNAM-1+ NK cells from all genotypes (Figure 2C and data not shown). LFA-1, an adhesion molecule functionally linked to DNAM-1,37 was similarly expressed on all NK cells, regardless of DNAM-1 expression (supplemental Figure 2D). These data as a whole indicate that NKG2D, but not NKp46, influences the expression of specific receptors on a small fraction of NK cells, and the changes are apparent among both immature and mature NK cells.
Increased IFN-γ response from DKO and NKG2D KO NK cells activated by selective in vitro stimuli
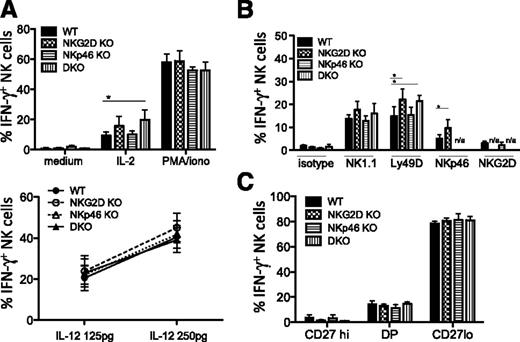
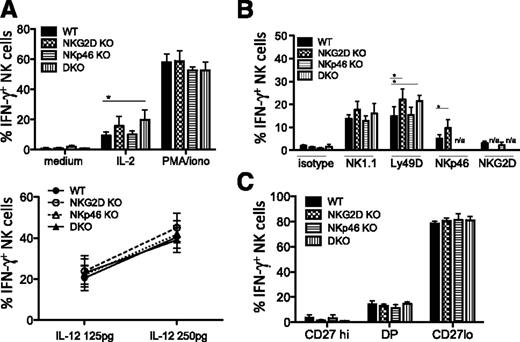
Functional studies showed modest increases in responses of NKG2D KO NK cells to stimuli in vitro, though not in all experiments. When stimulated with IL-2 but not with IL-12/IL-18 in vitro, NK cells from NKG2D-KO and DKO mice showed a higher percentage of IFN-γ production (Figure 3A). When stimulated with plate-bound Ly49D, NK1.1, and NKp46 antibodies, we often but not always observed a significantly higher percentage of IFN-γ+ cells with NK cells from NKG2D-KO and DKO mice (Figure 3B). These differences were significant in 4 of 5 independent experiments when stimulating with NKp46 antibody, but only in 3 of 7 experiments with NK1.1 and Ly49D antibodies (often performed with several antibody concentrations). The intensity of IFN-γ staining of positive cells did not differ significantly between genotypes. The CD107a responses to the aforementioned stimuli provided similar trends as the IFN-γ responses (data not shown). When gating on the NK subsets, we observed that the CD27lo terminally mature NK cells were the main IFN-γ–producing cells and that each of the maturation states defined by CD27 expression responded equivalently (Figure 3C). In combination with the data showing a slightly higher percentage of CD27lo cells among NKG2D-KO and DKO NK cells (Figure 1D), the data suggest that the increase in functional response is caused by an increase in the representation of the terminally mature CD27lo subset rather than to changes in the responses of cells within a subset.
Increased IFN-γ response to stimulation with IL-2, anti-Ly49D, and anti-NKp46 in NKG2D-deficient mice. (A) Percentages of IFN-γ–producing NK cells upon stimulation with IL-2 (1000 U/mL), PMA/ionomycin (upper panel), and IL-18 (5 ng/mL) + IL-12 (125 pg/mL and 250 pg/mL)(lower panel) are shown for 5 to 6 mice/genotype; data are representative of 3 individual experiments. (B) Percentages of IFN-γ–producing NK cells upon stimulation with anti-NK1.1 (25 μg/mL), anti-Ly49D (5 μg/mL), anti-NKp46 (5 μg/mL), and anti-NKG2D (25 μg/mL) antibodies (n = 3-5 mice/genotype). Data are representative of at least 3 independent experiments. (C) Percentages of IFN-γ–producing NK cells among CD27hiCD11blo (“CD27hi”), DP (“CD27+CD11b+”), and CD27loCD11bhi (“CD27lo”) subsets upon anti-Ly49D stimulation (n = 5 mice/genotype). Data are representative of 5 independent experiments.
Increased IFN-γ response to stimulation with IL-2, anti-Ly49D, and anti-NKp46 in NKG2D-deficient mice. (A) Percentages of IFN-γ–producing NK cells upon stimulation with IL-2 (1000 U/mL), PMA/ionomycin (upper panel), and IL-18 (5 ng/mL) + IL-12 (125 pg/mL and 250 pg/mL)(lower panel) are shown for 5 to 6 mice/genotype; data are representative of 3 individual experiments. (B) Percentages of IFN-γ–producing NK cells upon stimulation with anti-NK1.1 (25 μg/mL), anti-Ly49D (5 μg/mL), anti-NKp46 (5 μg/mL), and anti-NKG2D (25 μg/mL) antibodies (n = 3-5 mice/genotype). Data are representative of at least 3 independent experiments. (C) Percentages of IFN-γ–producing NK cells among CD27hiCD11blo (“CD27hi”), DP (“CD27+CD11b+”), and CD27loCD11bhi (“CD27lo”) subsets upon anti-Ly49D stimulation (n = 5 mice/genotype). Data are representative of 5 independent experiments.
NKp46-KO NK cells showed responses comparable with WT NK cells for all stimuli tested (Figure 3A-B). Furthermore, when comparing NKp46gfp/gfp (NKp46-KO) NKp46gfp/+ and NKp46+/+ littermates, we observed no significant difference in the frequencies of Ly49+ NK cells, CD11b/CD27 subsets, or KLRG1+ NK cells (supplemental Figure 3A and data not shown). In addition, IFN-γ and CD107a responses to NK1.1, NKG2D, and Ly49D stimulations were comparable for NK cells from all littermates (supplemental Figure 3B). Altogether, we show the presence of a larger fraction of terminally mature NK cells in the absence of NKG2D but not NKp46, which correlates with a better IFN-γ response to selective stimuli applied in vitro.
Similar lytic activity from mutants and WT NK cells
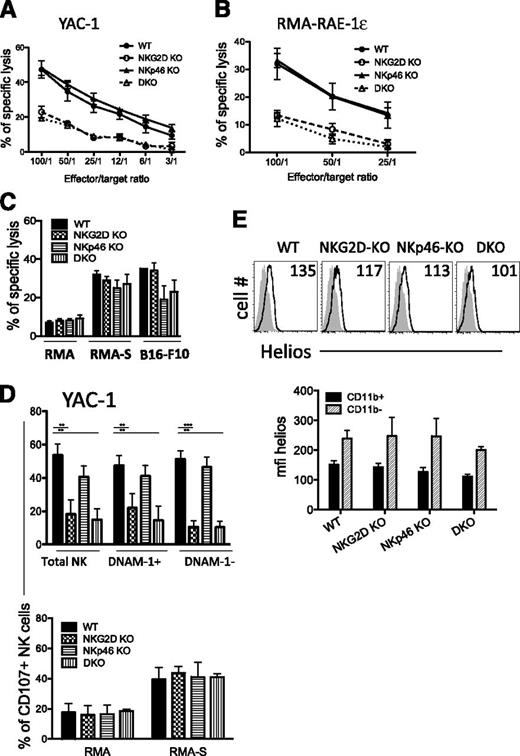
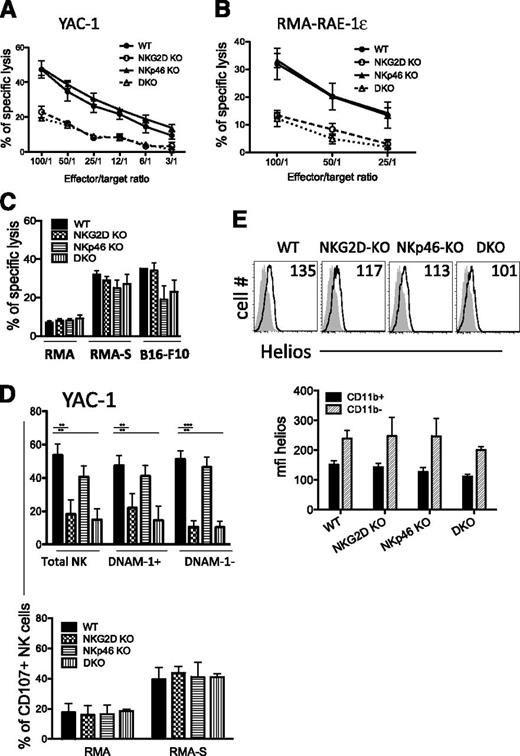
We sought to further assess the consequences of these phenotypic alterations on NK-cell killing against tumor cell lines. As expected, IL-2–activated NK cells from NKG2D-KO and DKO mice were significantly less lytic than WT NK cells against target cells expressing NKG2D ligands, such as RMA-RAE-1-ε or YAC-1 tumor cells (Figure 4A-B,D, upper panel). In contrast, NKp46-KO and WT NK cells killed both targets to the same extent.
Killing activity from mutant NK cells is intact. (A-B) Killing activity of d5-activated NK cells was assessed in a 35S release assay against YAC-1 and RMA-RAE ε target cells at different effector/target ratios. (C) Killing activities of d5-sorted NK cells against RMA, RMA-S, and B16-F10 targets (E/T ratio = 10/1). Results (mean ± SD) are representative of 2 to 3 independent experiments. (D) Percentages of CD107a+ NK cells upon 5-hour incubation with YAC-1 (upper panel) and RMA and RMA-S cells (lower panel). Results are representative of 2 independent experiments. (E) Representative FACS histograms depicting Helios expression in CD11b+ NK cells from splenocytes of each genotype. Helios staining corresponds to the plain lines, whereas isotype control is depicted as the shaded histograms (upper panel). The mean fluorescence intensity of intracellular Helios staining among CD11b+ and CD11b– NK cells is shown in the lower panel (n = 3-5 mice/genotype). The data are representative of 3 experiments.
Killing activity from mutant NK cells is intact. (A-B) Killing activity of d5-activated NK cells was assessed in a 35S release assay against YAC-1 and RMA-RAE ε target cells at different effector/target ratios. (C) Killing activities of d5-sorted NK cells against RMA, RMA-S, and B16-F10 targets (E/T ratio = 10/1). Results (mean ± SD) are representative of 2 to 3 independent experiments. (D) Percentages of CD107a+ NK cells upon 5-hour incubation with YAC-1 (upper panel) and RMA and RMA-S cells (lower panel). Results are representative of 2 independent experiments. (E) Representative FACS histograms depicting Helios expression in CD11b+ NK cells from splenocytes of each genotype. Helios staining corresponds to the plain lines, whereas isotype control is depicted as the shaded histograms (upper panel). The mean fluorescence intensity of intracellular Helios staining among CD11b+ and CD11b– NK cells is shown in the lower panel (n = 3-5 mice/genotype). The data are representative of 3 experiments.
NK-cell activation via activating receptors distinct from NKG2D and NKp46 was assessed against RMA-S target cells, which lack NKG2D ligands and are MHC-I–deficient. NK cells from WT mice and all of the mutants showed comparable levels of cytotoxicity and CD107a externalization against RMA-S target cells (Figure 4C–D, lower panel). We also tested lysis of B16-F10 cells, which also lack NKG2D ligands but reportedly express NKp46 ligands.38 We observed lower killing of B16-F10 cells by NK cells from NKp46-KO and DKO mice, but not by NK cells from NKG2D-KO mice (Figure 4C). The similar killing of B16-F10 cells by NKG2D-KO NK cells was notable because DNAM-1+ NK cells were more frequent among these NK cells (Figure 2D), and B16-F10 cells express DNAM-1 ligands CD112 and CD155.39
Helios is a transcription factor expressed by immune cells including NK cells, of interest here because its expression is correlated with a lower stimulation threshold of CD11b+ mature NK cells.29 In our studies, Helios expression was indeed higher in CD11b+ than in CD11b– NK cells, as previously described29 (Figure 4E, bottom). However, CD11b+ NK cells from WT and all of the mutant mice showed a similar expression profile for Helios (Figure 4E, top). In sum, our data demonstrated that despite the increased IFN-γ response observed in some cases for NK cells from NKG2D-KO and DKO mice, lytic activity against target cells that do not express NKG2D ligands was unaffected.
Differences in NK-cell receptor expression are intrinsic to NKG2D-deficient NK cells
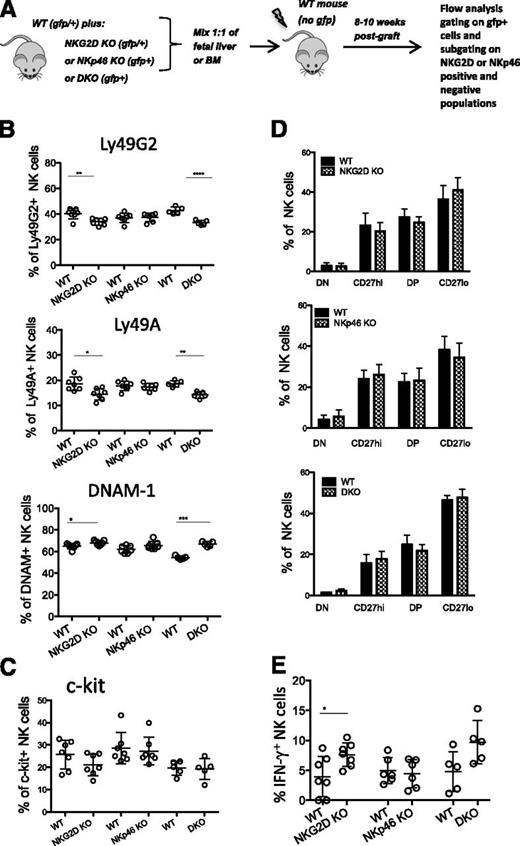
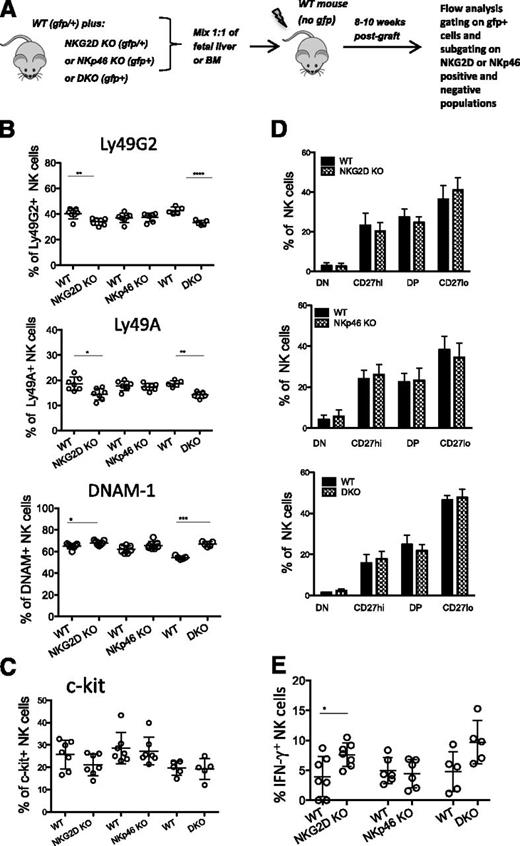
To determine whether the alterations observed in DKO and NKG2D-KO mice were intrinsic to NK cells, irradiated hosts (WT mice) were reconstituted with a 1:1 mixture of WT and mutant precursor cells from fetal liver or BM (Figure 5A). The differences in Ly49G2, Ly49A, and DNAM-1 expression between NK cells from NKG2D-KO or DKO mice and WT mice was recapitulated on separately gated mutant and WT NK cells from the chimeras (Figure 5B). These data suggest that the differences are NK-intrinsic; similar results were obtained with NK cells from BM or liver of the chimeras (data not shown). It was less clear whether the differences in the expression of c-Kit and CD11b/CD27 were intrinsic, because the differences in the chimeras were not statistically significant, although the NKG2D-KO–derived cells did trend toward a lower percentage of c-Kit+ cells and a skew toward the more mature (CD27lo) phenotype (Figure 5C-D and supplemental Figure 4A). In response to NK1.1 Ab stimulation, the NKG2D-KO and DKO NK cells in the chimeras responded slightly better than the WT NK cells (Figure 5E and supplemental Figure 4B). Thus, differences in Ly49 and DNAM expression were NK-intrinsic, whereas differences in c-Kit expression, CD11b/CD27 expression and functional responses showed similar trends but were less clearly intrinsic to NK cells.
Differences in NK-receptor expression are intrinsic to mutant NK cells. (A) Schematic diagram depicting the experiment. 1:1 mixtures of fetal liver or BM cells, both gfp+, from WT mice and NKG2D-KO, NKp46-KO, or DKO mice were injected (intravenously) into lethally irradiated WT recipients (gfp-negative). FACS analysis was performed 8 to 12 weeks post transplant by gating on gfp+ NK cells. Further gating using NKG2D or NKp46 markers was used to distinguish donor NK cells of WT or mutant origin. (B-C) Percentages of NK cells expressing Ly49G2, Ly49A, DNAM-1, and c-Kit in the spleens of recipient mice reconstituted with WT/NKG2D-KO, WT/NKp46-KO, and WT/DKO precursor cell mixtures. (D) Percentages of CD11b/CD27 subsets of NK cells in recipient mice reconstituted with WT/NKG2D-KO (upper), WT/NKp46-KO (middle), and WT/DKO (lower) precursor cell mixtures. (E) Percentages of IFN-γ responding NK cells from chimeric mice stimulated with anti-NK1.1 in vitro. All data are representative of 3 independent experiments (n = 5-7 mice/genotype)
Differences in NK-receptor expression are intrinsic to mutant NK cells. (A) Schematic diagram depicting the experiment. 1:1 mixtures of fetal liver or BM cells, both gfp+, from WT mice and NKG2D-KO, NKp46-KO, or DKO mice were injected (intravenously) into lethally irradiated WT recipients (gfp-negative). FACS analysis was performed 8 to 12 weeks post transplant by gating on gfp+ NK cells. Further gating using NKG2D or NKp46 markers was used to distinguish donor NK cells of WT or mutant origin. (B-C) Percentages of NK cells expressing Ly49G2, Ly49A, DNAM-1, and c-Kit in the spleens of recipient mice reconstituted with WT/NKG2D-KO, WT/NKp46-KO, and WT/DKO precursor cell mixtures. (D) Percentages of CD11b/CD27 subsets of NK cells in recipient mice reconstituted with WT/NKG2D-KO (upper), WT/NKp46-KO (middle), and WT/DKO (lower) precursor cell mixtures. (E) Percentages of IFN-γ responding NK cells from chimeric mice stimulated with anti-NK1.1 in vitro. All data are representative of 3 independent experiments (n = 5-7 mice/genotype)
NKG2D-KO mice on a BALB.B6-Cmv1r background
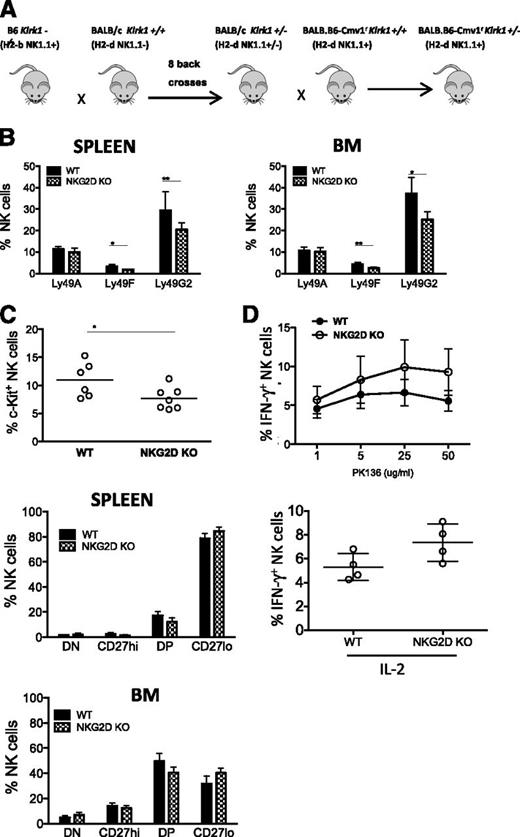
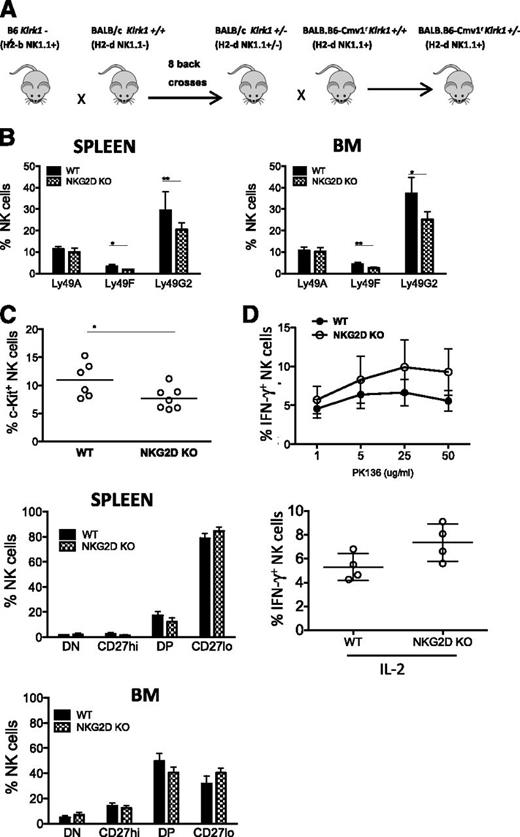
The 3 inhibitory receptors whose expression was altered in NKG2D-KO mice, Ly49G2, Ly49A, and Ly49F, show little to no reactivity with the MHC molecules in B6 mice. To investigate whether MHC engagement of inhibitory receptors, or lack of it, is a determinant for the altered expression of the receptors in NKG2D-KO mice, we generated mice deficient for NKG2D on a BALB/c background (Figure 6A). Compared with B6 MHC molecules, the MHC-I molecules of H-2d haplotype are known to react more strongly with Ly49G2, Ly49A, and Ly49F inhibitory receptors.
Analysis of NKG2D deficiency in BALB.B6-Cmv1r mice. (A) Schematic diagram depicting the breeding scheme used to generate NKG2D-deficient mice on a BALB.B6-Cmv1r background. C57BL/6 NKG2D KO mice were backcrossed 8 times to BALB/c mice, and the backcrossed Klrk1+/− offspring were then backcrossed once to the congenic BALB.B6-Cmv1r strain that carries B6 donor alleles from the NKC complex before intercrossing to generate BALB.B6-Cmv1rKlrk1−/− and BALB.B6-Cmv1rKlrk1+/+ littermates. (B) Percentages of splenic NK cells expressing Ly49A, Ly49F, and Ly49G2 from BALB.B6-Cmv1r NKG2D-KO and BALB.B6-Cmv1r WT littermates (gated CD3-NK1.1+). Data are mean ± SD and are representative of 2 to 3 independent experiments. (C) Percentages of c-Kit+ NK cells (upper) and CD11b/CD27 NK subsets in the spleen (middle) and BM (lower) of WT and NKG2D-KO mice. (D) Percentages of IFN-γ–producing NK cells cross-linked with ant-NK1.1 (PK136) (upper) or stimulated with IL-2 in vitro (lower). Data are expressed as mean ± SD and are representative of 3 independent experiments.
Analysis of NKG2D deficiency in BALB.B6-Cmv1r mice. (A) Schematic diagram depicting the breeding scheme used to generate NKG2D-deficient mice on a BALB.B6-Cmv1r background. C57BL/6 NKG2D KO mice were backcrossed 8 times to BALB/c mice, and the backcrossed Klrk1+/− offspring were then backcrossed once to the congenic BALB.B6-Cmv1r strain that carries B6 donor alleles from the NKC complex before intercrossing to generate BALB.B6-Cmv1rKlrk1−/− and BALB.B6-Cmv1rKlrk1+/+ littermates. (B) Percentages of splenic NK cells expressing Ly49A, Ly49F, and Ly49G2 from BALB.B6-Cmv1r NKG2D-KO and BALB.B6-Cmv1r WT littermates (gated CD3-NK1.1+). Data are mean ± SD and are representative of 2 to 3 independent experiments. (C) Percentages of c-Kit+ NK cells (upper) and CD11b/CD27 NK subsets in the spleen (middle) and BM (lower) of WT and NKG2D-KO mice. (D) Percentages of IFN-γ–producing NK cells cross-linked with ant-NK1.1 (PK136) (upper) or stimulated with IL-2 in vitro (lower). Data are expressed as mean ± SD and are representative of 3 independent experiments.
Similar to the observations made in the B6 background, the percentages of Ly49G2+ and Ly49F+ NK cells were significantly reduced in BALB.B6-Cmv1rKlrk1−/− compared with BALB.B6-Cmv1rKlrk1+/+ mice (Figure 6B). Ly49A and DNAM-1 expression, however, were not significantly different in mutant and WT mice (Figure 6B and data not shown). NKG2D-KO NK cells from BALB.B6-Cmv1r mice showed a significantly decreased percentage of c-Kit+ NK cells, similar to B6 NKG2D-KO NK cells (Figure 6C). Other differences observed for B6 NKG2D-KO NK cells were not statistically significant in the BALB/c background, although the data trended in the same direction. The latter differences included an increased percentage of the terminally mature CD27lo NK cell subset and greater functional responses to stimulation with NK1.1, Ly49D, and NKp46 antibodies or to cytokines (Figure 6C-D and data not shown).
MCMV infection is comparable in WT and NKG2D-KO mice
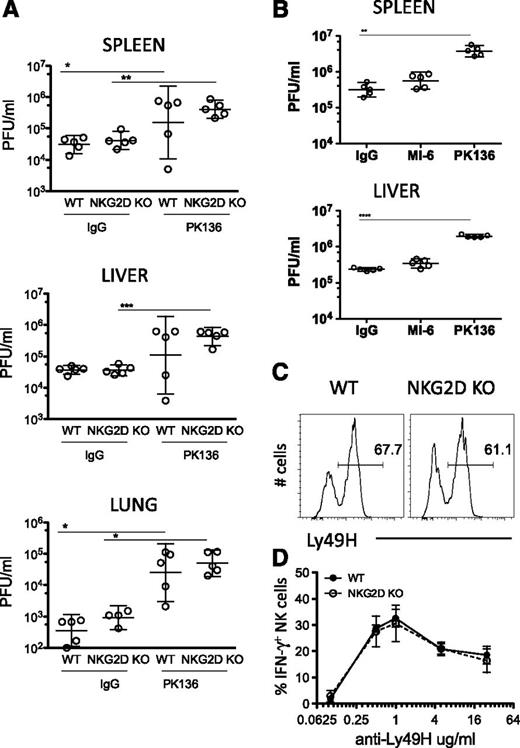
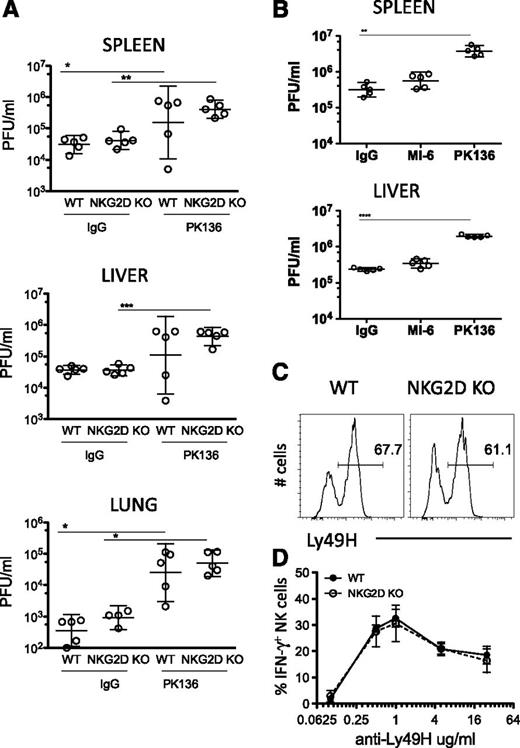
To assess whether the alterations caused by the absence of NKG2D alter the functions of NK cells in vivo, we infected NKG2D-KO and WT littermates (C57BL/6 background) with the WT strain of the mouse cytomegalovirus (MCMV). At d4 post infection, viral titers (PFU) in the spleen, liver, and lungs of NKG2D-KO were not statistically different from those in WT mice (Figure 7A). NK-cell depletion of the mice before infection resulted in higher viral titers, confirming the role of NK cells in limiting the infection (Figure 7A). As expected, NKG2D blockade in vivo, by pretreating WT mice with NKG2D antibodies, also had little or no effect on MCMV titers (Figure 7B). The percentages of Ly49H+ NK cells and the levels of expression of Ly49H on NK cells were comparable in NKG2D-KO and WT mice (Figure 7C); the IFN-γ response to Ly49H antibody stimulation was similar in 2 of 3 experiments (Figure 7D). The Ly49H receptor is known to play a central role in NK-dependent control of MCMV infections in B6 mice. Hence, we demonstrate that the absence of NKG2D does not alter the NK cell response to MCMV in vivo.
NK-cell resistance to MCMV infection is not enhanced in the absence of NKG2D. (A) B6 NKG2D-KO and WT littermates were treated with anti-NK1.1 or control IgG before infection with MCMV (1 × 10⁶ PFU intraperitoneally); virus titers were assessed in the liver, spleen, and lungs 4 days post infection. Data are representative of 3 independent experiments. (B) Groups of WT mice were treated with 250 μg of anti-NK1.1 (PK136), anti-NKG2D (MI-6), or control IgG before infection with MCMV (3 × 10⁶ PFU intraperitoneally) of MCMV; virus titers in the spleen and liver were assessed 3 days post infection. Data are representative of 2 independent experiments. All results are expressed as geometric mean ± SD of 5 mice per group. (C) Representative FACS profile of Ly49H expression on NK cells from WT and NKG2D-KO mouse. (D) Percentages of IFN-γ–producing NK cells upon stimulation with anti-Ly49H at the indicated concentrations. Data are representative of 2 of 3 independent experiments.
NK-cell resistance to MCMV infection is not enhanced in the absence of NKG2D. (A) B6 NKG2D-KO and WT littermates were treated with anti-NK1.1 or control IgG before infection with MCMV (1 × 10⁶ PFU intraperitoneally); virus titers were assessed in the liver, spleen, and lungs 4 days post infection. Data are representative of 3 independent experiments. (B) Groups of WT mice were treated with 250 μg of anti-NK1.1 (PK136), anti-NKG2D (MI-6), or control IgG before infection with MCMV (3 × 10⁶ PFU intraperitoneally) of MCMV; virus titers in the spleen and liver were assessed 3 days post infection. Data are representative of 2 independent experiments. All results are expressed as geometric mean ± SD of 5 mice per group. (C) Representative FACS profile of Ly49H expression on NK cells from WT and NKG2D-KO mouse. (D) Percentages of IFN-γ–producing NK cells upon stimulation with anti-Ly49H at the indicated concentrations. Data are representative of 2 of 3 independent experiments.
Discussion
NK cells are educated to adjust their responsiveness to the surrounding environment, and engagement of inhibitory receptors has been shown to play a significant role in this process. Here, we sought to address the relevance of activating receptors in NK-cell development and function by generating mice deficient for 2 potent activating receptors, NKG2D and NKp46, separately or in combination. Our findings revealed that neither receptor is required for NK-cell development, separately or together. NKG2D but not NKp46 has an impact, albeit modest, on shaping the Ly49 NK-cell receptor repertoire and in regulating the differentiation program of NK cells. Despite a slight increase in NK-cell function in vitro, NK cells deficient for NKG2D revealed normal NKG2D-independent functions in vivo in MCMV-infected mice.
The chimera experiments demonstrate unequivocally that NKG2D expression influences Ly49 expression intrinsically in NK cells. Also, NKG2D-dependent education of NK cells led to a skewing in the repertoire of DNAM-1–expressing cells. We saw no correlation between the expression of several Ly49 and DNAM-1 receptors in the NK cells that lack NKG2D, indicating that the alterations in the NK cell repertoire are not confined to a particular NK subset that we can define independently. Some of the other alterations, such as the skew toward greater NK-cell maturity as a result of NKG2D deficiency, were less apparent in the chimeras. It remains unclear whether this is an experimental issue, reflecting the small influences studied and the consequent difficulty in obtaining reproducibly significant results, or whether it instead indicates a nonintrinsic effect of NKG2D on the maturational state of NK cells.
We considered the possibility that the loss of activating receptors studied here is compensated by the upregulation of others. The increase in the percentage of DNAM1+ cells is consistent with this possibility. However, we did not observe increases in the staining intensity of DNAM-1 on the positive cells, nor was there an increase in 2B4, Ly49H, or Ly49D expression.
We do not know if the contribution of NKG2D to shaping the repertoire of Ly49 receptors relies on its engagement with NKG2D ligands under steady-state conditions. NKG2D ligand expression may occur to a limited extent under normal conditions.40-43 In light of this possibility, it is interesting to consider our findings that NKG2D-dependent alterations in Ly49 expression occurred even at the earliest stage of NK-cell maturation in the BM (CD27hi/CD11blo) (supplemental Figure 2C). It is tempting to propose, on this basis, that NKG2D ligand interactions represent a stimulus for differentiating NK cells that is involved in the induction of de novo expression of Ly49 receptors. It has been proposed previously that de novo expression of Ly49 receptor genes during the differentiation process might depend on prior engagement of stimulatory receptors,44 but evidence for this proposition has been scant.
The changes observed in the NKG2D-KO mouse repertoire concern NK cells expressing Ly49G2, Ly49F, and Ly49A in the B6 and BALB.B6 background. This suggests that NKG2D shapes the repertoire by favoring the emergence of NK cells bearing particular inhibitory receptors in an MHC-I–independent manner. Previous data showed that Ly49A, Ly49F, and Ly49G2 are more impacted than other Ly49 receptors in MHC-I–deficient mice45,46 and that Ly49A- and Ly49F-expressing NK cells partly accounted for the hyporesponsiveness in MHC-I–deficient NK cells.45 In agreement with these data, we observed that Ly49A+ or Ly49F+ NK cells, which lack MHC-I ligands in the B6 WT background, were less responsive than Ly49A– and Ly49F– NK cells, respectively (data not shown). This was also the case in NKG2D-deficient mice, suggesting that the slightly better IFN-γ response to plate-bound stimulation seen in NKG2D-deficient NK cells could be caused by the decrease in the fraction of hyporesponsive Ly49A+ and Ly49F+ subsets and consequent increase in the fraction of competent Ly49A– and Ly49F– NK cells. Alternatively, the modest increase in the representation of the terminally mature CD27lo subset (Figure 1D) could contribute to this increased reactivity.
Interestingly, Guia et al showed that NK-cell hyporesponsivness correlated with the confinement of activating and inhibitory receptors in an actin meshwork at the plasma membrane, as opposed to responsive cells that display activating receptors compartmentalized in membrane nanodomains.45 These data underline the relationship between NK-cell tolerance and receptor distribution at the membrane, implying a selective and critical role for proximal signaling events. Observations from human NK cells indicate that NKG2D ligation alters the nanoscale organization of KIR2DL1 clusters in an MHC-I–independent fashion (D. Davis, personal communication). Hence, it is possible that NKG2D engagement alters the dynamic distribution of inhibitory receptors and thereby affects NK cell education. At a molecular level, how activating and inhibitory receptor engagement shapes the variegated NK-cell repertoire is still uncertain. Progress in understanding this process may come from multiparametric approaches such as high-resolution imaging of cells in flow or microchip-based apparatuses47 to assess concomitantly (1) the distribution of activating and inhibitory receptors, (2) the nature and intensity of proximal signaling events, and (3) the lytic capacity in individual NK cells.
It is important to mention that a role for NKG2D ligands in shaping the Ly49 repertoire via NKG2D is not supported by data from RAE-1 transgenic mice, in which ligand expression occurs constitutively on many cell types.48,49 No changes in the repertoire of NK-cell receptors were observed, suggesting that either NKG2D exerts its effect in a ligand-independent fashion or the limited ligand expression that occurs on cells in normal animals suffices to exert a maximal effect on the repertoire, which cannot be augmented by greater ligand expression. An example of a possible ligand-independent mechanism is that NKG2D deficiency increases the availability of DAP10- or DAP12-signaling adapters for pairing with other activating receptors. Regardless of whether NKG2D ligands play a role, the minor and selective effects of NKG2D on Ly49 expression suggest that other receptors and/or processes must play a greater role than NKG2D in the expression of Ly49 receptors.
It must also be emphasized that we have not observed much change in missing self-recognition because of NKG2D deficiency. NK cells from DKO and NKG2D-KO mice killed the RMA-S cell line as efficiently as WT NK cells. In addition, we have shown that NK cells deficient for NKG2D respond normally to missing self-recognition in vivo in studies of rejection of MHC-deficient,20 allogeneic, and semiallogeneic (unpublished data) BM grafts.
Although we have observed some changes in NK cells in NKG2D-KO mice, it is notable that these changes are subtle. The alterations did not, in our hands, affect the NK response to MCMV, and the functional and maturational changes observed were generally minor and in many cases did not reach statistical significance in all experiments. In comparing our results with those of Zafirova et al,28,50 numerous major changes they observed such as a decrease in the number of spleen cells per mouse, an increase in the percentage of splenic NK cells, a decrease in KLRG1 expression, and an enhanced resistance to MCMV infections were not evident in our experiments. Also, Ly49G2 expression was comparable in their mouse but consistently decreased in ours. The reasons for many of these discrepancies remain unclear. It is possible that the changes caused by NKG2D deficiency can be amplified depending on the microbiome, food, or other factors that may vary in different animal facilities. In sum, the alterations observed in our NKG2D-KO strain are on the whole very subtle, and the mice therefore remain a useful tool for gauging the role of NKG2D in functional studies.
The discrepancy between our results and those of Zafirova et al, with respect to MCMV infections, could be a result of the use of different strains of virus for the infections. They used a mutant MCMV, Δm157, which lacks the viral protein recognized by the Ly49H receptor on NK cells.28,50 The Ly49H-m157 interaction is considered crucial for NK-dependent control of MCMV in B6 mice.24,25 Therefore, the mechanism of NK-dependent control of Δm157 MCMV reported by Zafirova et al is unknown. Our results with WT MCMV suggest that any alterations in the NK cells in NKG2D-KO mice are too subtle to influence the well-defined Ly49H-dependent mechanism of viral control.
With regard to NKp46, Narni-Mancinelli et al have shown that NK cells from the Noe strain, which lacks cell surface NKp46 expression, responded better to various in vitro stimuli than did WT mice.29 This effect correlated with a higher level of the transcription factor Helios in Noe NK cells compared with WT NK cells. In our studies, NK cells from gene-targeted NKp46-deficient mice (Ncr1gfp/gfp) did not generally respond better than WT NK cells to stimulation via Ab, cytokines, or target cells expressing NKG2D ligands (Figures 3 and 4 and supplemental Figure 3). In addition, in contrast to the results reported with Noe mice, Ncr1gfp/gfp mice showed a normal level of Helios in CD11b+ NK cells. The discrepancy between our results and those obtained with NK cells from Noe mice underlines the existence of differences between these 2 models that remain to be defined. One significant difference between the models is that the Noe strain harbors a point mutation in the NKp46 gene, which does not prevent gene expression, whereas the Ncr1gfp/gfp mice carry a deletion introduced by gene targeting.
Because NKG2D and NKp46 are usually considered the major NK-activating receptors, it was plausible that they might act together, or redundantly, in NK-cell development. In particular, we wondered whether the double-mutant mice would have a greater phenotype with respect to Ly49 expression or NK maturation markers than either mutant alone. This was not the case, however, because the double-mutant mice were identical in all respects tested to the NKG2D-KO mice. Therefore, if activating receptors do in aggregate have a major impact on NK-cell development, other activating receptors must play a major role.
The potent antiviral and antitumor functions of NK cells have raised a strong interest in NK cell–based immunotherapy. Thus, it is critical to better understand the impact of activating NK receptors on NK-cell function, differentiation, and repertoire, because all of these factors can influence the capacity of NK cells to control infections, cancer, and autoimmune diseases. The mouse models developed in our studies represent a useful tool for investigating the complementary or synergistic effect of these 2 activating receptors in pathological contexts.
The online version of this article contains a data supplement.
The publication costs of this article were defrayed in part by page charge payment. Therefore, and solely to indicate this fact, this article is hereby marked “advertisement” in accordance with 18 USC section 1734.
Acknowledgments
The authors thank Jennifer Beck for technical assistance, Dr James R. Carlyle for providing comments on the manuscript, and Prof. Dan Davis for helpful discussions.
This work was supported by the Wellcome Trust (N.G.), a research grant from the US National Cancer Institute (R01-CA093678) (D.H.R.), a fellowship from the Biotechnology and Biological Sciences Research Council (BBSRC) (S.S.), and a postdoctoral fellowship from the Istituto Pasteur-Fondazione Cenci Bolognetti (M.A.).
Authorship
Contribution: S.S., C.T., and N.G. performed research and analyzed data; N.G. generated the Klrk1−/−BALB.B6 mouse; M.A. and L.Z. performed experiments on BALB.B6 and NKp46 littermates; D.S. performed MCMV experiments; N.G. and D.H.R. interpreted data; N.G. supervised research, analyzed data, and wrote the manuscript; and all authors contributed to experimental design and manuscript editing.
Conflict-of-interest disclosure: The authors declare no competing financial interests.
Correspondence: Nadia Guerra, Department of Life Sciences, Imperial College London, Imperial College Rd, SW7 2AZ London, UK; e-mail: n.guerra@imperial.ac.uk.
References
Author notes
S.S. and C.T. contributed equally to this study.

