Key Points
Decitabine treatment of in vitro expanded primary AML samples leads to global hypomethylation.
Highly methylated CpGs are most affected by decitabine-induced hypomethylation, with little influence on transcriptional activity.
Abstract
Acute myeloid leukemia (AML) is characterized by dysregulated gene expression and abnormal patterns of DNA methylation; the relationship between these events is unclear. Many AML patients are now being treated with hypomethylating agents, such as decitabine (DAC), although the mechanisms by which it induces remissions remain unknown. The goal of this study was to use a novel stromal coculture assay that can expand primary AML cells to identify the immediate changes induced by DAC with a dose (100nM) that decreases total 5-methylcytosine content and reactivates imprinted genes (without causing myeloid differentiation, which would confound downstream genomic analyses). Using array-based technologies, we found that DAC treatment caused global hypomethylation in all samples (with a preference for regions with higher levels of baseline methylation), yet there was limited correlation between changes in methylation and gene expression. Moreover, the patterns of methylation and gene expression across the samples were primarily determined by the intrinsic properties of the primary cells, rather than DAC treatment. Although DAC induces hypomethylation, we could not identify canonical target genes that are altered by DAC in primary AML cells, suggesting that the mechanism of action of DAC is more complex than previously recognized.
Introduction
Acute myeloid leukemia (AML) is a clonal hematopoietic neoplasm characterized by maturation arrest in the myeloid lineage. Treatment typically consists of induction chemotherapy with an anthracycline and cytarabine with the goal of achieving a complete remission,1,2 followed by consolidation therapy. Despite these measures, the mortality rate of AML is still very high. Although recent genomic advances have improved our understanding of AML pathogenesis and risk stratification3,4 the overall outcome is still dismal for most patients, and alternative treatment strategies are needed.
One alternative approach for the treatment of AML and myelodysplastic syndromes (MDS) is the use of hypomethylating agents, including the cytosine analogs 5-azacytidine (AZA) and 5-aza-2′-deoxycytidine (decitabine; DAC).5,6 These nucleosides are distinct from other cytosine analogs because they contain a pyrimidine ring modification that results in the covalent trapping of the maintenance DNA methyltransferase (DNMT1). This effect is cell-cycle dependent, because AZA and DAC must first be modified and incorporated into newly synthesized DNA; this leads to passive hypomethylation of DNA as cells divide, because of the depletion and degradation of DNMT1.7,8 Exposure to these drugs is also associated with cellular differentiation9,10 and cytotoxicity at higher doses.11
Although the impact of DAC and AZA on acute myeloid leukemia cell lines has been evaluated,9,12-14 studies on primary AML cells have been limited,9,14,15 primarily because of a lack of methods that can faithfully expand primary cells in vitro. Using well-annotated primary samples is especially important, because mutations in genes involved in DNA methylation (most notably DNMT3A),16,17 are now known to be common in AML. Here, we describe the genomic impact of short-term, low-dose DAC treatment on primary AML cells in vitro. This study was specifically designed to study the immediate impact of DAC on primary samples (an issue that has not yet been addressed in the current literature) to minimize the effects of confounding variables, such as differentiation. We found that a 3-day exposure to DAC resulted in hypomethylation that was non-random across the genome, because hypermethylated regions were more strongly affected. Surprisingly, although there was a strong correlation between DNA methylation and gene repression in untreated cells, the hypomethylation induced by short-term DAC exposure did not yield consistent expression changes in all AML samples. These findings begin to explore the complexity of cellular responses to DAC, and establish an in vitro method for performing genome-phenome correlations.
Methods
Culture of primary human AML cells
HS27 (CRL-1634), M2-10B4 (CRL-1972), and HS-27a (CRL-2496) stromal cells were obtained from ATCC. Early passage cells (< 20) were cultured in DMEM with 10% FBS and penicillin/streptomycin and irradiated (2000 cGy: M2-10B4 and HS-27a or 4000 cGy: HS27) approximately 24 hours before starting AML cocultures. All cryopreserved AML samples were collected as part of a study approved by the Human Research Protection Office at Washington University School of Medicine after patients provided informed consent in accordance with the Declaration of Helsinki. Primary AML cells (from either peripheral blood or bone marrow) cryopreserved in 10% DMSO were quickly thawed, resuspended in 40 mL of PBS with 20% FBS and centrifuged at 600g for 5 minutes. Cells were resuspended in DMEM supplemented with 15% FBS, 50μM β-mercaptoethanol, penicillin/streptomycin, and human cytokines (Peprotech) including SCF (100 ng/mL), IL3 (10 ng/mL), IL-6 (20 ng/mL), TPO (10 ng/mL), and FLT3L (10 ng/mL), and then plated on confluent irradiated stromal cells. Most experiments were performed in a 6-well plate with 500 000 stromal cells and 350 000 human AML cells added per well. Fresh growth media was added weekly; hemi-depopulation was performed when growth was excessive. Using this approach, approximately 70% of tested cases expanded > 2-fold during 1 week of culture.
Methylation array analysis
All methylation analyses were performed in R. Methylation array data were image-processed, normalized, and methylation values were calculated with the Bioconductor “lumi” package using methods described in the manual.18 Probes with a P value > .01 (10 253 CpGs across all arrays) were omitted and all analyses used the mean methylation β-value between replicates. Gene and CGI annotations were based on annotation files provided by Illumina and included gene-based annotations for TSS1500, TSS200, 5′ UTR, 1stExon, Gene Body, and 3′ UTR. For the purposes of this study, the first 4 of these were grouped into one “promoter” annotation. Approximately 25 000 CpGs have multiple annotations because a single CpG may be included in multiple annotation groups (eg, promoter and body) because of different transcript isoforms. Differentially methylated CpGs were identified using the CpGassoc package19 with default parameters and results were filtered to retain CpGs with an FDR < 0.01 and a mean change between DAC and mock of ≤ −0.2. Hierarchical clustering analysis was performed with the heatmap.2 function (gplots package) using the 1000 CpGs with the greatest standard deviation across all arrays. Density distributions were generated using kernel density estimation with the density function. Expression and methylation correlative analysis used the mean methylation value across all promoter CpGs and summarized expression values (described in supplemental Methods, available on the Blood Web site; see the Supplemental Materials link at the top of the online article) for all unique transcripts represented on both array platforms. Methylation data have been deposited in the Gene Expression Omnibus under accession no. GSE40870.
See supplemental Methods for additional information and experimental procedures.
Results
Establishing an in vitro culture system for primary AML samples
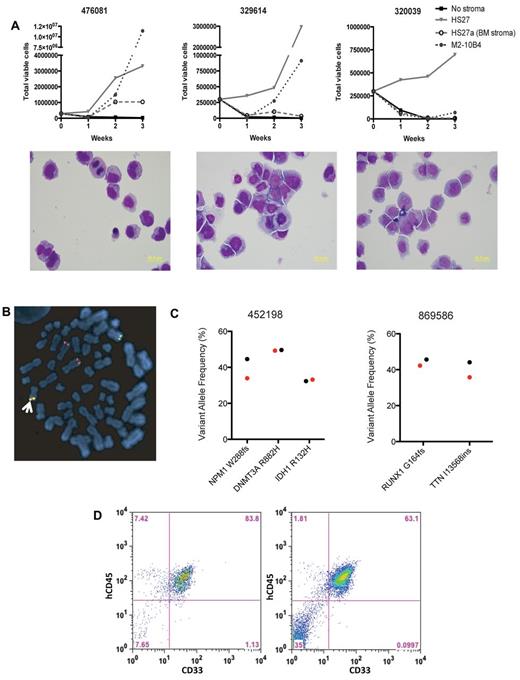
To develop a method to expand primary samples in vitro for genome-phenome correlations, we tested multiple different adherent murine and human stromal cells to determine whether they could support leukemia cell growth in the presence of a human cytokine mixture containing IL3, IL6, TPO, SCF, and FLT3 ligand. The ability of different stromal cells to support growth was variable. However, HS27, a human foreskin cell line, was the most consistent at supporting growth more than a 3-week period (Figure 1A). The presence of stroma was necessary for nearly all samples to expand (Figure 1A, and data not shown). The majority of the leukemia cells grow in liquid suspension, allowing for easy removal of leukemia cells for downstream analysis. During in vitro growth, cells demonstrated preservation of blast morphology (Figure 1A) and retained molecular abnormalities by fluorescence in situ hybridization (FISH; Figure 1B); somatic mutations in AML driver genes, including DNMT3A and RUNX1, were also preserved (Figure 1C). After expansion in culture, the cells demonstrated an expected increase in myeloid-specific genes at the expense of genes involved in erythroid and lymphoid development (no erythroid or lymphoid growth factors were present in the media), and an increase in the expression of genes involved in growth and cell cycle (supplemental Figure 1, supplemental Tables 1-2). Cultured cells were also able to engraft in NSG mice, suggesting that in vitro expansion does not result in a loss of leukemogenic potential (Figure 1D).
In vitro expansion of human AML cells. (A) Growth curves (top panels) and morphology (bottom panels) of primary AML cells plated on different stromal cells for 3 weeks. All cells were grown in the presence of human IL3, IL6, SCF, TPO, and FLT3 ligand. (B) Metaphase fluorescence in situ hybridization (FISH) for MLL rearrangement on UPN 410324 after 1 week of stromal coculture with a dual-color break apart probe, showing 1 normal 11q23 locus (yellow, arrow) and a typical rearrangement (separate red and green), as well as an extra 3′ MLL signal (red). This pattern was seen in 100 of 100 cells, and the identical rearrangement pattern was seen at the time of diagnosis. (C) Identification of AML-specific mutations in 2 primary AML samples. Shown are the variant allele frequencies at day 0 (black) and after 7 days of culture on HS27 stroma (red). (D) Engraftment of UPN 476081 at 16 weeks in the bone marrow of NSG mice after 2 weeks of growth on HS27 (right), compared with 476081 after overnight culture (left).
In vitro expansion of human AML cells. (A) Growth curves (top panels) and morphology (bottom panels) of primary AML cells plated on different stromal cells for 3 weeks. All cells were grown in the presence of human IL3, IL6, SCF, TPO, and FLT3 ligand. (B) Metaphase fluorescence in situ hybridization (FISH) for MLL rearrangement on UPN 410324 after 1 week of stromal coculture with a dual-color break apart probe, showing 1 normal 11q23 locus (yellow, arrow) and a typical rearrangement (separate red and green), as well as an extra 3′ MLL signal (red). This pattern was seen in 100 of 100 cells, and the identical rearrangement pattern was seen at the time of diagnosis. (C) Identification of AML-specific mutations in 2 primary AML samples. Shown are the variant allele frequencies at day 0 (black) and after 7 days of culture on HS27 stroma (red). (D) Engraftment of UPN 476081 at 16 weeks in the bone marrow of NSG mice after 2 weeks of growth on HS27 (right), compared with 476081 after overnight culture (left).
Impact of DAC treatment on primary AML cells
We next sought to determine whether we could treat cultured AML cells with DAC to study its impact. Cells from UPN476081 were treated with DAC more than a 3-day period with daily dosing, and its effects were compared with 100nM cytarabine (AraC). A continuous exposure to DAC was chosen to minimize remethylation20 ; a 3-day exposure to drugs was chosen to minimize the impact of DAC-induced differentiation, which would be expected to significantly alter methylation and expression patterns.21,22 Whereas AraC had a profound effect on cell growth and cell-cycle distribution (Figure 2A-B,D-E), DAC had only a modest influence on those parameters, with a slightly greater impact at higher concentrations. Increasing doses of DAC did result in a decrease in the percentage of methylated cytosine residues (Figure 2C), with the 100nM dose demonstrating the maximal response. In contrast, treatment with cytarabine did not cause a consistent change in total CpG methylation. Treatment with 10 or 100nM DAC for 3 days did not result in a significant change in the cell-surface expression of CD45 or CD33, nor was there an increase in expression of CD14, a marker of monocyte maturation (Figure 2F). Morphologic examination confirmed the results from flow cytometry (supplemental Figure 2). In contrast (and consistent with other reports),9,14 our preliminary studies did indeed demonstrate significant myeloid maturation and decreased growth rates in some primary samples when treated with DAC for more than 3 days (supplemental Figure 3). A similar constellation of findings was obtained with an independent primary AML sample (supplemental Figure 4).
Characterization of UPN 476081. Cells from 476081 were grown on stroma for 4 days, followed by a 3-day treatment with cytarabine (AraC) or decitabine (DAC). Drug was administered daily. After 3 days of treatment, the number of viable cells (A), annexin-positive cells (B), and total 5-methycytosine content by LC-MS/MS (C) was determined. (D-E) cell cycle profiles were determined after overnight EdU incorporation and DNA content was measured by FxCycle Violet DNA dye. Shown are representative flow plots (D) and distributions of cell cycle phase after drug treatment (E). All experiments were performed in triplicate; error bars represent 95% confidence intervals; asterisk indicates a significant change from mock treatment. (F) CD45dim/SSlow blast gate (top panel) and expression of CD33 and CD14 antigens (bottom panel) of cells from 476081 after drug treatment. (G) Heatmap showing mRNA fold change using the nanostring platform of drug treated cells relative to mock. Up-regulated genes are shown in red; down-regulated genes in green. Experiments were performed in triplicate; all data were normalized to GAPDH expression levels.
Characterization of UPN 476081. Cells from 476081 were grown on stroma for 4 days, followed by a 3-day treatment with cytarabine (AraC) or decitabine (DAC). Drug was administered daily. After 3 days of treatment, the number of viable cells (A), annexin-positive cells (B), and total 5-methycytosine content by LC-MS/MS (C) was determined. (D-E) cell cycle profiles were determined after overnight EdU incorporation and DNA content was measured by FxCycle Violet DNA dye. Shown are representative flow plots (D) and distributions of cell cycle phase after drug treatment (E). All experiments were performed in triplicate; error bars represent 95% confidence intervals; asterisk indicates a significant change from mock treatment. (F) CD45dim/SSlow blast gate (top panel) and expression of CD33 and CD14 antigens (bottom panel) of cells from 476081 after drug treatment. (G) Heatmap showing mRNA fold change using the nanostring platform of drug treated cells relative to mock. Up-regulated genes are shown in red; down-regulated genes in green. Experiments were performed in triplicate; all data were normalized to GAPDH expression levels.
To determine whether DAC-induced hypomethylation results in expression changes in UPN476081, we generated a custom nanostring array23 for digital quantification of RNA abundance (complete list of genes in supplemental Table 3), focusing on genes that were previously shown to be methylated in AML primary samples or cell lines (eg, CDH1 and CDKN2B), or methylated in many somatic cells (eg, H19, MAGEA1, CTAG1B).24-27 DAC treatment specifically increased the expression of highly methylated genes, such as H19, MAGEA1, and MAGEB2 (Figure 2G, supplemental Table 4), but the expression of many genes also increased after AraC treatment. Although the expression changes were modest, these results suggested that this assay can be adapted to study the direct impact of DAC on primary AML samples without the confounding variable of concurrent differentiation. Importantly, the dose of DAC used (100nM) is consistent with estimated steady-state serum levels in patients treated with DAC, which typically ranges between 100 and 500nM.28,29
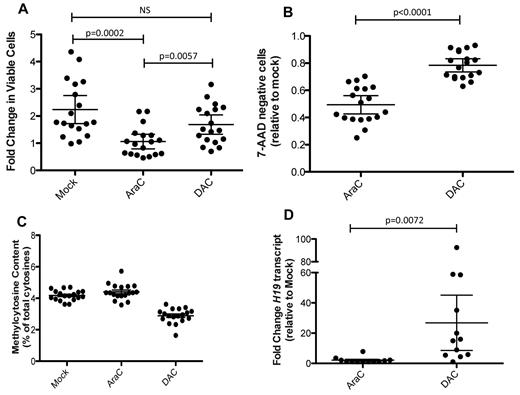
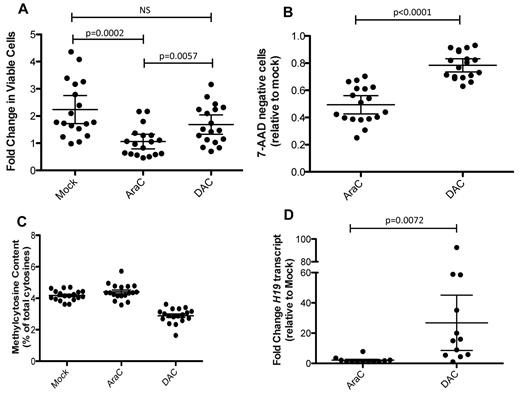
We expanded these studies to 18 additional de novo AML samples, all of which had undergone either whole genome or exome sequencing (supplemental Table 5). Cells were expanded on HS27 stroma for 4 days, followed by a 3-day treatment with 100nM DAC or 100nM AraC. The panel of primary samples showed variable growth during the period of stromal coculture; AraC treatment resulted in a significant decrease in the number of viable cells, whereas DAC had a less dramatic impact, similar to that seen for UPN476081 (Figure 3A-B). DAC treatment produced a minimal decrease in blasts (as defined by CD45dim/SSlow), in contrast to AraC. The expression of surface antigens associated with myeloid differentiation did not significantly change after exposure to DAC (supplemental Figure 5), nor were there morphologic changes associated with differentiation (data not shown). 5-methylcytosine content decreased in all samples after DAC treatment (Figure 3C, supplemental Figure 6), with a mean decrease of 28.68% (range: 10.16-59.46%). We used the nanostring array to measure transcriptional changes from 12 cases (supplemental Figure 7, supplemental Table 5) and found variable induction of mRNA transcripts after DAC or AraC treatment, with few consistent changes among the samples. H19 demonstrated the most dramatic induction, with a mean fold change of 26.8 after DAC treatment relative to mock, compared with only a 2.1-fold induction in cells treated with AraC (Figure 3D, supplemental Table 6).
Characteristics of primary de novo AML cells. Cells were grown on stroma in the absence of drug for 4 days, followed by a 3-day treatment with either 100nM AraC or 100nM DAC. (A) Fold change of cells during the 3 days of drug treatment. (B) Fraction of cells that excluded 7-AAD, relative to the mock treated samples. (C) LC-MS/MS determination of 5-methylcytosine; all values are shown relative to the percentage methylcytosine in the untreated samples. (D) Measurement of H19 mRNA using the nanostring platform; fold change is shown relative to the mock treated cells. Data points in panels A through C represent the mean of technical replicates (n = 3). mRNA measurements were performed in duplicate. Error bars represent 95% confidence intervals.
Characteristics of primary de novo AML cells. Cells were grown on stroma in the absence of drug for 4 days, followed by a 3-day treatment with either 100nM AraC or 100nM DAC. (A) Fold change of cells during the 3 days of drug treatment. (B) Fraction of cells that excluded 7-AAD, relative to the mock treated samples. (C) LC-MS/MS determination of 5-methylcytosine; all values are shown relative to the percentage methylcytosine in the untreated samples. (D) Measurement of H19 mRNA using the nanostring platform; fold change is shown relative to the mock treated cells. Data points in panels A through C represent the mean of technical replicates (n = 3). mRNA measurements were performed in duplicate. Error bars represent 95% confidence intervals.
Genome-wide methylation analysis
To better understand both global methylation patterns in primary AML cells and the changes induced by DAC treatment, we performed genome-wide methylation profiling on 8 primary AML samples using the Illumina Infinium HumanMethylation450 DNA methylation array platform. All arrays were performed in duplicate; there was no evidence of a batch effect (supplemental Figure 8), and excellent concordance was observed between replicates (supplemental Figures 9-11). Therefore, subsequent analyses were based on mean methylation values across the replicates.
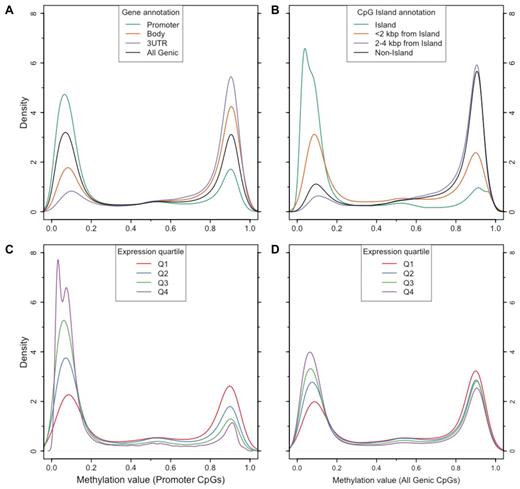
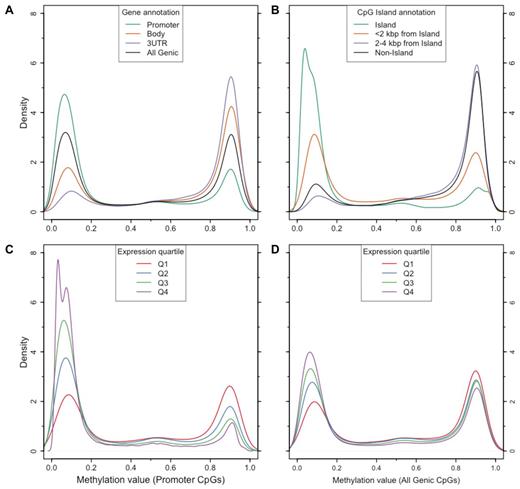
The genome-wide landscape of CpG methylation in mock-treated primary AML samples showed patterns consistent with previous observations of methylation in a variety of cell types,30-32 including a distinct bimodal pattern of methylation values: 84%-90% of CpGs across the 8 primary AML samples had a β value of less than 0.3 (unmethylated) or greater than 0.7 (methylated). Therefore, only a minority of CpGs had intermediate methylation values that could be because of hemimethylation at X-inactivated or imprinted loci, or variable methylation because of cellular heterogeneity within the sample. Methylation patterns also displayed the expected relationships with gene-based annotations and CpG island (CGI) definitions.31 We noted higher levels of methylation in gene bodies, 3′ UTRs, and at CpGs outside of CGIs, and less methylation in CGIs and promoters (Figure 4A-B). Similar patterns were observed for all 8 samples (supplemental Figure 12). Using expression arrays, gene-associated methylation patterns were correlated with expression levels, particularly at CpGs in promoter regions (Figure 4C-D). Promoters were unmethylated (β value < 0.3) in 78% (range 76%-82%) of genes in the top expression quartile across the 8 primary samples, which was significantly different from the proportion that was unmethylated among genes in the bottom expression quartile (41%; range 34%-45%; P < 10−4, Mann-Whitney test). In contrast, gene body and 3′ UTR methylation levels were not significantly different between top and bottom expression quartiles (P = .56 and P = .10, respectively; Mann-Whitney test; supplemental Figure 13).
Distribution of methylation values for a representative primary AML sample (721214) relative to gene and CpG island annotations, and expression. (A) Methylation value distributions for CpGs in promoters (green), gene bodies (orange), 3′ untranslated regions (purple); the distribution for all genic CpGs is shown in black. (B) Methylation value distributions for CpGs in islands (green), within 2 kbp of islands (orange), 2 to 4 kbp from islands (purple), and outside of islands (black). (C) Methylation value distributions for CpGs in promoters of genes stratified by array-based expression quartile. (D) Methylation value distributions for all genic CpGs stratified by array-based expression quartile.
Distribution of methylation values for a representative primary AML sample (721214) relative to gene and CpG island annotations, and expression. (A) Methylation value distributions for CpGs in promoters (green), gene bodies (orange), 3′ untranslated regions (purple); the distribution for all genic CpGs is shown in black. (B) Methylation value distributions for CpGs in islands (green), within 2 kbp of islands (orange), 2 to 4 kbp from islands (purple), and outside of islands (black). (C) Methylation value distributions for CpGs in promoters of genes stratified by array-based expression quartile. (D) Methylation value distributions for all genic CpGs stratified by array-based expression quartile.
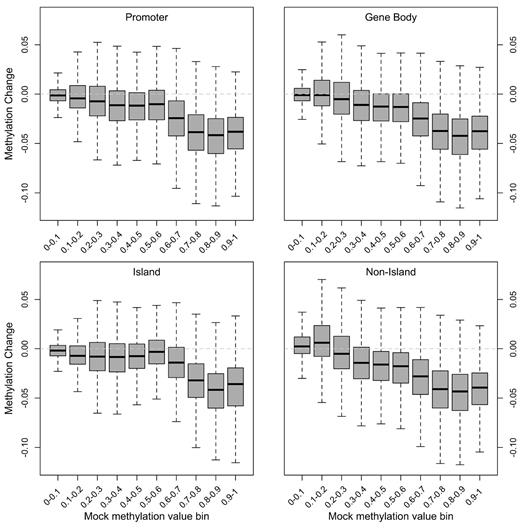
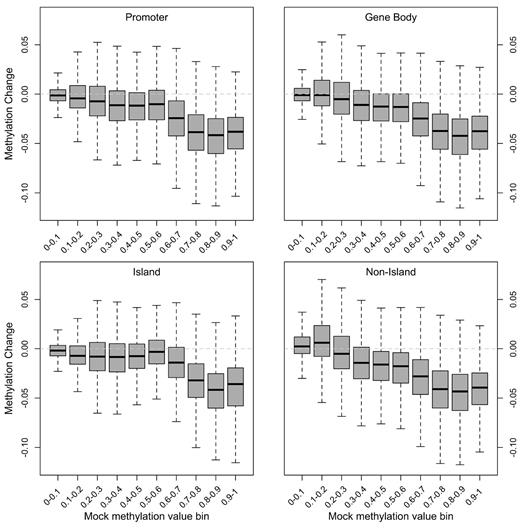
Short-term DAC treatment produced a modest decrease in global methylation using this platform, as evident from the shift in the distribution of methylation toward lower values in the DAC-treated samples compared with the other treatment conditions (Figure 5A; supplemental Table 7). The magnitude of this change was small, with a mean difference between DAC and mock conditions of −0.038 (β value units) across all samples. DAC-induced hypomethylation was most apparent at the high end of the methylation distribution (Figure 5B). Similarly, the mean change in methylation was significantly greater in gene bodies compared with promoter CpGs (−0.048 versus −0.021; P < 10−15, Student t test). However, changes in methylation were similar for CpGs with similar baseline methylation levels, regardless of CpG location, which is shown in Figure 6 for a representative sample. This suggests that the primary predictor of short-term DAC effect at an individual CpG is its baseline methylation level: heavily methylated CpGs are the most affected by DAC. Unsupervised hierarchical analysis of the top 1000 most variable CpGs showed that individual samples cluster together primarily because of sample-specific signatures, rather than DAC-induced hypomethylation (Figure 5C).
Effects of short-term DAC treatment on primary AML samples. (A) Distribution of methylation values for all interrogated CpGs from 8 primary AML samples treated with DAC (blue), cytarabine (red), or DMSO (black). (B) Change in methylation values on treatment with DAC, versus methylation in mock-treated samples, for a representative primary AML sample (721214). (C) Hierarchical clustering of methylation values of 8 primary AML samples treated with DAC, AraC, or vehicle using the 1000 most variable CpGs across all arrays.
Effects of short-term DAC treatment on primary AML samples. (A) Distribution of methylation values for all interrogated CpGs from 8 primary AML samples treated with DAC (blue), cytarabine (red), or DMSO (black). (B) Change in methylation values on treatment with DAC, versus methylation in mock-treated samples, for a representative primary AML sample (721214). (C) Hierarchical clustering of methylation values of 8 primary AML samples treated with DAC, AraC, or vehicle using the 1000 most variable CpGs across all arrays.
Global and focal patterns of DAC-induced hypomethylation. Distribution of methylation changes after short-term DAC treatment as a function of methylation level (binned by β value on x-axis) in the mock-treated sample at CpGs in promoters, gene bodies, and with respect to CpG island annotation. A representative primary AML sample (721214) is shown.
Global and focal patterns of DAC-induced hypomethylation. Distribution of methylation changes after short-term DAC treatment as a function of methylation level (binned by β value on x-axis) in the mock-treated sample at CpGs in promoters, gene bodies, and with respect to CpG island annotation. A representative primary AML sample (721214) is shown.
We also identified 480 individual CpGs with significant differences in DAC-induced methylation change across all samples. These differentially methylated CpGs (DMCs) were all hypomethylated in response to DAC and did not change on AraC treatment. As expected, DMCs were highly methylated at baseline: the mean methylation was 0.9, and 99% of the DMCs had a methylation value greater than 0.65 in the mock treated samples. Sixty percent of the DMCs were associated with 236 unique genes, and the majority of them (81%) were located in gene bodies (supplemental Table 8), which is consistent with higher methylation in gene body CpGs compared with other gene-based annotations. Similar to previous studies,15 we observed enrichment for DMCs at chromosome ends, which also tended to be highly methylated (supplemental Figure 14).
DAC had similar effects on most samples, but one (UPN 775109) showed significantly more hypomethylation than all the others (Figure 5B), despite similar levels of in vitro expansion. This sample contained an MLL translocation, but other samples with MLL rearrangements did not show this effect. The extent of hypomethylation for all the cases was less on the array platform than with LC-MS/MS, which also samples highly repetitive and methylated regions in the genome that are underrepresented on the Illumina array platform. This amount of DAC-induced hypomethylation detected by mass spectrometry is consistent with previous studies of low-dose DAC in AML cell lines or primary AML samples.14,33
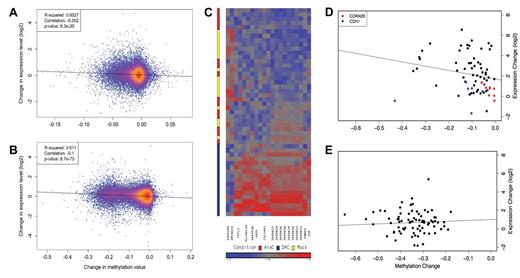
DAC treatment caused gene expression alterations that were modest; no consistent expression pattern was apparent across all AML samples. Similar to the methylation array data, the global expression patterns of the AML samples were largely informed by the characteristics of the AML samples themselves, rather than drug treatment (supplemental Figure 15). By comparing the global changes in methylation on DAC treatment with changes in expression levels, we did find a negative correlation between expression and methylation (representative examples Figure 7A-B, supplemental Figure 16), suggesting that DAC-induced promoter hypomethylation had a detectable effect on gene expression. However, this correlation was subtle, even for sample 775109 (Figure 7B), which showed the most hypomethylation in response to DAC. Microarray analysis did show consistent up-regulation of a few mRNAs after DAC treatment (Figure 7C), many of which have been previously identified as DAC-regulated in other studies, including COL14A112 and TKTL1, an X-linked imprinted gene.20 In addition, a 10-kb region on chromosome 6q (between 68 590 000 and 68 600 000, hg19), which is associated with an endogenous retrovirus (AB128832/LOC648232/HERV H/F),34 was also consistently up-regulated. A focused view of these genes revealed a correlation between methylation and expression (Figure 7D); however, this pattern was not observed for CDH1 or CDKN2B. In contrast, there was no significant increase in transcriptional activity in the genes with promoter based CpGs that exhibited the largest changes in methylation after DAC treatment (Figure 7E).
DAC-induced changes in expression and methylation. (A-B) Change in log2 expression versus change in mean methylation value at promoter-associated CpGs between DAC and mock-treated samples. The mean methylation value was calculated using all promoter CpGs annotated for each RefSeq transcript. A representative case (721214, panel A) is shown, as well as the case with profound DAC-induced hypomethylation (775109, panel B). (C) Heatmap representation showing probes with consistent expression changes (fold-change > 1.5 and FDR < 0.05) across all 18 AML samples. (D-E) Change in log2 expression versus change in mean methylation value at promoter-associated CpGs between decitabine and mock-treated samples at a selected group of transcripts. (D) Black points represent 7 genes (TKTL1, H19, COL14A1, PGF, DAZL, PNMA5, and AB128832) up-regulated by DAC treatment (each point represents a single transcript in a single AML sample). Also shown are CDKN2B and CDH1, 2 genes commonly reported to be regulated by methylation in AML cells. (E) Points represent individual transcripts (SCARB1, RSRC1, CYTH4, WDR87, SIPA1L3, MEGF6, CCDC62, ELF2, NCL, and SNORA75) with the promoter CpGs that have largest DAC-induced change in methylation.
DAC-induced changes in expression and methylation. (A-B) Change in log2 expression versus change in mean methylation value at promoter-associated CpGs between DAC and mock-treated samples. The mean methylation value was calculated using all promoter CpGs annotated for each RefSeq transcript. A representative case (721214, panel A) is shown, as well as the case with profound DAC-induced hypomethylation (775109, panel B). (C) Heatmap representation showing probes with consistent expression changes (fold-change > 1.5 and FDR < 0.05) across all 18 AML samples. (D-E) Change in log2 expression versus change in mean methylation value at promoter-associated CpGs between decitabine and mock-treated samples at a selected group of transcripts. (D) Black points represent 7 genes (TKTL1, H19, COL14A1, PGF, DAZL, PNMA5, and AB128832) up-regulated by DAC treatment (each point represents a single transcript in a single AML sample). Also shown are CDKN2B and CDH1, 2 genes commonly reported to be regulated by methylation in AML cells. (E) Points represent individual transcripts (SCARB1, RSRC1, CYTH4, WDR87, SIPA1L3, MEGF6, CCDC62, ELF2, NCL, and SNORA75) with the promoter CpGs that have largest DAC-induced change in methylation.
Discussion
The goal of this study was to define the early effects of DAC treatment on primary AML cells. A 3-day exposure to DAC was specifically chosen to avoid the induction of myeloid differentiation,9,10 which would independently cause methylation and expression changes that would obscure detection of the direct and immediate effects of DAC treatment.21 This design contrasts other recent studies that analyzed primary AML samples, in which significant myeloid differentiation was observed when cells were analyzed at later times after DAC exposure.9,14 Although AML cells were treated with DAC for only 3 days, methylation changes were readily detected, and there were several mRNAs consistently up-regulated, including a repetitive element on chromosome 6q containing an endogenous retrovirus (Figure 7C) and the H19-IGF2 locus (Figure 2E). Both the H19-IGF2 locus and several endogenous retroviruses are highly regulated by methylation,35-37 proving that our experimental conditions were indeed capable of detecting expression changes that were caused directly by DAC treatment. To our knowledge, this is the most complete analysis of transient DAC treatment on primary AML cells performed to date.
In this study, we used an optimized stromal coculture assay to expand primary human AML cells with retention of blast morphology, flow cytometry characteristics, genetic alterations, and most importantly, preservation of leukemogenic potential. Recently, work by Schuringa and colleagues used the murine bone marrow stromal line MS5 to similarly expand and manipulate primary human AML cells.38 We also used the MS5 stromal line with results similar to those shown in this study with HS27 cells (data not shown). Using this assay, we were able to comprehensively define the early impact of DAC treatment on primary AML cells. This coculture assay can also be used to study the impact of other therapeutic agents for AML, providing a robust system for genotype-phenotype correlations.
In addition to measuring DAC-induced global methylation changes by LC-MS/MS, we also interrogated individual CpG sites throughout the genome using the Illumina Infinium HumanMethylation450 platform. This new platform, while still assessing more than 200 000 promoter-based CpG sites, also devotes nearly one-third of the array space to CpGs located within gene bodies or intragenic regions (supplemental Table 9),39,40 thus diminishing the promoter bias of earlier generation methylation array platforms while also minimizing the influence of local CpG density, which can impact the results from different methylated cytosine enrichment methods.41 Using this platform, our findings on primary AML cells are in agreement with previous reports of high methylation in gene bodies and 3′UTRs, whereas only a subset of promoters have methylated CpG sites.32,37 In addition, we also found that regions with high levels of baseline methylation (such as gene bodies) are preferentially hypomethylated by DAC treatment (which was also suggested by Yan et al42 ), and that the extent of hypomethylation is not driven by specific positions in the genome,33 but rather the degree of baseline methylation. For example, in Figure 4, we show that highly methylated CpGs in the promoter, a region in which a high fraction of CpGs have minimal methylation, show the same extent of DAC-induced hypomethylation as CpGs in the gene body. Yan et al also observed hypomethylation of CpGs throughout the genome after DAC treatment42 ; however, they reported a higher degree of hypomethylation in CpG islands. We suspect these discrepancies are because of inherent differences in methylation measurement platforms.
Although we found the expected negative correlation between promoter methylation and expression in untreated cells (Figure 4), only subtle changes in gene expression could be correlated with DAC-induced promoter hypomethylation. Transcriptional changes were small even in genes containing CpGs that had the largest changes in methylation with DAC, and in the outlier sample with an extreme response to DAC (Figure 7). Further, genes reported to be regulated by methylation in AML cells, such as CDKN2B and CDH1, showed little change in expression in cells treated with DAC. Our data are therefore different from that reported by Paul et al who showed that CDKN2B was dramatically up-regulated with a 3-day treatment of 2000nM DAC in AML cell lines and primary AML samples.43 This dose of DAC produced significant cytotoxicity; in contrast, the low dose of DAC used here (100nM) induces hypomethylation rather than cell-cycle arrest and death (Figure 2). It should also be noted that AraC treatment, which does not affect methylation levels, induces expression of CDKN2B in some samples (supplemental Figure 7), suggesting that methylation-independent mechanisms must also exist for reactivating CDKN2B. Although the association of methylation and expression is well known, the lack of correlation between the 2, especially after drug-induced hypomethylation, has been found by several other groups.12,14,20,29,32,44,45 The reasons for this are unclear. Just as it has been shown that gene silencing may precede methylation, removal of 5-methylcytosine residues may often be necessary but not sufficient for gene reactivation (because other modifications, such as nucleosomal remodeling and histone methylation42,43,45,46 may also be critical).44,46 Indeed, it was shown more than 30 years ago that 5-azacytidine reactivates the HBG gene (γ globin) in erythroid cells, but not HBE (ϵ globin), although the 2 genes are only 15 kb apart, and display similar levels of hypomethylation after 5-AZA treatment.47
It was not possible to correlate in vitro phenotypes with clinical outcomes from this study, because none of the patients studied were treated with DAC (supplemental Table 1). However, our preliminary studies have shown that blasts from a patient with a durable response to DAC monotherapy (EFS and OS > 6 years) did show an exaggerated hypomethylation response in vitro to DAC compared with 3 known DAC monotherapy nonresponders (supplemental Figure 17). The data from these patients raise the possibility that an in vitro phenotype may predict in vivo response to DAC, and a larger study is clearly warranted. Although in vivo measurements of methylation changes after DAC treatment have not yet reliably predicted clinical responses,17,45,48-50 it is possible that an in vitro assay, which measures cell autonomous responses, may be more predictive.
DAC has shown activity against AML and solid tumors,5,6 yet its mechanism of action is still not entirely clear. In this study, we showed that DAC initially induces global hypomethylation, with a preference for methylated CpGs. Although we identified some transcriptional changesafter a 3-day course of DAC, we failed to identify any patterns of gene expression that demonstrated a strong correlation with changes in methylation nor did we observe a consistent up-regulation of many of the genes that are commonly monitored after DAC treatment. These studies illustrate that monitoring the immediate effects of DAC treatment is best accomplished using unbiased approaches, because measurements involving single genes (or small groups of genes) will not reflect the true spectrum of the response.
There is an Inside Blood commentary on this article in this issue.
The online version of this article contains a data supplement.
The publication costs of this article were defrayed in part by page charge payment. Therefore, and solely to indicate this fact, this article is hereby marked “advertisement” in accordance with 18 USC section 1734.
Acknowledgments
The authors thank the Cancer Genome Atlas AML study for providing access to de novo AML sequence data, Jeanne Rumsey for establishing the LC-MS/MS assay, and Michael Evenson and Dr Shashi Kulkarni in Cytogenomics and Molecular Pathology at Washington University School of Medicine for performing and analyzing fluorescence in situ hybridization.
This work was supported by the National Institutes of Health grant P01CA101937, RO1CA162086 and the Barnes Jewish Hospital Foundation (00 335-0505-02 to T.J.L.), National Human Genome Research Institute grant U54 HG003079 (R.K.W.) and the Doris Duke Charitable Foundation to Washington University (S.M.S, Clinical Research Fellow). Technical assistance was provided by the Alvin J. Siteman Cancer Center Tissue Procurement Core, the High Speed Cell Sorting Core, and the Molecular and Genomic Analysis Core at Washington University School of Medicine and Barnes-Jewish Hospital in St Louis, MO, which are all supported by the National Cancer Institute Cancer Center Support Grant P30CA91842.
National Institutes of Health
Authorship
Contribution: J.M.K., D.H.S., and T.J.L. designed the research, analyzed data, and wrote the paper; T.L.L. and S.M.S. performed experiments; T.W., V.M., J.H., J.W., and N.V. analyzed data; P.E.G., C.F.L., M.R.M., and R.R.T. performed experiments and analyzed data; and R.K.W. and E.R.M. designed the research.
Conflict-of-interest disclosure: The authors declare no competing financial interests.
Correspondence: Timothy J. Ley, Box 8007, 660 S Euclid Ave, Washington University School of Medicine, St Louis, MO 63110; e-mail: tley@dom.wustl.edu.
References
Author notes
J.M.K. and D.H.S. contributed equally to this work.

