Abstract

aHUS is a genetic, life-threatening disease of chronic, uncontrolled complement activation leading to systemic complement-mediated thrombotic microangiopathy (TMA). Ecu (anti-C5 mAb) blocks terminal complement and inhibits TMA, normalizes platelets, and improves renal function in aHUS pts. We describe levels of key biomarkers of complement alternative pathway (CAP) and endothelial activation, as well as inflammation, coagulation, and renal injury that together characterize the disease process in pts with aHUS, prior to and during Ecu treatment.
Biomarkers were evaluated using standard methods in healthy subjects (healthy) and adult aHUS pts (N=29-39) at baseline and during 26 weeks (wks) of Ecu treatment in a Phase 2 aHUS clinical trial.
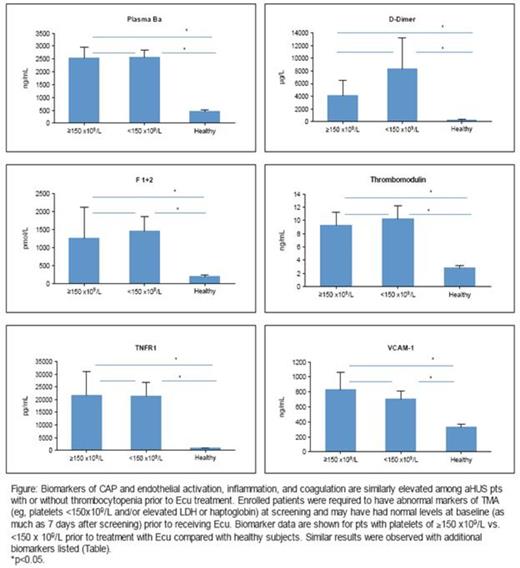
All biomarkers were elevated at baseline in the majority of pts (Table), including pts with normal platelet counts (Figure), LDH, and/or haptoglobin levels. Following Ecu treatment in all pts, coagulation markers (F1+2 and D-dimer) were significantly reduced by 2.5 wks and decreased by >50% by wk 26. Renal injury markers (U-cystatin C and U-TIMP-1) also reduced significantly by 2.5wks. Interestingly, mean plasma levels of complement Ba, a key marker of CAP activation, were significantly decreased by 4-6 wks following Ecu but remained elevated. Soluble tumor necrosis factor receptor 1 (sTNFR1) and U-clusterin levels decreased by 4-6 wks, while thrombomodulin, VCAM-1, CXCL10, U-FABP-1, U-β2m and IL-6 levels reduced more slowly (12-26 wks). By 26 wks of Ecu, levels of all renal injury markers had normalized (≈78%-90% reduction) but markers of CAP and endothelial activation, inflammation, and coagulation remained elevated relative to levels in healthy subjects.
| Disease Process . | Biomarker . | % of Pts with Elevated Baseline Levels (p value) vs Healthy Levels . | Reduction Following Ecu: Week During Treatment (p value) vs Baseline* . | Mean % Change from Baseline at Wk 26 Following Ecu (p value)* . | Mean Levels Normalized at Wk 26 vs Healthy . |
|---|---|---|---|---|---|
| CAP Activation | Ba | 100 (<0.0001) | 4-6 (0.0053) | -39.2 (<0.0001) | No |
| Endothelial Activation | Thrombo-modulin | 97.1 (<0.0001) | 12-17 (0.0007) | -31.0 (<0.0001) | No |
| VCAM-1 | 94.7 (<0.0001) | 12-17 (<0.0001) | -29.1 (<0.0001) | No | |
| Inflammation | TNFR1 | 100 (<0.0001) | 4-6 (0.0012) | -54.2 (<0.0001) | No |
| CXCL10 | 60.5 (<0.0001) | 12-17 (0.0010) | -40.1 (<0.0001) | No | |
| IL-6 | 61.8 (0.0019) | 26 (0.0407) | -47.1 (0.0441) | No | |
| Coagulation | F1+2 | 94.7 (<0.0001) | 1-2.5 (0.0069) | -53.4 (<0.0001) | No |
| D-dimer | 94.4 (0.0002) | 1-2.5 (0.0078) | -65.3 (<0.0001) | No | |
| Renal Injury | U-Clusterin | 82.8 (<0.0001) | 4-6 (0.0002) | -84.9 (<0.0001) | Yes |
| U-TIMP-1 | 75.9 (0.0003) | 1-2.5 (0.0434) | -88.6 (<0.0001) | Yes | |
| U-FABP-1 | 75.9 (0.0130) | 12-17 (0.0270) | -82.5 (<0.0001) | Yes | |
| U-β2m | 71.4 (<0.0001) | 12-17 (0.0002) | -78.5 (0.0012) | Yes | |
| U-Cystatin C | 69.2 (=0.0001) | 1-2.5 (0.0018) | -90.0 (<0.0001) | Yes |
Among pts with elevated baseline levels.
At baseline, alternative pathway complement activation and elevated biomarkers of inflammation, coagulation, endothelial activation, and renal injury were evident in the majority of pts with aHUS, including those exhibiting normal markers of TMA. Ecu reduced but did not normalize plasma Ba, suggesting ongoing complement activation (CAP) upstream of C5 and the need for sustained complement inhibition downstream. Ecu treatment rapidly and markedly reduced biomarkers of thrombin generation, fibrinolysis, and inflammation, and normalized markers of renal injury; this reduction was sustained with ongoing Ecu treatment. Endothelial activation biomarkers reduced more slowly, suggesting ongoing effects of CAP C3 activation upstream of C5. These data point to the chronicity of the disease process and support the continuous administration of Ecu in aHUS pts, including those with normal hematological markers of TMA.
Cofiell:Alexion Pharmaceuticals: Employment. Kukreja:Alexion Pharmaceuticals: Employment. Bedard:Alexion Pharmaceuticals: Employment. Yan:Alexion Pharmaceuticals: Employment. Mickle:Alexion Pharmaceuticals: Employment. Ogawa:Alexion Pharmaceuticals: Employment. Bedrosian:Alexion Pharmaceuticals: Employment. Faas:Alexion Pharmaceuticals: Employment.
Author notes
Asterisk with author names denotes non-ASH members.

This icon denotes a clinically relevant abstract


