Abstract
Umbilical cord blood (UCB) is an important alternative source of stem cells for patients who lack matched adult donors, particularly in ethnic minorities. The infused total nucleated cell (TNC) and CD34+ cell dose are important prognostic factors on transplant outcomes. UCB units collected from African Americans (AA) have lower TNC and CD34+ cell counts and more likely to be disqualified for banking compared to other racial and ethnic groups. Furthermore, AA, including pregnant women, have increased prevalence of vitamin D deficiency. Vitamin D has an established role in hematopoiesis; therefore, we investigated the racial differences in UCB vitamin D content and its correlation with UCB cell composition and hematopoietic potential.
119 UCB units that did not meet the TNC count banking criteria were analyzed. 51 UCB units were collected from AA mothers and 68 from Caucasian mothers. We analyzed UCB variables including volume, hematocrit (HCT), TNCs, mononucleated cells (MNC), CD34+ cells, plasma 25-Hydroxy vitamin D [25(OH)D] and in vitro progenitor cell hematopoietic potential measured by Colony-Forming Cell (CFC) assay.
The median values of 25(OH)D in UCB units were significantly lower in AA compare to Caucasians (p= <.0001). Severe vitamin D deficiency < 10 ng/mL was exclusively detected in UCB units from AA (19/51; 37%) and plasma 25(OH)D concentration < 20 ng/mL was more prevalent in AA (43/51 units; 84%), compare to Caucasians (15/68 units; 22%). UCB units from AA had lower absolute numbers of TNC (p= .0016), MNC (p= .0261), and CD34+ cells (p= .0257) compare to Caucasians. No difference in median CFC/10,000 MNC was detected between AA and Caucasians (p= 0.661) (Table 1).
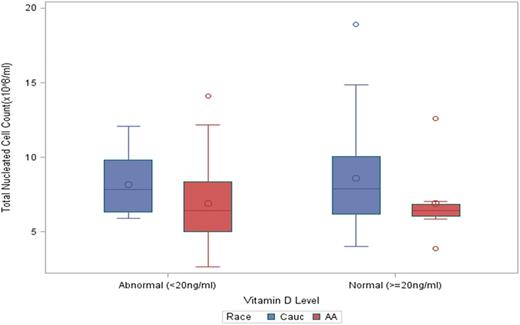
Univariate analysis of 25(OH)D effect on UCB variables revealed a correlation between 25(OH)D level and TNC (r= 0.193, 95% CI 0.013-0.36; p= .0353) and UCB HCT (r= 0.196, 95% CI 0.016-0.363; p= .0327). A significantly higher MNC count was noted when 25(OH)D concentration was ≥ 20ng/mL (4.5x 10⁸, range (1.7-9.5) vs. 3.9x 10⁸, range (0.8-9); p= .0329). This correlation between 25(OH)D level and TNC and MNC was not detected after adjustment for race (Figure 1). However, 25(OH)D concentration ≥ 20 ng/mL significantly correlated with CBU HCT in AA race (median 31.9% (24-42) vs. 27.8%, range (21.4 - 40); p= .0124).
25(OH)D level, TNC and HCT are all significantly lower in UCB units from AA compare to Caucasians. Independent of race, 25(OH)D directly correlated with TNC and MNC. These data suggest vitamin D and other yet to be determined factors play an important role in the mechanism of low UCB cell and progenitor counts.
Descriptive analysis of UCB variables and 25(OH)D levels in AA and Caucasians
| Variable . | Overall (n= 119) . | AA (n= 51) . | Caucasian(n= 68) . | p-value . |
|---|---|---|---|---|
| Median (range) . | Median (range) . | Median (range) . | ||
| 25(OH)D concentration (ng/mL) | 21.2 (3.8 - 50.4) | 11.8 (3.8 - 46.5) | 23.9 (15.4 - 50.4) | <.0001 |
| Absolute CD34 x 106 | 1.9 (0.2 - 14.7) | 1.7 (0.2 - 7.2) | 2.2 (0.4 - 14.7) | 0.0257 |
| Absolute TNC x 108 | 7.4 (2.7 - 18.9) | 6.4 (2.7 - 14.1) | 7.9 (4 - 18.9) | 0.0016 |
| Absolute MNC x 108 | 4.1 (0.8 - 9.5) | 3.9 (0.8 - 9.0) | 4.5 (1.7 - 9.5) | 0.0261 |
| Total CFC/10,000 MNCs | 35 (5 - 131) | 34.5 (7 - 131) | 35 (5 - 123) | 0.6613 |
25(OH)D Correlation with TNC adjusted for race
No relevant conflicts of interest to declare.
Author notes
Asterisk with author names denotes non-ASH members.


