Key Points
In SMZL, the quality of BM stromal microenvironment predicts disease progression.
CD40-CD40L-mediated interactions between mast cells and BM mesenchymal cells engender proinflammatory conditions within SMZL infiltrates.
Abstract
Splenic marginal zone lymphoma (SMZL) is a mature B-cell neoplasm characterized by rather indolent clinical course. However, nearly one third of patients experience a rapidly progressive disease with a dismal outcome. Despite the characterization of clone genetics and the recognition of deregulated immunologic stimulation in the pathogenesis of SMZL, little is known about microenvironment dynamics and their potential biological influence on disease outcome. Here we investigate the effect of stroma-intrinsic features on SMZL disease progression by focusing on the microenvironment of the bone marrow (BM), which represents an elective disease localization endorsing diagnostic and prognostic relevance. We show that the quality of the BM stromal meshwork of SMZL infiltrates correlates with time to progression. In particular, we describe the unfavorable prognostic influence of dense CD40 expression by BM stromal cells, which involves the contribution of CD40 ligand (CD40L)-expressing bystander mast cells infiltrating SMZL BM aggregates. The CD40/CD40L-assisted crosstalk between mesenchymal stromal cells and mast cells populating the SMZL microenvironment finds correlation in p53−/− mice developing SMZL and contributes to the engendering of detrimental proinflammatory conditions. Our study highlights a dynamic interaction, playing between nonneoplastic elements within the SMZL niche, toward disease progression.
Introduction
Splenic marginal zone lymphoma (SMZL) is a mature B-cell neoplasm recognized as a distinct pathological entity by the 2008 World Health Organization Classification of Tumours of Haematopoietic and Lymphoid Tissues.1 SMZL infiltrates the spleen white and red pulp, the peripheral blood (PB), and the bone marrow (BM) on diagnosis.2-4 The constant BM involvement makes trephine biopsy (BMB) and marrow aspirate necessary for a precise diagnosis, also corroborated by immunophenotypical, biomolecular, and cytogenetic analyses.5-10 The integration of clinical and laboratory data with information coming from PB and BM analyses allows avoiding splenectomy for diagnostic purposes.5 Hence, in most cases, BM histology represents the only open window on SMZL clones in situ.
SMZL commonly pursues an indolent course with a median survival exceeding 10 years and with most patients not requiring treatment for many years.11 However, nearly one third of patients display rapidly progressive disease with dismal outcome and deserve prompt treatment.11 The Intergruppo Italiano Linfomi (IIL) has identified a prognostic score stratifying patients with SMZL into 3 risk categories on the basis of anemia, lactate dehydrogenase (LDH), and albuminemia.12 Such a score, which is suggestive of the lymphomatous burden, may be of limited value for patients presenting with early disease. Together, these features underscore the lack of biological prognostic markers in SMZL. In addition, the potential influence of the tumor microenvironment on SMZL disease course remains unexplored. In the absence of clone-related prognostic markers, the investigation of the SMZL microenvironment may represent a promising strategy for the early identification of patients with a rapidly progressive disease. Indeed, the tumor microenvironment takes part in the progression of almost every form of cancer.13 In the process of reshaping the stromal microenvironment of infiltrated organs/tissues, B-cell clones can be supported by immune cells such as macrophages and mast cells (MCs), which may be recruited directly by neoplastic cells through the synthesis of cytokines and chemokines.14,15 Macrophages and MCs variably populate the infiltrates of B-cell malignancies molding different aspects of tumor microenvironment, such as angiogenesis and stromal cell (SC) proliferation, extracellular matrix remodeling, and induction of adhesion molecule expression.14-19 The presence and amount of infiltrating accessory cells has emerged as an independent prognostic feature in follicular lymphoma, diffuse large B-cell lymphoma, lymphoplasmacytic lymphoma, and classic Hodgkin’s lymphoma.16-18,20 With few exceptions, the mechanisms through which these cells may produce a favorable effect on B-cell clones are mostly unclear, although both direct effects on neoplastic cells and indirect effects on the nonneoplastic environment are likely to take place.21-25
The BM microenvironment represents an important niche for SMZL clone localization and survival and a privileged site for residual and/or progressive disease after treatment.26 On these premises, we analyzed the stromal composition of the BM SMZL infiltrates to identify microenvironment-centered clues with potential biological prognostic implication.
Methods
Clinical and laboratory data
Sixty-six consecutive cases of SMZL diagnosed between 2001 and 2011 were collected from the archives of the Human Pathology Section of the Department of Health Sciences, University of Palermo, Italy; from the archives of the Department of Pathology, University of Pavia, Italy; and from the archives of the Hematopathology Unit of the University of Bologna, Italy. SMZL diagnosis was performed according to the 2008 World Health Organization classification criteria1 and revised at the time of inclusion in the study by 3 expert hematopathologists (S.A.P., C.T., and A.M.F.). For each patient, the BMB was performed on diagnosis, before the start of any treatment. The SMZL diagnosis on BMB evaluation was based on the identification of light chain-restricted lymphoid infiltrates with typical SMZL histomorphological features and expressing the following immunophenotype: CD20+CD79a+immunoglobulin M (IgM)+(surface)IgD+(−)IgG−DBA44−CD5−Annexin-A1−CD23−CD25−CD10−BCL-6−TCL1−. Clinical and laboratory data collected for analysis were age, sex, hemoglobin, white blood cell count, lymphocyte count, platelet count, β2-microglobulin, LDH, and albumin. In all the cases, the IIL risk category was determined at the time of diagnosis.12 Histological features included in the study analyses were percentage of lymphoma infiltration in the BM, normal hematopoietic residual cellularity, and pattern of infiltration (interstitial, intrasinusoidal, nodular). For each patient, overall survival (OS) was calculated as the time between the date of diagnosis and the date of death or last follow-up for censored cases. Progression-free survival (PFS) was calculated as the time between the date of diagnosis and that of disease progression. Disease progression was defined as a >25% increase in the size of previously documented disease or the appearance of disease at any site; moreover, shift to a more aggressive histologic pattern was also considered progression. All the procedures involving human and mouse tissue specimens and the analyses conducted on data from human patients have been performed in accordance with the institutional review board of Policlinico “P.Giaccone,” School of Medicine, University of Palermo. This study was conducted in accordance with the Declaration of Helsinki.
In situ immunophenotypical analyses
Primary cells and cell lines
Human BM mesenchymal SCs were collected from normal BM aspirates of patients with nonneoplastic conditions, as previously described.27 Murine BMSCs were collected as previously described27 and detailed in supplemental Methods.
Human MC lines and BM-derived human and murine MCs were obtained as detailed in supplemental Methods.
Flow cytometry
Flow cytometry analyses on human and murine cells were performed as detailed in supplemental Methods.
Enzyme-linked immunosorbent assay
The amounts of interleukin 6 (IL-6) and tumor necrosis factor (TNF) released in coculture supernatants were detected by specific enzyme-linked immunosorbent assay (eBioscience), following manufacturer’s instructions.
B-cell proliferation assay
A proliferation assay on cocultures with purified CD19+CD21+IgM+ human B cells was performed as detailed in the supplemental Data.
p53−/− mouse model
BALB/cJ-Trp53tm1Ty mice were purchased from The Jackson Laboratory and BALB/cAnNCrl mice, 8 to 10 weeks old, were purchased from Charles River Laboratories (Calco, Italy). Mice were maintained at the Fondazione Istituto di Ricovero e Cura a Carattere Scientifico Istituto dei Tumori. Animal experiments were authorized by the institute's Institutional Ethical Committee for Animal Use. p53−/− mice were euthanized at 6 to 9 weeks of age when clinically healthy and were analyzed for the development of early SMZLs.
Statistical analysis
All data were analyzed using SPSS software package version 8.0. Differences in the distribution of continuous variables between categories were analyzed by Mann–Whitney U test. Nominal and categorical data were compared using Fisher's exact test or χ2 test. PFS curves were prepared by the Kaplan–Meier method and compared by the log-rank test. Cox proportional hazard regression model was used for multivariable analysis. P values ≤.05 were considered significant.
Results
Clinical and prognostic features
The clinical features of the SMZL patients are summarized in Table 1. Patients were stratified according to IIL score12: 27 patients (40.9%) were in the low-risk group and 19 (28.8%) and 20 (30.3%) patients were in the intermediate- and high-risk groups, respectively. Twenty-six (39.4%) patients did not receive any therapy at diagnosis and were followed-up according to a watchful waiting strategy, whereas 40 (60.6%) patients were treated with splenectomy alone (n = 11; 27.5%) and cyclophosphamide, hydroxydaunorubicin, oncovin, and prednisone-like regimens with (n = 9, 22.5%) or without (n = 8, 20%) rituximab; alkylating agents (n = 2, 5%); or purine analogues (n = 10, 25%). Of the 66 patients, 38 (57.6%) experienced disease progression. The mean PFS of the whole series was 28 months, and the mean OS was 99 months (supplemental Figure 1). The IIL prognostic score risk category significantly correlated with both the PFS and OS (P = .04 and P = 0.02, respectively) (supplemental Figure 1). Low-risk patients had a mean PFS of 38.3 months and a mean OS of 129.2 months, whereas those belonging to the intermediate- and high-risk categories had a mean PFS of 22.3 and 17.8 months and a mean OS of 55.7 and 8.2 months, respectively.
SMZL BM infiltrates have variable stromal composition
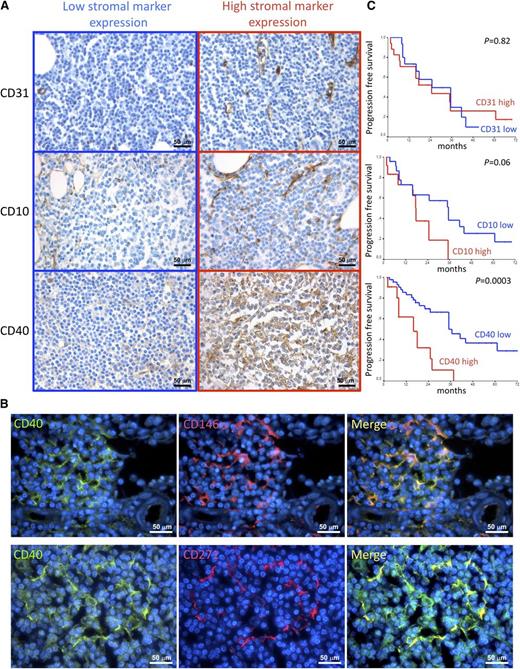
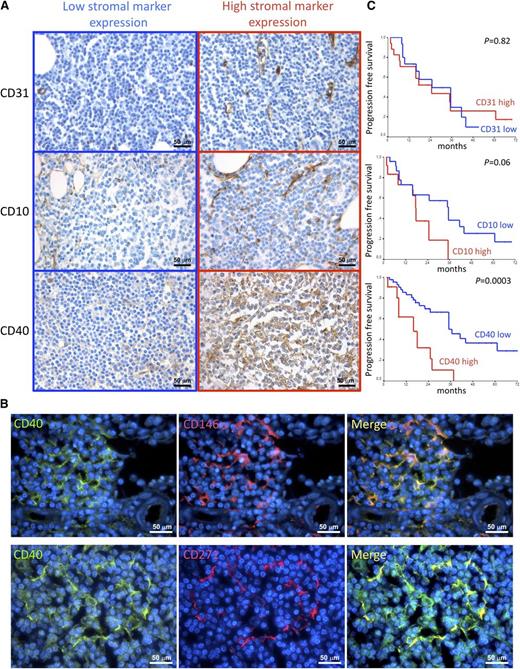
The mean hematopoietic BM cellularity was 59%, with a mean lymphoid infiltration of 35%. Neoplastic lymphoid infiltrates showed a mixed nodular and intrasinusoidal pattern of infiltration in the majority of cases (n = 45, 68.2%); 6 cases (9.1%) showed an isolated nodular pattern of infiltration, 6 cases (9.1%) had a pure intrasinusoidal pattern, and 9 cases (13.6%) had an interstitial one (Table 1). The stromal meshwork of BM lymphoid aggregates was analyzed to identify features of prognostic significance. The density of the CD10+ adventitial reticular cell (ARC) meshwork was semiquantitatively evaluated within SMZL infiltrates out of 5 high-power fields, according to our previous experience in CLL, as detailed in supplemental Methods.22 Similarly, the number of CD31+ vessels was counted within lymphoid infiltrates out of 5 high-power fields, as previously reported.22 Both the CD10+ ARC network and the microvascular density of the SMZL infiltrates varied among different cases. Indeed, although in some cases a diffuse and dense meshwork of CD10+ stellate SCs intermingled with lymphoma cells, together with a dense network of branching vessels, in other cases, the stromal architecture was almost completely displaced by the neoplastic clone (Figure 1A; Table 1). We analyzed the expression of the prototypical activation marker CD40 within the same BM lymphoid aggregates. CD40 represents a pivotal axis in the activation of immune cells and is also involved in the activation of stromal structural cells such as fibroblasts and endothelial cells.28,29 Within SMZL BM infiltrates, CD40 was mainly expressed by BM stromal elements with spindle or reticular morphology, whose density varied consistently among the 66 cases, ranging from scattered positive cells to a diffuse and dense meshwork (Figure 1A; supplemental Figure 2A; Table 1). Consistent with morphology, double marker immunofluorescence analysis confirmed CD40 expression in BM mesenchymal SCs by highlighting its colocalization with the BM mesenchymal cell markers CD146 and CD271 (Figure 1B; supplemental Figure 2B) and with the ARC marker CD10 (supplemental Figure 2B). In a minority of cases (35%), CD40 was also intensely expressed in the neoplastic lymphoid elements, whereas in all the other cases, CD40 expression was either slight or barely detectable in the neoplastic clone (supplemental Figure 2C). CD40 expression in neoplastic cells was independent of the presence and intensity of CD40 expressed by SCs (supplemental Figure 2C-D).
Correlations between CD10, CD31, and CD40 stromal expression and clinical features. (A) Immunohistochemical analysis of CD31, CD10, and CD40 expression (brown signal) on BMB of SMZL patients. The density of CD10+ SCs, the microvascular density, and the expression of CD40 in SMZL BM infiltrates varied consistently among different cases. Representative micrographs of SMZL BM infiltrates characterized by either low (left) or high (right) expression of the 3 markers are shown. Micrographs are relative to 6 of 66 evaluated cases. Immunohistochemistry, STREPTavidin-biotin-peroxidase complex method; original magnification ×400. (B) Double-marker immunofluorescence analysis highlighting the expression of the activation marker CD40 (green signal) by spindle-shaped or stellate BM mesenchymal elements expressing CD146 or CD271 (red signal). The micrographs are relative to a case with high (score 3) CD40 stromal expression. Immunofluorescence with Alexa-488, Alexa-568, and 4,6 diamidino-2-phenylindole fluorochromes; original magnification ×630. (C) Kaplan–Meier curves showing the time to disease progression in SMZL cases subdivided according to CD31, CD10, and CD40 stromal expression.
Correlations between CD10, CD31, and CD40 stromal expression and clinical features. (A) Immunohistochemical analysis of CD31, CD10, and CD40 expression (brown signal) on BMB of SMZL patients. The density of CD10+ SCs, the microvascular density, and the expression of CD40 in SMZL BM infiltrates varied consistently among different cases. Representative micrographs of SMZL BM infiltrates characterized by either low (left) or high (right) expression of the 3 markers are shown. Micrographs are relative to 6 of 66 evaluated cases. Immunohistochemistry, STREPTavidin-biotin-peroxidase complex method; original magnification ×400. (B) Double-marker immunofluorescence analysis highlighting the expression of the activation marker CD40 (green signal) by spindle-shaped or stellate BM mesenchymal elements expressing CD146 or CD271 (red signal). The micrographs are relative to a case with high (score 3) CD40 stromal expression. Immunofluorescence with Alexa-488, Alexa-568, and 4,6 diamidino-2-phenylindole fluorochromes; original magnification ×630. (C) Kaplan–Meier curves showing the time to disease progression in SMZL cases subdivided according to CD31, CD10, and CD40 stromal expression.
BM stroma CD40 expression is an independent predictor of PFS in SMZL cases
The variability in the stromal composition of SMZL BM infiltrates prompted the analysis of correlations among the tested pathological features in search of significant associations between the diverse components of the stromal milieu of lymphomatous infiltrates and the extent and pattern of the BM infiltration. A significant association emerged between the degree of CD40 stromal expression and the extent of the CD10+ reticular cell meshwork (P = .03); moreover, high CD40 stromal expression was significantly associated with the presence of a nodular infiltration pattern (P = .001) (supplemental Figures 3 and 4).
Along that same line, we investigated whether features inherent with the stromal composition of SMZL BM infiltrates could correlate with the clinical outcome expressed as PFS. Univariate analysis revealed that in addition to IIL score and treatment (P = .02) (supplemental Figure 1C,E), the expression of CD40 (P = .0003) in the BM stroma, but not the amount of CD10+ or CD31+ BMSCs, significantly correlated with PFS (Figure 1C; Table 2). Patients who received treatment had a mean PFS of 20.8 months; on the contrary, patients followed-up with a watchful waiting regimen had a mean PFS of 34 months. Notably, the adoption of treatment was not associated with unfavorable presenting clinical or laboratory data (eg, elevated serum LDH, B2 microglobulin, white blood cell count, and platelet count), with the exception of a median hemoglobin value lower than 12 g/dL (P = .001). Patients with low stromal CD40 expression (grade 0/1) had a mean PFS of 41.2 months, whereas those with high CD40 expression (grade 2/3) had a mean PFS of 16.9 months. Moreover, elevated CD40 stromal expression significantly correlated with unfavorable clinical features such as low hemoglobin levels (P = .01), elevated β2 microglobulin (P = .028), and higher IIL risk category (P = .05).
Subsequent multivariate analysis including variables significantly correlated with PFS on univariate analysis, namely, IIL score, treatment at diagnosis, and stromal CD40 expression, showed that CD40 expression in BMSCs (P = .003) and treatment (P = .01) were independent predictors of PFS (Table 3).
CD40 stromal expression in BM SMZL infiltrates correlates with MC infiltration
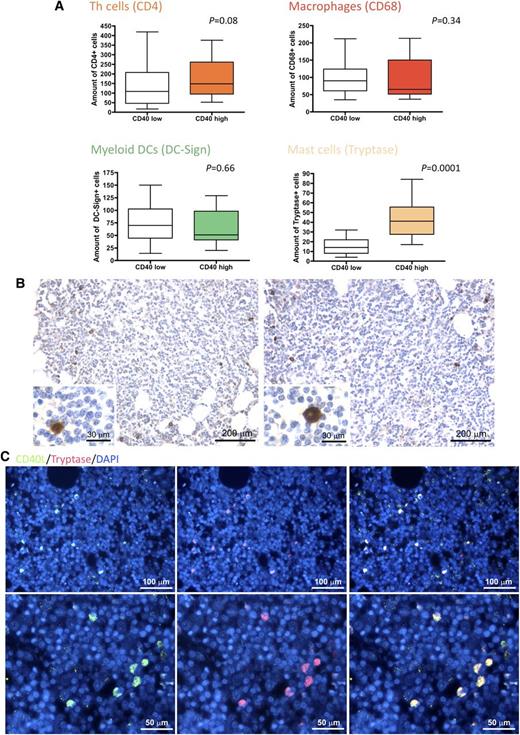
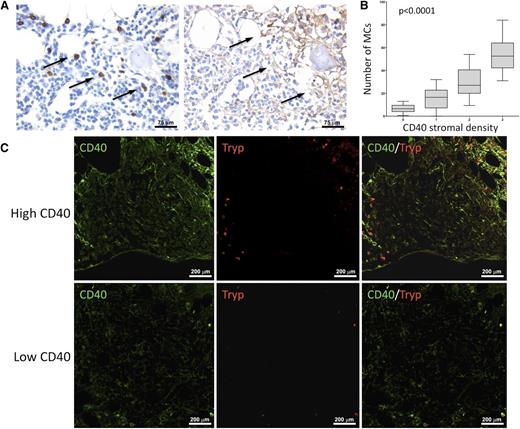
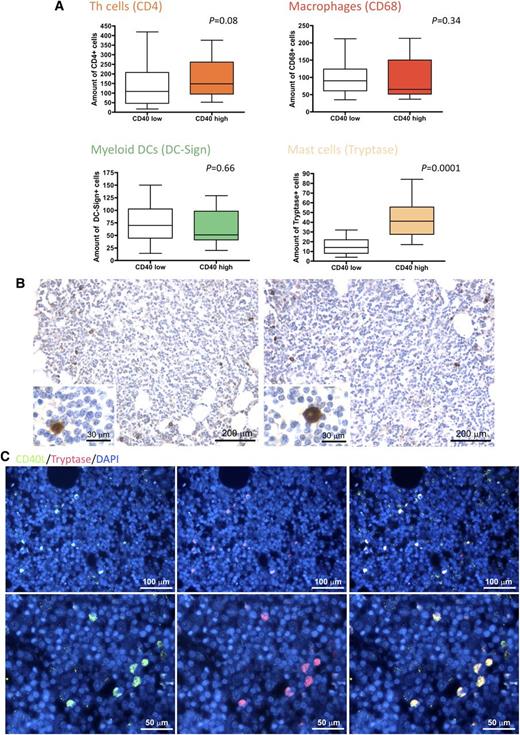
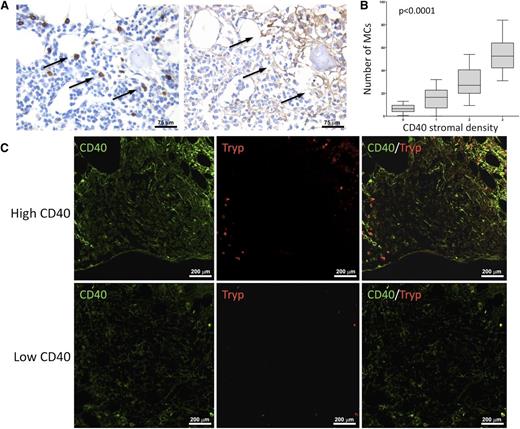
In light of the clinicopathological correlations suggesting an influence of CD40 stromal expression in SMZL infiltrates during the disease course, we looked within the same infiltrates for bystander cells known to express the costimulatory CD40L as candidate partners of interaction with CD40-expressing SCs. We quantified infiltrating CD4+ T helper cells, CD68+ macrophages, DC-Sign+ myeloid dendritic cells, and tryptase+ MCs. Notably, the degree of CD40 expression on SCs significantly correlated with the number of infiltrating MCs, but not with that of other infiltrating immune cells (Figure 2A). In situ analysis of CD40L (CD154) expression confirmed that within SMZL lymphoid infiltrates, the cognate ligand of CD40 was expressed by infiltrating cells with large monocytoid morphology suggestive of MCs and by scattered small cells with lymphoid morphology (Figure 2B). Consistently, cells most intensely expressing CD40L also expressed MC tryptase, as assessed by double-marker immunofluorescence analysis (Figure 2C). In cases with conspicuous CD40 expression in the BM stroma, MCs were detected within neoplastic lymphoid aggregates and showed a higher density in areas with stronger CD40 expression (P < .0001) (Figure 3).
CD40 BM stromal expression correlates with the number of CD40L-expressing infiltrating MCs. (A) Analysis of the number of infiltrating CD4+ T helper cells, CD68+ macrophages, DC-Sign+ myeloid dendritic cells, and tryptase+ MCs in SMZL BM infiltrates, subdivided according to high or low stromal CD40 expression. The degree of CD40 expression on SCs significantly correlated with the number of infiltrating MCs, but not with that of other infiltrating cells. (B) Representative immunohistochemical stainings for CD40L on SMZL BM infiltrates revealing that CD40L (brown signal) is mainly expressed by infiltrating cells with large monocytoid morphology suggestive of MCs (insets) and by scattered small cells with lymphoid morphology. Microphotograph is relative to 1 representative case of the 66 evaluated. Immunohistochemistry, STREPTavidin–biotin–peroxidase complex method, 3,3′-diaminobenzidine (DAB) chromogen; original magnification X100, insets X400; (C) Double-marker immunofluorescence for CD40L (green signal) and tryptase (red signal) expression in SMZL BM infiltrates showing that CD40L-expressing cells mostly coexpress MC tryptase (yellow signal). Microphotographs are relative to 1 representative case with high (score 3) CD40 stromal expression. Immunofluorescence with Alexa-488 and Alexa-568 fluorochromes; original magnification upper panels, ×200; lower panels, ×400.
CD40 BM stromal expression correlates with the number of CD40L-expressing infiltrating MCs. (A) Analysis of the number of infiltrating CD4+ T helper cells, CD68+ macrophages, DC-Sign+ myeloid dendritic cells, and tryptase+ MCs in SMZL BM infiltrates, subdivided according to high or low stromal CD40 expression. The degree of CD40 expression on SCs significantly correlated with the number of infiltrating MCs, but not with that of other infiltrating cells. (B) Representative immunohistochemical stainings for CD40L on SMZL BM infiltrates revealing that CD40L (brown signal) is mainly expressed by infiltrating cells with large monocytoid morphology suggestive of MCs (insets) and by scattered small cells with lymphoid morphology. Microphotograph is relative to 1 representative case of the 66 evaluated. Immunohistochemistry, STREPTavidin–biotin–peroxidase complex method, 3,3′-diaminobenzidine (DAB) chromogen; original magnification X100, insets X400; (C) Double-marker immunofluorescence for CD40L (green signal) and tryptase (red signal) expression in SMZL BM infiltrates showing that CD40L-expressing cells mostly coexpress MC tryptase (yellow signal). Microphotographs are relative to 1 representative case with high (score 3) CD40 stromal expression. Immunofluorescence with Alexa-488 and Alexa-568 fluorochromes; original magnification upper panels, ×200; lower panels, ×400.
MCs are spatially associated with areas of dense CD40 stromal expression. In BM biopsies with high CD40 stromal expression, tryptase+ MCs were observed within neoplastic lymphoid aggregates and showed a higher density in areas with stronger CD40 expression. Such association is detectable by immunohistochemical analysis for MC tryptase and CD40 (brown signals) on BMB serial sections (A) and by double-marker immunofluorescence on confocal microscopy for the same markers (CD40, green signal; tryptase, red signal) (C). Immunohistochemistry, STREPTavidin–biotin–peroxidase complex method, DAB chromogen; original magnification ×400. Immunofluorescence with Alexa-488 and Alexa-568 fluorochromes; original magnification ×200. Microphotographs are relative to 2 representative cases with high (score 3) and low (score 1) CD40 stromal expression. (B) Significant positive correlation between the degree of infiltrating tryptase+ and CD40+ BMSCs in SMZL patients.
MCs are spatially associated with areas of dense CD40 stromal expression. In BM biopsies with high CD40 stromal expression, tryptase+ MCs were observed within neoplastic lymphoid aggregates and showed a higher density in areas with stronger CD40 expression. Such association is detectable by immunohistochemical analysis for MC tryptase and CD40 (brown signals) on BMB serial sections (A) and by double-marker immunofluorescence on confocal microscopy for the same markers (CD40, green signal; tryptase, red signal) (C). Immunohistochemistry, STREPTavidin–biotin–peroxidase complex method, DAB chromogen; original magnification ×400. Immunofluorescence with Alexa-488 and Alexa-568 fluorochromes; original magnification ×200. Microphotographs are relative to 2 representative cases with high (score 3) and low (score 1) CD40 stromal expression. (B) Significant positive correlation between the degree of infiltrating tryptase+ and CD40+ BMSCs in SMZL patients.
The in vitro interaction between BM mesenchymal SCs and MCs results in CD40 upregulation and proinflammatory cytokine release
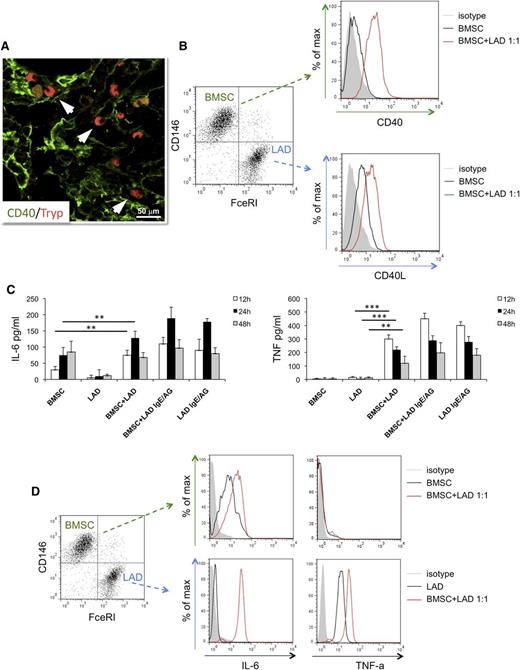
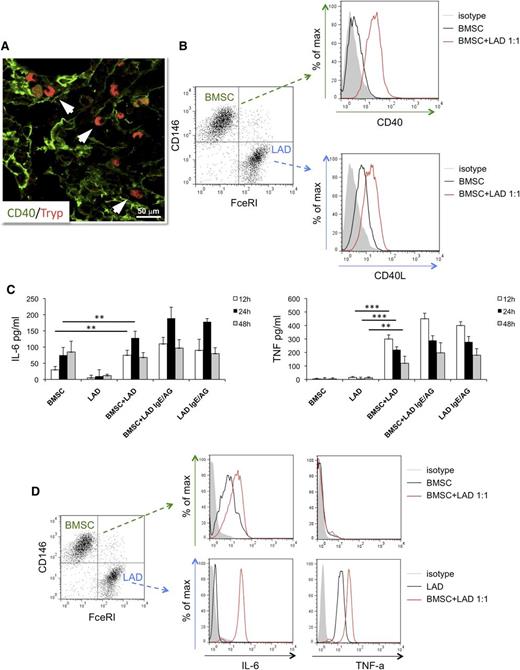
The direct interaction between MCs and CD40+ BMSCs occurring within SMZL infiltrates (Figure 4A) suggested investigating the outcome of such interaction using in vitro assay. BMSCs purified from normal marrows of patients undergoing BM aspirate for staging of Hodgkin’s lymphoma and either the human MC line LAD2 or MCs differentiated from healthy donors’ buffy coats were cocultured in vitro.
In vitro interaction between BM mesenchymal SCs and MCs. (A) Immunolocalization analysis shows direct interaction between tryptase+ MCs and CD40+ SCs within BM SMZL infiltrates. Immunofluorescence with Alexa-488 and Alexa-568 fluorochromes; original magnification ×400. Microphotograph is relative to 1 representative case with high CD40 stromal expression (score 3). (B) BMSCs and LAD2 MCs are driven toward upregulation of CD40 and CD40L, respectively, on 24-hour coculture. (C) IL-6 (left) and TNF (right) release measured by ELISA in the coculture medium of unstimulated or IgE-Ag-activated MCs and BMSCs after 12, 24, and 48 hours interaction. BMSC culturing in the presence of MC results in significant release of the 2 proinflammatory cytokines, even in the absence of IgE-Ag stimulation. (D) Intracellular flow cytometry after 24 hours of coculture between BMSC and unstimulated MC reveals that MCs are the only source of TNF, whereas both BMSCs and MCs contribute to IL-6 production. **P < .01; ***P < .001.
In vitro interaction between BM mesenchymal SCs and MCs. (A) Immunolocalization analysis shows direct interaction between tryptase+ MCs and CD40+ SCs within BM SMZL infiltrates. Immunofluorescence with Alexa-488 and Alexa-568 fluorochromes; original magnification ×400. Microphotograph is relative to 1 representative case with high CD40 stromal expression (score 3). (B) BMSCs and LAD2 MCs are driven toward upregulation of CD40 and CD40L, respectively, on 24-hour coculture. (C) IL-6 (left) and TNF (right) release measured by ELISA in the coculture medium of unstimulated or IgE-Ag-activated MCs and BMSCs after 12, 24, and 48 hours interaction. BMSC culturing in the presence of MC results in significant release of the 2 proinflammatory cytokines, even in the absence of IgE-Ag stimulation. (D) Intracellular flow cytometry after 24 hours of coculture between BMSC and unstimulated MC reveals that MCs are the only source of TNF, whereas both BMSCs and MCs contribute to IL-6 production. **P < .01; ***P < .001.
The expression of CD40 and CD40L were assessed by flow cytometry, using the CD146 BMSC and FceRI-alpha MC markers to identify the 2 populations. On 24 hours of coculture at a 1:1 ratio, BMSCs and unstimulated LAD2 MCs showed significant upregulation of CD40 and CD40L, respectively, whose expression was otherwise dim in basal conditions (Figure 4B). The upregulation of CD40 on BMSCs was observed at different BMSC:MC ratios; namely, 5:1, 1:1, and 1:5, with minimal differences (supplemental Figure 5A). Comparable results in terms of CD40 upregulation on BMSCs were observed using MCs from buffy coats instead of the LAD2 MC line in the coculture (supplemental Figure 5B). The outcome of BMSC-MC coculture was further investigated, measuring the synthesis of the prototypical inflammatory cytokines TNF and IL-6 at discrete times of BMSC-MC coculture.
Unstimulated or IgE-antigen (Ag)-activated MCs and BMSCs were either cultured alone or cocultured for 12, 24, and 48 hours before measuring TNF and IL-6 levels by ELISA. In all the culture conditions in which activated MCs were cultured alone or in the presence of BMSCs, the 2 cytokines were detected, with the highest concentrations being detected at 12 and 24 hours for TNF and IL-6, respectively (Figure 4C). Strikingly, when unstimulated MCs were cocultured with BMSCs, high levels of TNF and IL-6 were also detected, with a similar time trend (Figure 4C). In contrast, no significant TNF release was observed when unstimulated MCs and BMSC were cultured alone, whereas IL-6 was only detected at 24 and 48 hours in BMSC cultures (Figure 4C), consistent with the intrinsic IL-6 production by BM stroma.30 To determine the main source of TNF and IL-6 in the BMSC-MC cocultures, intracellular flow cytometry analysis was performed at the 24-hour point. FceRI-alpha+ MCs were the only source of TNF, which was also detected in unstimulated MC being stored within granules, whereas both MCs and BMSCs synthesized IL-6 (Figure 4D). These results suggest that the interaction between BMSC and MC is sufficient to trigger the early release of prestored TNF by MCs and to eventually induce the synthesis and release of IL-6, also in the absence of canonical MC activation.
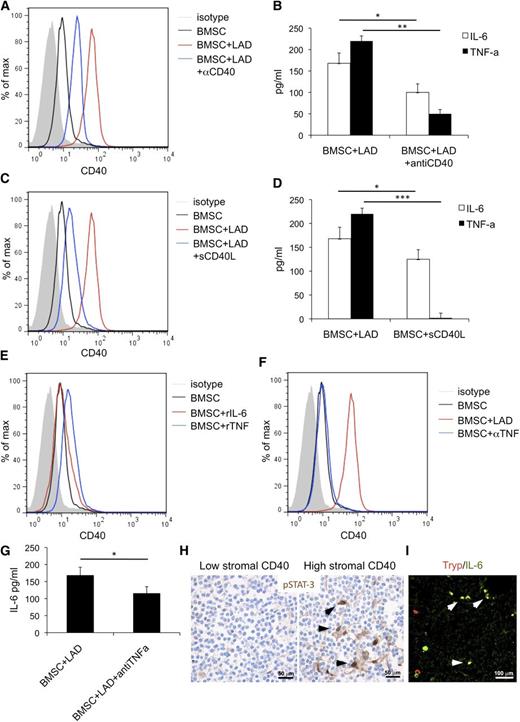
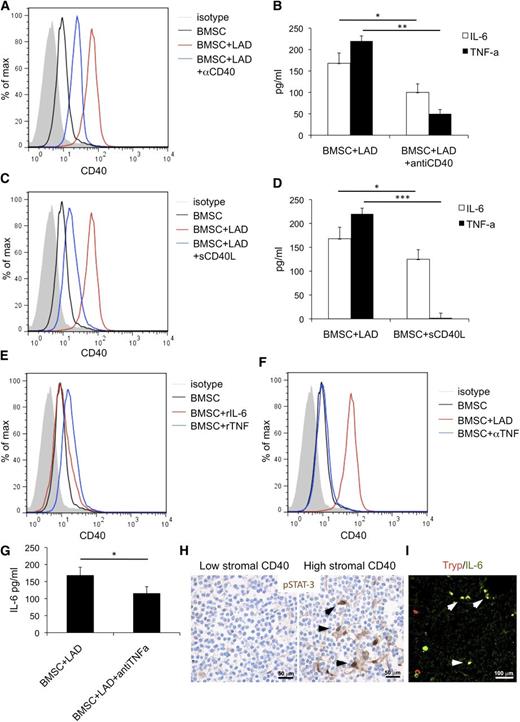
The same experiments performed adding a blocking anti-CD40 antibody reduced the upregulation of CD40 on BMSC (Figure 5A) and decreased the release of TNF and IL-6 in the coculture supernatant (Figure 5B). Confirming the relevance of CD40-mediated stimuli in BMSC activation, BMSCs cultured in the presence of soluble CD40L showed significant CD40 upregulation and IL-6 release, whereas TNF release was not affected (Figure 5C-D). Recombinant TNF (rTNF) or IL-6 (rIL-6) was given to BMSC to test their contribution to CD40-mediated BMSC activation. A slight increase in CD40 expression on BMSCs was observed in response to rTNF, but not rIL-6 (Figure 5E). Consistently, the addition of a blocking anti-TNF antibody to the BMSC-MC coculture reduced the extent of CD40 induction on BMSC (Figure 5F) and decreased IL-6 levels in the coculture supernatant (Figure 5G). This was consistent with TNF derived from MCs on BMSC interaction sustaining BMSC activation and with IL-6 being one “end product” of such an interaction.
BMSC and MC activatory outcome depend on CD40/CD40L interaction. The addition of a blocking anti-CD40 antibody (αCD40) to the BMSC-MC coculture reduces the upregulation of CD40 on BMSC (A) and significantly decreases the release of TNF and IL-6 in the coculture supernatants (B). Consistently, soluble CD40L (sCD40L) induces significant CD40 upregulation (C) and increased IL-6 release by BMSC (D), although it has no effect on TNF release. (E) BMSC stimulation with rTNF causes a slight increase in CD40 expression on BMSC. In contrast, CD40 expression is not significantly modified by BMSC stimulation with rIL-6. (F) The addition of blocking anti-TNF antibody (αTNF) to the BMSC-MC coculture reduces the expression of CD40 induction on BMSC and (G) significantly decreases IL-6 levels. (H) Immunohistochemistry for pSTAT3, showing a higher number of cells with pSTAT3 nuclear localization within the BM infiltrates of cases with high CD40 stromal expression. Immunohistochemistry, STREPTavidin-biotin-peroxidase complex method, DAB chromogen; original magnification ×400. Microphotographs are relative to 2 representative cases with high (score 3) and low (score 1) CD40 stromal expression out of the 30 evaluated. (I) In cases with elevated CD40 stromal expression, double immunofluorescent analysis revealed the presence of tryptase+ MCs (red signal) expressing IL-6 (green signal). Immunofluorescence with Alexa-488 and Alexa-568 fluorochromes; original magnification ×400. Microphotograph is relative to 1 representative case with high (score 3) CD40 stromal expression. *P < .05; **P < .01; ***P < .001.
BMSC and MC activatory outcome depend on CD40/CD40L interaction. The addition of a blocking anti-CD40 antibody (αCD40) to the BMSC-MC coculture reduces the upregulation of CD40 on BMSC (A) and significantly decreases the release of TNF and IL-6 in the coculture supernatants (B). Consistently, soluble CD40L (sCD40L) induces significant CD40 upregulation (C) and increased IL-6 release by BMSC (D), although it has no effect on TNF release. (E) BMSC stimulation with rTNF causes a slight increase in CD40 expression on BMSC. In contrast, CD40 expression is not significantly modified by BMSC stimulation with rIL-6. (F) The addition of blocking anti-TNF antibody (αTNF) to the BMSC-MC coculture reduces the expression of CD40 induction on BMSC and (G) significantly decreases IL-6 levels. (H) Immunohistochemistry for pSTAT3, showing a higher number of cells with pSTAT3 nuclear localization within the BM infiltrates of cases with high CD40 stromal expression. Immunohistochemistry, STREPTavidin-biotin-peroxidase complex method, DAB chromogen; original magnification ×400. Microphotographs are relative to 2 representative cases with high (score 3) and low (score 1) CD40 stromal expression out of the 30 evaluated. (I) In cases with elevated CD40 stromal expression, double immunofluorescent analysis revealed the presence of tryptase+ MCs (red signal) expressing IL-6 (green signal). Immunofluorescence with Alexa-488 and Alexa-568 fluorochromes; original magnification ×400. Microphotograph is relative to 1 representative case with high (score 3) CD40 stromal expression. *P < .05; **P < .01; ***P < .001.
The in vitro data showing that BMSC-MC interplay through CD40/CD40L engenders proinflammatory conditions suggested investigating the in vivo expression of the phosphorylated form of signal transducer and activator of transcription 3 (pSTAT3), a key mediator of TNF/IL-6 signals and of noncanonical CD40-mediated nuclear factor κB (NF-κB) signaling, in SMZL BM infiltrates. Grippingly, pSTAT3 was detected in the nuclei of BMSCs with spindle-to-stellate morphology within SMZL infiltrates of cases with high CD40 stromal expression, whereas it was barely detectable in the infiltrates of low CD40 cases, suggesting that CD40 expression was associated with active NF-κB signaling in SCs (Figure 5H). Moreover, in cases characterized by elevated CD40 stromal expression, double immunofluorescence analysis revealed a high number of IL-6-expressing cells, most of which coexpressed the MC marker tryptase (Figure 5I).
BMSC–MC interaction sustains mature B-cell proliferation in vitro
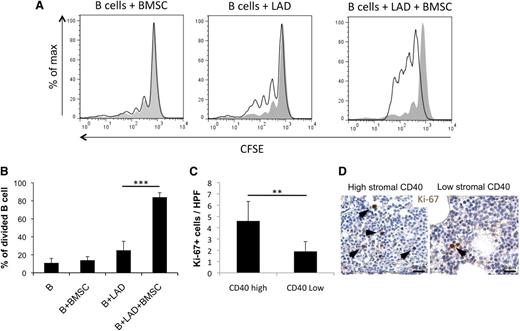
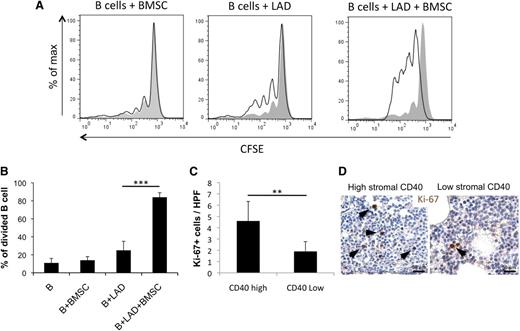
In SMZL cases with high stromal CD40 expression, which are characterized by shorter time to progression, the BMSC, MC, and neoplastic B cells populate the same microenvironment. The proinflammatory conditions induced by BMSC-MC interaction could cast an influence over the B-cell clone, likely favoring its progression. We thus reproduced in vitro the BMSC–MC–B-cell interaction to investigate its effects on B-cell proliferation. CD19+CD21+IgM+ B cells obtained from the PB of healthy donors were cultured in the presence of BMSCs, MCs, or both and evaluated for proliferation by fluorescence-activated cell sorter. Notably, coculturing B cells with both BMSC and MC, but not with BMSC or MC alone, significantly increased their proliferation (Figure 6A-B). Supporting the role of BMSC-MC interplay in sustaining B-cell proliferation, SMZL cases with dense stromal CD40 expression showed a higher number of lymphoid cells expressing the proliferation marker Ki-67 than cases with low CD40 stromal expression (Figure 6C-D) (P < .01).
Interaction between BMSCs and MCs results in an increased mature B-cell proliferation. (A-B) CD19+CD21+IgM+ circulating B cells obtained from healthy donors increase their proliferative rate when cocultured with BMSC-MC in the absence of additional stimuli. (C-D) The number of Ki-67+ cells in the CD40 low and CD40 high groups indicates a higher proliferation rate in cases with high CD40 expression in the BM stroma. Immunohistochemistry, STREPTavidin–biotin–peroxidase complex method, DAB chromogen; original magnification ×400. Microphotographs are relative to 2 representative cases with high (score 3) and low (score 1) CD40 stromal expression. **P < .01; ***P < .001.
Interaction between BMSCs and MCs results in an increased mature B-cell proliferation. (A-B) CD19+CD21+IgM+ circulating B cells obtained from healthy donors increase their proliferative rate when cocultured with BMSC-MC in the absence of additional stimuli. (C-D) The number of Ki-67+ cells in the CD40 low and CD40 high groups indicates a higher proliferation rate in cases with high CD40 expression in the BM stroma. Immunohistochemistry, STREPTavidin–biotin–peroxidase complex method, DAB chromogen; original magnification ×400. Microphotographs are relative to 2 representative cases with high (score 3) and low (score 1) CD40 stromal expression. **P < .01; ***P < .001.
Interaction between MCs and CD40-expressing mesenchymal cells characterizes SMZ lymphomagenesis in p53−/− mice
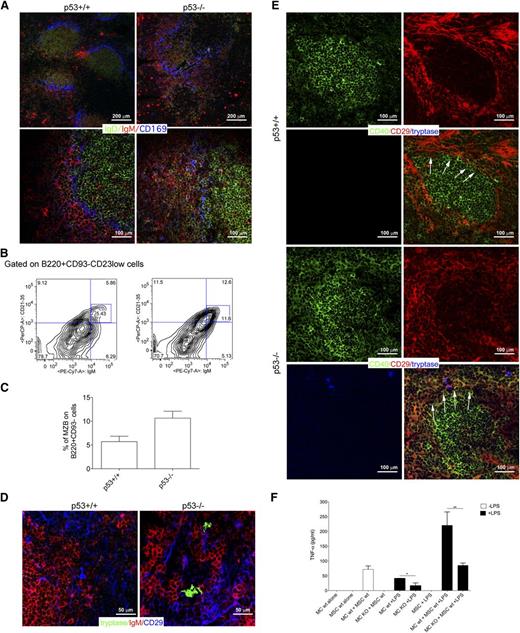
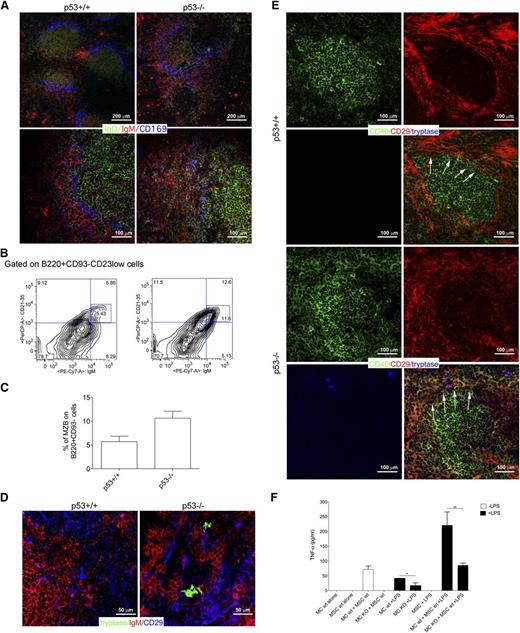
p53−/− mice are prone to develop lymphomas of different histotypes, including SMZLs.31,32 SMZLs developing in the p53−/− mouse model are suitable for testing whether the interaction between MCs and CD40-expressing mesenchymal cells can find correlation also in mice, confirming that a conserved biology underscores this process. Nearly 25% of 6- to 9-week-old p53−/− mice developed an SMZ lymphoproliferation characterized by flow cytometry, for the expansion of CD23low/CD21/35high/IgDlow/IgMhigh/B220+ cells in the splenic and BM parenchyma and, by in situ multiple-marker confocal microscopy, for the expansion of IgDlowIgMhigh cells effacing the SMZ, identified by CD169+ macrophages, and subverting the normal follicular splenic architecture (Figure 7A-C; supplemental Figure 6). Mice with SMZ lymphoproliferation were analyzed for the presence of MCs interacting with CD40+ mesenchymal cells. Within the expanded SMZ of these mice, CD29+ mesenchymal cells were found in contact with MCs and IgM+ cells (Figure 7D). Moreover, mesenchymal cells contacting tryptase+ MCs showed the upregulation of CD40 (Figure 7E). Neither the expression of CD40 in CD29+ mesenchymal cells, nor the presence of infiltrating MCs could be detected in the MZ of spleen from BALB/c control mice (Figure 7D-E).
Crosstalk between BMSCs and MCs in mouse models. (A) Confocal microscopy analysis for IgD (green), IgM (red), and CD169 (blue) of the spleen of p53+/+ and p53−/− mice shows the expansion of IgMhighIgDlow MZ B cell in p53−/− mice compared with their wild-type counterpart. In p53+/+ mice, MZ B cells are not expanded and confined within the MZ (arrows). Upper panel original magnification ×100; lower panel, original magnification ×200. (B) Representative flow cytometry analysis showing the increased accumulation of CD21/35highIgMhigh in the spleen of p53−/− mice. The complete gating strategy is shown in supplemental Figure 6. (C) Cumulative data showing the increased percentage of MZ B cells in the spleens from p53−/− mice if compared with p53+/+ mice. (D) Confocal microscopy analysis for tryptase (green), IgM (red), and CD29 (blue) performed in the spleen of p53+/+ and p53−/− mice. Representative pictures are shown. In the spleen of p53−/− mice, tryptase+ MCs make contact with CD29+ mesenchymal cells. This interaction does not occur within the spleens of wild-type mice. Original magnification ×400. (E) Confocal microscopy analysis showing the expression of CD40 in the spleen of p53+/+ and p53−/− mice. In wild-type mice, CD40 (green) expression is restricted to the follicular area. In the spleen of p53−/− mice, CD40 is also expressed by mesenchymal CD29+ (red) cells outside the follicular area, which take contact with tryptase+ MCs (blue). Original magnification ×200. (F) TNF production was measured by ELISA in supernatants obtained from BM-MSC and MC cocultures. In this experiment, wild-type or CD40L−/− MCs were treated with 100 ng/mL LPS for 4 hours, washed, and than added to a monolayer of BM mesenchymal SCs for 24 hours. Each bar, untreated (black bars) or stimulated (white bars), represents the mean ± standard deviation of 2 independent cocultures.
Crosstalk between BMSCs and MCs in mouse models. (A) Confocal microscopy analysis for IgD (green), IgM (red), and CD169 (blue) of the spleen of p53+/+ and p53−/− mice shows the expansion of IgMhighIgDlow MZ B cell in p53−/− mice compared with their wild-type counterpart. In p53+/+ mice, MZ B cells are not expanded and confined within the MZ (arrows). Upper panel original magnification ×100; lower panel, original magnification ×200. (B) Representative flow cytometry analysis showing the increased accumulation of CD21/35highIgMhigh in the spleen of p53−/− mice. The complete gating strategy is shown in supplemental Figure 6. (C) Cumulative data showing the increased percentage of MZ B cells in the spleens from p53−/− mice if compared with p53+/+ mice. (D) Confocal microscopy analysis for tryptase (green), IgM (red), and CD29 (blue) performed in the spleen of p53+/+ and p53−/− mice. Representative pictures are shown. In the spleen of p53−/− mice, tryptase+ MCs make contact with CD29+ mesenchymal cells. This interaction does not occur within the spleens of wild-type mice. Original magnification ×400. (E) Confocal microscopy analysis showing the expression of CD40 in the spleen of p53+/+ and p53−/− mice. In wild-type mice, CD40 (green) expression is restricted to the follicular area. In the spleen of p53−/− mice, CD40 is also expressed by mesenchymal CD29+ (red) cells outside the follicular area, which take contact with tryptase+ MCs (blue). Original magnification ×200. (F) TNF production was measured by ELISA in supernatants obtained from BM-MSC and MC cocultures. In this experiment, wild-type or CD40L−/− MCs were treated with 100 ng/mL LPS for 4 hours, washed, and than added to a monolayer of BM mesenchymal SCs for 24 hours. Each bar, untreated (black bars) or stimulated (white bars), represents the mean ± standard deviation of 2 independent cocultures.
This datum suggests that the interplay between MCs and mesenchymal cells toward CD40 stromal expression may be a relevant motif of changes accommodating SMZ lymphoproliferation.
The relevance of the CD40L/CD40 axis in the activatory outcome of the MC/mesenchymal SC interaction was strengthened by results obtained coculturing MCs, differentiated from the BM of either BALB/c or CD40L−/− mice, with BMSCs. After 24 hours of coculture, TNF release was measured under basal conditions or after MC lipopolysaccharide (LPS) priming. Significant TNF release was detected when MCs and BMSCs were both wild-type, and such release was significantly increased by LPS priming (Figure 7F). Differently, the amount of TNF was significantly reduced when CD40L−/− MCs were cocultured with wild-type BMSCs, confirming the importance of an intact CD40/CD40L synapse for MC activation on interaction with BMSCs (Figure 7F). A similar finding was obtained using IgE/dinitrophenyl stimulation for MCs (not shown), consistent with the idea that MCs trigger the vicious interaction with mesenchymal cells upon stimulation.
Discussion
The pathobiology of SMZL remains poorly understood. Recently, genetic sequencing of SMZL clones has revealed mutations within major pathways driving MZ B-cell development.5 Moreover, genetic lesions involving NF-κB pathways and leading to their activation have been reported in SMZL, suggesting that NF-κB–mediated environment stimuli may have a consistent role along discrete phases of SMZL lymphomagenesis.5,33
We have challenged the hypothesis that relevant information regarding SMZL biology could be inferred from the analysis of the BM stromal microenvironment. We focused on the analysis of the BM infiltrates for 2 reasons: first, BM is virtually always involved and, in most cases, represents the primary source of neoplastic cells for diagnostic assessment; and second, stromal modifications induced de novo by the neoplastic clone on BM infiltration are likely to be enriched in the key features relevant to clone establishment and progression.
SMZL displays a significant tropism for the vascular sinusoidal compartment of the spleen and the BM, which share features in terms of cellular composition and adhesion profile allowing trafficking and homing of hematopoietic cells.14,34,35 We analyzed the stroma of BM SMZL infiltrates, focusing on elements of the vascular niche; namely, CD31+ endothelial cells and CD10+ ARCs. These cells concur to the formation of complex chemotactic and adhesive axes, including that of CXCL12/CXCR4 and those of intercellular adhesion molecule 1 and vascular cell adhesion molecule 1 and their integrin ligands, which physiologically regulate localization and maturation of hematopoietic stem cell progeny and their intravasation/extravasation dynamics.36,37 Moreover, the CXCL12/CXCR4 axis has been implicated in the localization of leukemic/lymphomatous cells in supportive “leukemic niches” and in the delivery of prosurvival signals to neoplastic cells via extracellular signal-regulated kinase/mitogen-activated protein signaling pathways.38 We did not find correlation between the microvascular density or the ARC meshwork density and relevant clinical or prognostic features. In contrast, we uncovered a significant correlation between elevated CD40 expression in the stroma of BM SMZL infiltrates and unfavorable clinical and prognostic features. The finding of BM stroma CD40 expression endorsing prognostic/predictive value in SMZL warrants validation in specifically designed studies and raises the question of whether events occurring in the SMZL BM microenvironment may mirror those of the splenic parenchyma. Actually, CD40 stromal expression was evaluated in 9 of the 11 diagnostic splenectomy samples. In these samples, CD40 marked with variable intensity the SMZL clone and the associated stromal meshwork. CD40 stromal expression ranged from focal and dim (4 cases) to diffuse and intense (5 cases) (supplemental Figure 7). A concordant intensity of CD40 stromal expression in the BM and spleen parenchyma was observed in 5 cases (3 had low spleen/low BM expression and 2 high spleen/high BM expression), whereas in 4 cases, the expression was discordant, being intense in the spleen stroma and low in the BM. As far as the splenectomy specimens collected on progression were concerned, most of the cases (6 of 7) showed a diffuse and intense stromal CD40 expression. The paucity of diagnostic splenectomy samples and the diversity in the composition of the splenic and medullary stromal environments precludes speculating on the association between CD40 expression in each of the 2 disease sites. Nevertheless, the finding of CD40 upregulation in stromal elements of SMZL spleen samples as compared with normal controls, along with the evidence of MCs and CD40+ mesenchymal cells, displaying spatial interaction within the expanded MZ of p53−/− mice developing SMZL, let us envisage a functional role for such an interplay in the SMZL niche lato sensu.
In mesenchymal elements, CD40 expression mediates cell activation inducing the synthesis of adhesion molecules, chemokines, and proinflammatory cytokines.28,29 CD40 triggering is provided by the interaction with CD40L-expressing elements, including activated T-helper cells, B cells, dendritic cells, macrophages, granulocytes, platelets, and MCs. We found that SMZL cases with high CD40 expression were infiltrated by a higher number of CD40L-expressing immune cells. In particular, MCs were significantly enriched within SMZL infiltrates with dense stromal CD40 meshwork. MCs have emerged as pleiotropic cells acting at the edge between innate and adaptive immunity, with a key regulatory role in immune responses.39 A puzzling scenario emerges from studying MCs in cancer-associated immunity, where they are credited of either pro- or antitumor activity depending on the cancer histotype and the disease stage.40 In lymphoid neoplasms, MCs have been reported to exert protumoral functions. In lymphoplasmacytic lymphoma, MCs increase neoplastic cell proliferation and survival via the CD40/CD40L axis.20,41 Similarly, in classical Hodgkin’s lymphoma, Reed Sternberg cell viability is supported by MCs through the CD30/CD30L axis.42
Here, we showed that engagement of CD40 on BMSC by MC CD40L resulted in proinflammatory cytokine synthesis and release. BMSC are involved in the maintenance of tolerogenic conditions within the BM and have been consistently demonstrated to play immunoregulatory functions in physiological and pathological contexts. Thus, the proinflammatory outcome resulting from the interaction with MCs, documented in vitro, may appear contradictory, also considering that BMSC can suppress degranulation of MC mediators involved in type 1 hypersensitivity responses.43 Nevertheless, the outcome of BMSC/MC interaction to some extent recapitulates that of MC interaction with other regulatory cells, namely, T-regulatory lymphocytes, which are able to suppress MC release of histamine via the OX40/OX40L axis while being contrasuppressed by MC cytokine release and eventually skewed toward Th17 under the pressure of a proinflammatory environment.44,45 Similarly, early TNF and late IL-6 release from MCs induce a proinflammatory phenotype in BMSCs contacted via the CD40/CD40L axis. These events may contribute to SMZL progression by the instruction of an overly inflammatory microenvironment, as demonstrated by IL-6-expressing MCs and stromal pSTAT3 expression in BM infiltrates of CD40-high cases. We observed BMSC-MC coculture enhancing the proliferative rate of mature B cells. Consistently, a higher number of Ki-67+ lymphoid cells were detected in situ in cases with dense stromal CD40 expression and prominent MC infiltration. In addition to the induction of an activated stroma and proinflammatory milieu, the contribution of MCs to the proliferation of lymphomatous B cells may be exerted through a direct interplay.46 We have previously demonstrated that MCs support proliferation, survival, and plasma cell differentiation of naïve B cells through CD40L/CD40 interaction and IL-6 release.19 Moreover, MCs are capable of directly sustaining B-cell activation and proliferation through the synthesis of the trophic factor BLyS/BAFF. In our series, the correlation between the number of infiltrating MCs, CD40 stromal expression, and the expression of B-cell activating factor receptor in SMZL BM infiltrates was also analyzed (supplemental Figure 8). Although B-cell activating factor receptor expression in SMZL lymphoid infiltrates proved consistent, although variably intense, no significant correlations were found with the extent of MC infiltration or CD40 stromal expression, suggesting that other microenvironment-related features could complement those stemming from the vicious MC/BMSC duet described here.
Our work suggests that interactions between nonneoplastic elements of the SMZL BM microenvironment could be important for disease progression. Pathways that are involved in both neoplastic clone crosstalk with bystander elements and in the shaping of a biased stromal and immunological microenvironment, such as that of CD40-CD40L, might offer precious insights into SMZL pathobiology and prompt the design of new therapeutic strategies.
The online version of this article contains a data supplement.
The publication costs of this article were defrayed in part by page charge payment. Therefore, and solely to indicate this fact, this article is hereby marked “advertisement” in accordance with 18 USC section 1734.
Acknowledgments
We are indebted to Dr Maurilio Ponzoni and Dr Giulio Giannone for precious advice. We thank Dr Otto Octavius for inspiring discussion. The authors acknowledge the Confocal Microscopy Laboratory of the University of Palermo.
This work has been supported by the Associazione Italiana per la Ricerca contro il Cancro (Program Innovative Tools for Cancer Risk Assessment and Diagnosis, 5 per mille no, 12162 to C.T. and M.P.C., investigator grant 10137 to M.P.C., and My First Grant 12810 to S.S.) and by the Association for International Cancer Research (grant 11-0595).
Authorship
Contribution: G.F. and C.T. had the idea for the study; G.F., C.G., P.P.P., M.P.C., and C.T. wrote the manuscript; B.F., S.S., E. Boveri, A.R., R.P., S.B., E. Betto, A.M.F., V.F., E.I., L.A., F.F., A.G., and C.P. performed and analyzed experiments and contributed to manuscript preparation. S.A.P., S.S., M.P.C., and C.T. revised the project and revised the manuscript.
Conflict-of-interest disclosure: The authors declare no competing financial interests.
Correspondence: Claudio Tripodo, Università degli Studi di Palermo, Dipartimento di Scienze per la Promozione della Salute e Materno Infantile, Via del Vespro 129, 90127, Palermo, Italy; e-mail: claudio.tripodo@unipa.it.
References
Author notes
G.F. and C.G. contributed equally to this study.

