Key Points
Besides maintaining short telomeres, telomerase is required for cell proliferation and tumor growth in CTCL.
Abstract
Telomere erosion may be counteracted by telomerase. Here we explored telomere length (TL) and telomerase activity (TA) in primary cutaneous T-cell lymphoma (CTCL) by using quantitative polymerase chain reaction and interphase quantitative fluorescence in situ hybridization assays. Samples from patients with Sézary syndrome (SS), transformed mycosis fungoides (T-MF), and cutaneous anaplastic large cell lymphoma were studied in parallel with corresponding cell lines to evaluate the relevance of TL and TA as target candidates for diagnostic and therapeutic purposes. Compared with controls, short telomeres were observed in aggressive CTCL subtypes such as SS and T-MF and were restricted to neoplastic cells in SS. While no genomic alteration of the hTERT (human telomerase catalytic subunit) locus was observed in patients’ tumor cells, TA was detected. To understand the role of telomerase in CTCL, we manipulated its expression in CTCL cell lines. Telomerase inhibition rapidly impeded in vitro cell proliferation and led to cell death, while telomerase overexpression stimulated in vitro proliferation and clonogenicity properties and favored tumor development in immunodeficient mice. Our data indicate that, besides maintenance of TL, telomerase exerts additional functions in CTCL. Therefore, targeting these functions might represent an attractive therapeutic strategy, especially in aggressive CTCL.
Introduction
Human telomeres consist of tandem repeats of a DNA sequence (5′-TTAGGG-3′) that terminates in a 3′ single-stranded overhang and is organized in a higher-order structure built and stabilized by shelterin protein complex.1 Such a cap is thought to sequester the end of the chromosomes away from the double-strand break repair apparatus and prevent aberrant chromosomal fusions and recombinations. Telomeres also perform other functions, which include transcriptional silencing of genes located close to them, as well as ensuring correct chromosome segregation during mitosis.2 Because of the end-replication problem, loss of telomeric sequences occurs during each cell division,3 resulting in the gradual and predictable erosion of telomeres (reviewed in Cech4 ). This process reduces the chromosome’s ability to form functional capped telomere structures.5 When telomere length (TL) reaches a certain limit, telomeres become dysfunctional and elicit a p53-dependent DNA damage checkpoint response6,7 which, depending on the cell type, triggers either replicative senescence or apoptotic cell death. In stem cells, germ-cell lineages, and in nearly 90% of tumors, this proliferative limit is overcome by activating telomerase, a reverse transcriptase enzyme (TERT) that uses an RNA molecule (TERC) as a template to add DNA repeats onto the 3′ chromosomal ends.8-10 Telomere dysfunction and telomerase deregulation have been found to be associated with genomic instability and disease progression.11 Therefore, TL and telomerase expression may constitute prognostic tools and potential targets for anticancer drugs.12 This concept, first established in solid tumors,13,14 can now be applied in most hematologic malignancies.15,16
Relatively few studies on telomere status and telomerase activity (TA) in T-cell malignancies have been published.12,17 The aim of this study was to investigate such parameters in cutaneous T-cell lymphomas (CTCLs), since they were not previously assessed in neoplastic cells.18-20 We focused on common subtypes of CTCL: 2 aggressive forms, transformed mycosis fungoides (T-MF) and Sézary syndrome (SS) with a median survival of ∼2 years, and primary cutaneous anaplastic large cell lymphoma (C-ALCL), with a favorable prognosis (10-year disease-related survival exceeding 90%).21 In these lymphoproliferations, the neoplastic T cells involve the skin as a primary site, but with disease progression, abnormal cells may also infiltrate blood, lymph nodes, lungs, heart, liver, and spleen, except for SS, which arises suddenly as an aggressive leukemic variant.21 Whereas recent cytogenetic studies on T-MF, SS, and C-ALCL reported the presence of genetic aberrations,22-29 the key molecular targets underlying CTCL pathogenesis remain elusive. This lack of insight into the biology of CTCL has hindered the development of true targeted therapies.30,31
In this context, we explored TL and TA in CTCL by using cell lines (Hut78, Se-Ax, My-La, FE-PD) and patient cells (SS, T-MF, and C-ALCL) to better understand the role played by telomeres and telomerase in pathogenesis and to evaluate the relevance of these biomarkers as target candidates for diagnostic and therapeutic purposes.
Patients and methods
Patients and healthy donors
Fifty-seven patients with CTCL, according to the criteria of the World Health Organization and the European Organisation for Research and Treatment of Cancer,21,32 were selected in the CTCL cohort of Aquitaine. This study complied with the Declaration of Helsinki and was approved by the local ethics committee. Each patient gave written consent. Twenty-four SS (supplemental Table 1, available on the Blood Web site.), 19 T-MF, and 14 C-ALCL samples were analyzed and compared with peripheral blood samples from 49 age-matched healthy donors (25 males, 24 females) recruited from the Etablissement Français du Sang in Bordeaux, France.
Cells and cell lines
Experiments were performed on either peripheral blood mononuclear cells or 2 SS cell lines (Hut78 [LGC Standards] and Se-Ax [kindly provided by Dr K. Kaltoft, Aarhus, Denmark]), 1 T-MF cell line (My-La [Dr K. Kaltoft], a CD30+ALK– Hodgkin-like ALCL), FE-PD (Prof G. Delsol, Toulouse, France), and a T-cell lymphoblastic leukemia cell line (1301; Sigma-Aldrich). Since 1301 exhibited unusually long telomeres and was telomerase positive, it was used as a positive control.
DNA and RNA isolation
DNA and RNA were extracted from cell lines, white blood cells, and fresh-frozen tumor biopsies of T-MF and C-ALCL patients. Genomic DNA was prepared from cells by using a salt extraction procedure33 and from tumor biopsies by using proteinase K digestion followed by a standard phenol/chloroform extraction procedure. Total RNA was isolated by using TRIzol reagent (Invitrogen).
TL measurement by qPCR assay and IQFISH
Relative TL was measured from genomic DNA by using a standard quantitative polymerase chain reaction (qPCR) assay.34 For interphase quantitative fluorescence in situ hybridization (IQFISH), cell nuclei were prepared and spread onto glass slides using standard cytogenetic procedures.35 The hybridization was performed according to manufacturer’s instructions (DakoCytomation) with minor modifications.
Slide scanning and quantitative image analysis of interphase nuclei for IQFISH
Slide scanning, nuclei identification, fluorescence intensity, and nuclei surface measurements were performed by using a motorized Axio Imager Z2 microscope (Zeiss) equipped with a motorized 8-slide scanning stage (Märzhäuser Wetzlar), a high-resolution monochrome camera (CoolCube 1m), and Metafer software (MetaSystems). MetaCyte is a single-cell analysis software module integrated into the Metafer platform that enables setting of capture and exposure parameters and determination of target cells, nuclei selection criteria (eg, minimum and maximum nucleus area, maximum relative concavity depth, maximum aspect ratio), and image analysis features (eg, contour area, total signal intensity, ratio value). We collected data from 1000 nuclei per slide.
IF and FISH
To correlate the chromosome content and the neoplastic T-cell status of SS patient cells, we performed sequential labeling by using immunofluorescence (IF) followed by interphase FISH. Images were acquired after each labeling method. To delineate neoplastic SS T cells, CD158e/K (KIR3DL1/DL2 mouse anti-human; magnetic-activated cell sorting; Miltenyi Biotec) and CD3 (rabbit anti-human; Dako) antibodies revealed by anti-mouse antibody conjugated with AlexaFluor 488 and anti-rabbit antibody conjugated with AlexaFluor 594 (Molecular Probes), respectively, were used. Twenty images were collected by using the image analysis workstation (Isis; Metasystems), and microscope coordinates of each image were recorded to relocate the same area after FISH assay. As in SS patients (cases 2 and 17), a partial chromosome 8 gain was observed using multicolor FISH and array comparative genomic hybridization (data not shown). We performed dual-color FISH analysis with LSI c-MYC SpectrumOrange (8q24.12-q24.13) and CEP8 SpectrumGreen (8p11.1-q11.1) (Abbott Molecular, Inc.) with a view toward evaluating chromosome count in normal and neoplastic T cells, knowing that normal T cells are CD3+ and CD158e/k– and that neoplastic SS T cells are both CD3+ and CD158e/k+. As soon as IF images were acquired, slides were used in FISH assays. After FISH assay, nuclei were relocated according to immunostaining coordinates, and c-MYC/chromosome 8 status was evaluated for the same nuclei.
FISH method combined with IQFISH assay
To correlate chromosome count in SS cells and TL, we performed sequential labeling by using an IQFISH assay followed by a FISH assay using LSI c-MYC SpectrumOrange and CEP8 SpectrumGreen. Twenty images of the same area containing approximately 100 nuclei were collected (Isis; Metasystems).
hTERT locus-specific FISH assay
A 3-color FISH strategy using RP11-117B23, RP11-619F12, and RP11-6461O14 was applied. Fluorescence signals were analyzed in 100 nuclei, and metaphase spreads for each sample were studied (Isis; Metasystems).
Real-time qRT-PCR
hTERT messenger RNA (mRNA) levels were determined by quantitative reverse-transcription PCR (qRT-PCR) normalized to the amount of TATA box-binding protein (TBP) transcripts, displayed as hTERT/TBP ratios.
TRAP assay
TA was assessed by using the TRAP assay (TRAPeze RT telomerase detection kit; Chemicon) according to manufacturer’s instructions, with some modifications.
Lentiviral sh constructs and hTERT expression vectors
To inhibit telomerase subunit expression, 3 short hairpin RNA (shRNA) constructs, shTERC, shhTERT1, and shhTERT2, targeting hTERC or hTERT transcripts, respectively, and an shScramble (nontargeting) used as control, were cloned into pLK0.1-Puro (Addgene) vector at AgeI/EcoRI sites. To overexpress hTERT, two lentiviral constructs were cloned by inserting hTERT complementary DNA or DsRed2 (used as control) into two attB sites by gateway cloning in a lentivector backbone (hPGK/AttR sites/mPGK/Puro). For shRNA sequences, lentiviral production, and titration, refer to supplemental Data.
Cell proliferation assay
The day before the infection, cells were seeded at a density of 1.5 × 10⁵ cells per well into 12-well plates. Cells were then infected with lentiviruses for telomerase inhibition or overexpression, as described above. At 5 and 10 days after infection, cell proliferation was measured by a direct cell-counting assay.
Western blot
Western blot analysis was performed by following standard protocols. Membranes were hybridized with antibodies against hTERT (Millipore), Ki67 (Dako), and tubulin (Sigma-Aldrich). Proteins were visualized by enhanced chemiluminescence (GE Healthcare) and autoradiography, according to the manufacturer's instructions.
Senescence assay
Senescence markers p53, p21waf1, and γ-H2AX were analyzed by qRT-PCR and IF. p53 and p21waf1 were analyzed by qRT-PCR and γ-H2AX by IF, in 1301 and My-La cells in which telomerase expression was modulated (inhibition and overexpression).
Soft agar assay
For the soft agar assay, 50 000 cells (1301, My-La, Hut78, FE-PD) overexpressing hTERT or with telomerase inhibition (shTERC, shTERT1, and shTERT2) and their respective controls were put in 6-well plates in RPMI containing 10% fetal bovine serum and 0.45% agarose (overlay) on the top of an agarose underlay (RPMI + 10% fetal bovine serum and 0.75% agarose). Cells were fed twice a week with 500 µL of fresh RPMI medium, and the colonies (>8 cells) were counted after 2 weeks. Three different fields were scored from each well. The experiments were performed in triplicate, and the results were expressed as mean ± standard deviation. Significant difference (vs control) was determined by Student t test.
Xenografting of tumor cells in immunodeficient mice
A total of 1 × 10⁶ My-La cells overexpressing hTERT or infected with control vector were injected subcutaneously in NOD.Cg-Prkdcscid Il2rgtm1Wjl/SzJ mice. Tumor volume was measured twice a week over 20 days in 8 animals. Mayer’s hematoxylin labeling and CD3 immunohistochemistry were performed on mice tumor sections.
Statistical analysis
Data were analyzed according to the number of dependent variables and the nature of dependent and independent variables. The Shapiro-Wilk test was used to test the normality of our data. The Wilcoxon Mann-Whitney or the Friedman test was used for nonparametric statistical analysis. These tests were suitable for a sample number below 30. To remove outlier values, Dixon’s test was applied. The significance level was taken at P ≤ .05. The statistical tests were performed by using MedCalc software. More details on the methods can be found in the supplemental Data.
Results
Short TL in aggressive subtypes of primary CTCL
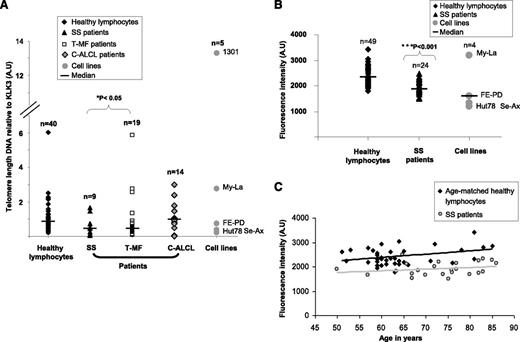
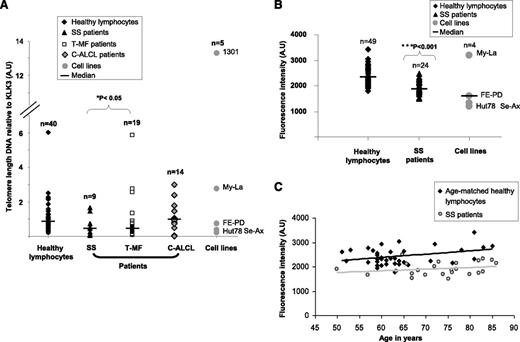
This study explored TL and telomerase status in CTCL subtypes. By using a qPCR assay, we found that in SS (P = .03) and T-MF (P = .04), two aggressive subtypes of CTCL, TL was shorter compared with that in healthy donors, whereas in C-ALCL, TL was similar to that of healthy donors used as controls (P = .75) (Figure 1). To strengthen this observation, SS patient cells and CTCL cell lines were investigated by using another TL assay. Hence, IQFISH validated the data previously obtained by qPCR. Indeed, SS patient tumor cells and CTCL cell lines had significantly shorter TL than cells from age-matched healthy donors (P = 2.61 × 10⁻⁷) (Figure 1). Patients with SS were elderly (mean age, 73 years), so we checked that their age was not the cause of telomere shrinkage (P = .58) (Figure 1).
Evaluation of relative TL in CTCL patients. (A) qPCR showed that TL was significantly shorter in SS and T-MF patient tumor cells than in healthy lymphocytes. C-ALCL patient tumor cells exhibited a TL similar to that in healthy lymphocytes. (B) IQFISH measurement confirmed that TL was shorter in SS blood samples than in healthy lymphocytes. (C) Graph shows that TL in SS blood samples was not influenced by older age in patients. TL was shorter in SS group than in age-matched controls. A.U, arbitrary units.
Evaluation of relative TL in CTCL patients. (A) qPCR showed that TL was significantly shorter in SS and T-MF patient tumor cells than in healthy lymphocytes. C-ALCL patient tumor cells exhibited a TL similar to that in healthy lymphocytes. (B) IQFISH measurement confirmed that TL was shorter in SS blood samples than in healthy lymphocytes. (C) Graph shows that TL in SS blood samples was not influenced by older age in patients. TL was shorter in SS group than in age-matched controls. A.U, arbitrary units.
Short TL: a hallmark of neoplastic SS cells
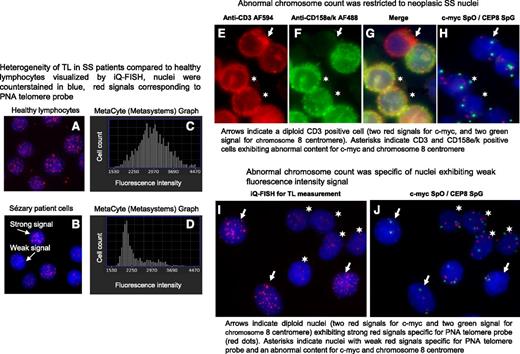
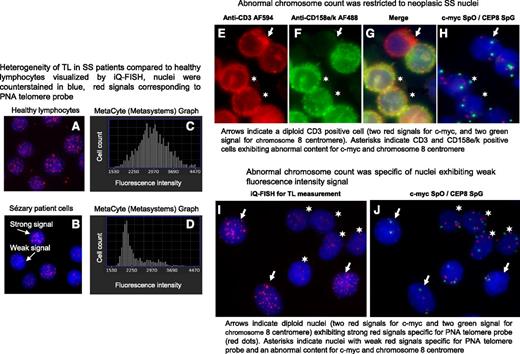
Metafer Metacyte analysis software allowed us to visualize cell nuclei and also to measure their fluorescence (Figure 2A-B) and to count nuclei with weak fluorescence (short telomeres) (Figure 2C-D) as well as neighborhood nuclei with strong fluorescence intensity (long telomeres) (Figure 2A-D). We observed that age-matched healthy donor nuclei consistently showed homogeneous fluorescence intensity signals within nuclei (Figure 2A) and a unimodal distribution of TL (Figure 2C), whereas nuclei from SS patients exhibited strong and weak fluorescence intensity signals (Figure 2B) associated with a bimodal distribution of TL (Figure 2D). We wondered whether a relationship between chromosomal content and TL could be established. To answer this question, genomic abnormalities were investigated in SS patient cells and cell lines, taking into consideration chromosome aberrations previously reported in SS patients by our group27 and others.23-26,28,29 For cases 2 and 17, AU (data not shown), c-MYC and centromere 8 fluorescent probes were chosen to investigate SS nuclei chromosomal status in combination with antibodies to delineate SS cells (Figure 2E-H) or with peptide nucleic acid telomeric probes to evaluate TL (Figure 2I-J). Image analysis revealed that abnormal chromosome content was restricted to both neoplastic SS T cells (Figure 2E-H) and to nuclei with short telomeres, whereas cells with normal chromosome content showed long telomeres (Figure 2I-J).
In SS patients, short TL was specific to tumor cells. A and B show nuclei hybridized with peptide nucleic acid (PNA) telomere probes labeled with Cy3 (red dots) and counterstained with 4′,6′-diamidino-2-phenylindole (DAPI) (blue). C and D show distribution of hybridized nuclei number according to their telomere fluorescence intensity values. (A) All nuclei from healthy lymphocytes exhibit a strong fluorescence signal for the telomeres and distribution was normal (C). (B) Two nuclei populations observed in SS patient cells: nuclei with strong fluorescence signals and nuclei with weak fluorescence signals and distribution was bimodal (D). (E-G) Neoplastic SS cells identified by using a double immunostaining detection procedure. (E) Cells were delineated with anti-CD3 AF594 and revealed by an anti-rabbit antibody conjugated with AlexaFluor 594 (AF594; red) and (F) with anti-CD158e/k revealed by an anti-mouse antibody conjugated with AlexaFluor 488 (AF488; green); (G) merged image. (H) Immunostaining detection was followed by a FISH investigation for the same cells using probes specific for c-myc and centromere 8 labeled with SpectrumOrange (SpO) (red spots) and SpectrumGreen (SpG) (green spots), respectively. (I-J) TL identified by using IQFISH followed by a FISH investigation into the same nuclei to reveal chromosome content. Images were acquired by using Isis software (MetaSystems); objective ×63.
In SS patients, short TL was specific to tumor cells. A and B show nuclei hybridized with peptide nucleic acid (PNA) telomere probes labeled with Cy3 (red dots) and counterstained with 4′,6′-diamidino-2-phenylindole (DAPI) (blue). C and D show distribution of hybridized nuclei number according to their telomere fluorescence intensity values. (A) All nuclei from healthy lymphocytes exhibit a strong fluorescence signal for the telomeres and distribution was normal (C). (B) Two nuclei populations observed in SS patient cells: nuclei with strong fluorescence signals and nuclei with weak fluorescence signals and distribution was bimodal (D). (E-G) Neoplastic SS cells identified by using a double immunostaining detection procedure. (E) Cells were delineated with anti-CD3 AF594 and revealed by an anti-rabbit antibody conjugated with AlexaFluor 594 (AF594; red) and (F) with anti-CD158e/k revealed by an anti-mouse antibody conjugated with AlexaFluor 488 (AF488; green); (G) merged image. (H) Immunostaining detection was followed by a FISH investigation for the same cells using probes specific for c-myc and centromere 8 labeled with SpectrumOrange (SpO) (red spots) and SpectrumGreen (SpG) (green spots), respectively. (I-J) TL identified by using IQFISH followed by a FISH investigation into the same nuclei to reveal chromosome content. Images were acquired by using Isis software (MetaSystems); objective ×63.
Diploid hTERT locus in SS patients
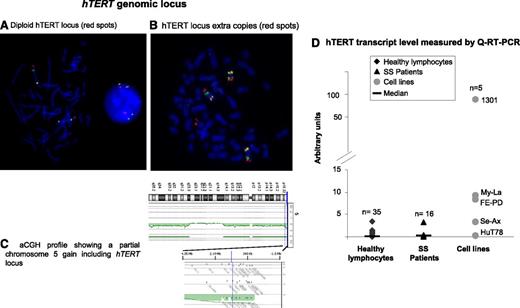
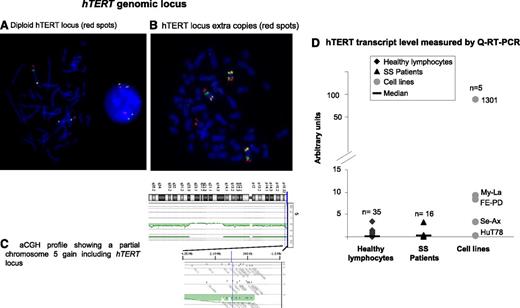
Investigation of the hTERT gene region at 5p15.3336 by FISH in 24 SS patients revealed that cells from 71% of patients (17/24) exhibited a diploid and nonrearranged hTERT status (Figure 3A). Numerical and structural alterations of the hTERT locus were rarely encountered in our series. Among the 7 cases (7/24) with an abnormal hTERT region (Figure 3B), only 2 cases presented a gain restricted to the hTERT locus. The other numerical abnormalities were due to the presence of whole or partial chromosome 5 gain (Figure 3C).
hTERT genomic locus and hTERT expression. (A-C) hTERT status. (A-B) FISH investigation used bacterial artificial chromosome (BAC) probes specific for hTERT labeled with SpectrumRed, 5p13.1 genomic region labeled with SpectrumGreen, and 5q31.2 genomic region labeled with SpectrumGold. (A) hTERT diploid nucleus and metaphase. (B) Metaphase with 3 copies of chromosome 5 and an extra signal for the hTERT locus. Images were acquired by using Isis software (MetaSystems); objective ×63. (C) Array comparative genomic hybridization (aCGH) profile shows that a partial gain of chromosome 5 included the hTERT locus. (D) Real-time qRT-PCR assay to evaluate hTERT mRNA level. Compared with healthy lymphocytes, SS cells showed a slight increase of hTERT transcripts, but this was not statistically significant (P = .29).
hTERT genomic locus and hTERT expression. (A-C) hTERT status. (A-B) FISH investigation used bacterial artificial chromosome (BAC) probes specific for hTERT labeled with SpectrumRed, 5p13.1 genomic region labeled with SpectrumGreen, and 5q31.2 genomic region labeled with SpectrumGold. (A) hTERT diploid nucleus and metaphase. (B) Metaphase with 3 copies of chromosome 5 and an extra signal for the hTERT locus. Images were acquired by using Isis software (MetaSystems); objective ×63. (C) Array comparative genomic hybridization (aCGH) profile shows that a partial gain of chromosome 5 included the hTERT locus. (D) Real-time qRT-PCR assay to evaluate hTERT mRNA level. Compared with healthy lymphocytes, SS cells showed a slight increase of hTERT transcripts, but this was not statistically significant (P = .29).
A slight increase in hTERT mRNA level in SS cells compared with cells from healthy donors
We studied hTERT mRNA levels in SS patient cells (n = 16), cell lines (n = 5), and healthy donors (n = 35) by using qRT-PCR (Figure 3D). We observed an increase in mRNA level in SS cells compared with cells from healthy donors, but this was not statistically significant (P = .29). All cell lines tested expressed hTERT mRNA except Hut78, an SS cell line. Interestingly, Se-Ax (the other SS cell line studied) also exhibited a lower hTERT mRNA level than T-MF and ALCL cell lines (Figure 3D).
Detection of TA in CTCL patient cells
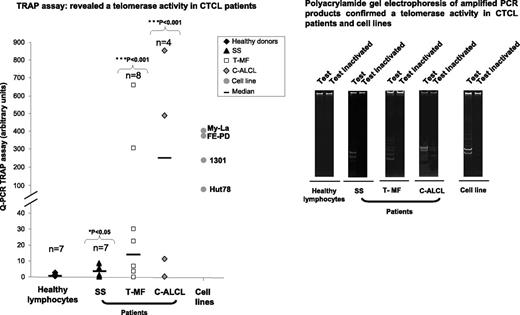
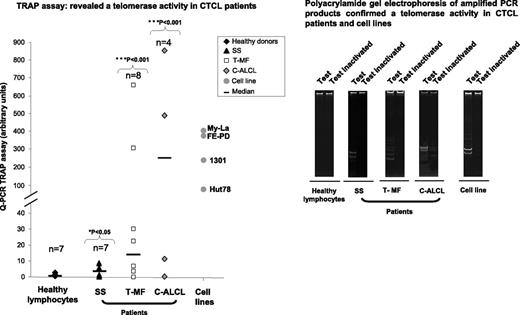
In contrast with healthy lymphocytes, TA was detected in CTCL patient cells (6/7 SS [P = .038], 6/8 T-MF [P = .001], and 3/4 C-ALCL [P = .016]) and in all cell lines (Hut78, My-La, FE-PD, and 1301) investigated (Figure 4). However, SS patient cells and the tested SS cell line Hut78 exhibited the lowest TA level compared with T-MF and C-ALCL patient cells and cell lines.
TA evaluated in CTCL patient cells and cell lines. In contrast with healthy lymphocytes, TA was detected in CTCL patient tumor cells (SS, T-MF, and C-ALCL) and in cell lines by using TRAPeze RT telomerase detection kit and was also confirmed by running amplified PCR products on polyacrylamide gel.
TA evaluated in CTCL patient cells and cell lines. In contrast with healthy lymphocytes, TA was detected in CTCL patient tumor cells (SS, T-MF, and C-ALCL) and in cell lines by using TRAPeze RT telomerase detection kit and was also confirmed by running amplified PCR products on polyacrylamide gel.
Involvement of TA in cell proliferation
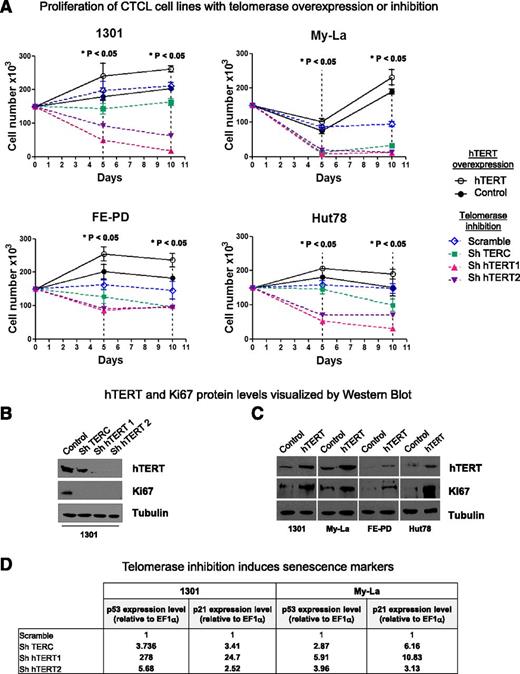
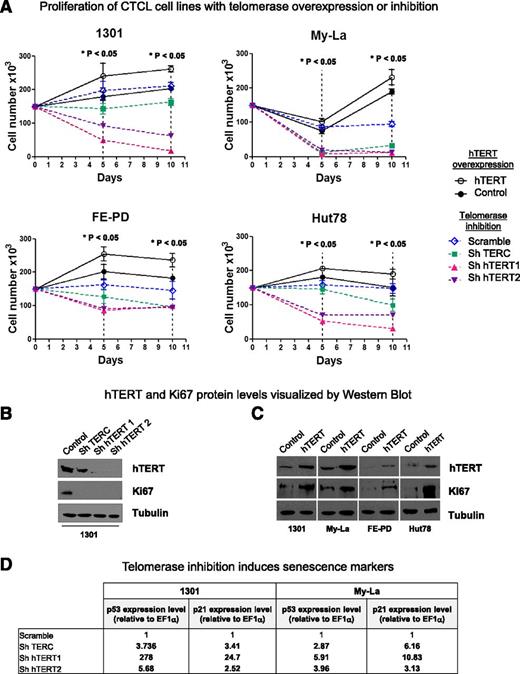
Three lentiviral shRNA vectors were constructed to inhibit telomerase expression: shTERC, shhTERT1, and shhTERT2. They were introduced into Hut78, My-La, FE-PD, and 1301 cell line nuclei. To enhance hTERT expression, a viral infection assay was used. Both control curves (Scramble and DsRed) were closed to each other. Whatever the cell line, telomerase inhibition led to a significant cell proliferation inhibition and to a massive cell death as early as 5 days after lentiviral transduction (P < .05) (Figure 5A, dotted lines). Moreover, in all cell lines tested, downregulation of hTERT (catalytic subunit of telomerase) had substantially more pronounced effects than downregulation of hTERC (the RNA template) at both 5 and 10 days after lentiviral transduction. Conversely, lentivirus-mediated hTERT overexpression led to a significant increase in cell proliferation (P < .05) (Figure 5A, solid lines).
hTERT in necessary for cell proliferation. (A) 1301, MyLa, FE-PD, and Hut78 cell line proliferation was determined by a direct cell-counting assay after viral infection for hTERT overexpression (DsRed used as control; solid lines) or for telomerase inhibition: shTERC, shhTERT1, and shhTERT2 vs Scramble (dotted lines). Nonparametric Friedman test *P < .05. (B-C) Expression of hTERT, Ki67, and tubulin were measured by western blot analysis after (B) 10 days of telomerase inhibition or (C) hTERT overexpression. (D) Telomerase inhibition induces senescence markers: p53 and p21 expression levels (relative to EF1α) were determined on 1301 and My-La cell lines by qRT-PCR after 6 days of viral infection. Gene-specific mRNA concentration in cells infected with shTERC or shhTERT1/2 (compared with cells infected with shScramble) was calculated by the 2–ΔΔCt method.
hTERT in necessary for cell proliferation. (A) 1301, MyLa, FE-PD, and Hut78 cell line proliferation was determined by a direct cell-counting assay after viral infection for hTERT overexpression (DsRed used as control; solid lines) or for telomerase inhibition: shTERC, shhTERT1, and shhTERT2 vs Scramble (dotted lines). Nonparametric Friedman test *P < .05. (B-C) Expression of hTERT, Ki67, and tubulin were measured by western blot analysis after (B) 10 days of telomerase inhibition or (C) hTERT overexpression. (D) Telomerase inhibition induces senescence markers: p53 and p21 expression levels (relative to EF1α) were determined on 1301 and My-La cell lines by qRT-PCR after 6 days of viral infection. Gene-specific mRNA concentration in cells infected with shTERC or shhTERT1/2 (compared with cells infected with shScramble) was calculated by the 2–ΔΔCt method.
hTERT silencing and ectopic expression were determined by using western blot analysis (Figure 5B-C). The impact of hTERT inhibition (Figure 5B) and overexpression (Figure 5C) on cell proliferation was confirmed by the detection of downregulation (Figure 5B) or upregulation (Figure 5C), respectively, of the Ki67 proliferation marker. We wondered whether TL was involved in the cell proliferation variations we observed upon modulation of telomerase expression. To test this hypothesis, we investigated the relative TL in the same cell lines by qPCR (supplemental Table 2). With only a short time for cell culture, no significant variation in TL was observed in cell lines.
Because 1301 and My-La cells expressed a higher hTERT endogenous level than Hut78 and FE-PD and strongly responded to hTERT inhibition, they were tested for senescence markers upon telomerase inhibition. Hence, telomerase inhibition led to upregulation of p53 and p21 mRNA levels (Figure 5D) and γ-H2AX staining (supplemental Figure 8).
Telomerase enhanced in vitro and in vivo tumor growth
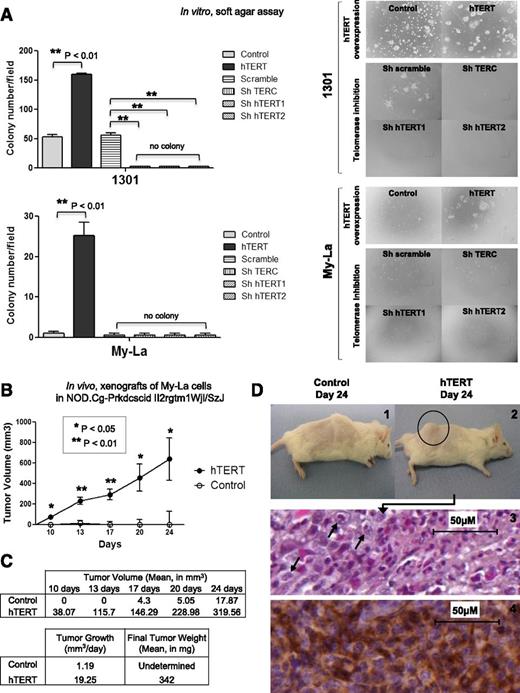
The above-mentioned data showed that hTERT played a significant role in CTCL cell proliferation. To further investigate the impact of this protein on the transformed properties in vitro, we used a soft agar clonogenicity assay with Hut78, FE-PD, My-La, and 1301 cells that overexpressed hTERT compared with control vector. While Hut78 and FE-PD cells did not form colonies in the tested conditions, control 1301 cells formed colonies, and the introduction of hTERT enhanced the colony formation potentiality (threefold increase). Control My-La cells were unable to form colonies, but they became able to form colonies (nearly 40 colonies per field) upon hTERT overexpression (Figure 6A). In contrast, telomerase inhibition impeded colony formation only in cells endogenously able to form colonies such as 1301.
Effects of telomerase variation on cell tumorigenicity. (A) Soft agar assays were performed for 1301, My-La, FE-PD, and Hut78 cells after viral infection for hTERT overexpression or telomerase inhibition. No colony formation could be observed for FE-PD and Hut78 cells. For 1301 and My-La cells, colonies (>8 cells) were counted in 3 different fields per well. Results were expressed as mean from experiments done in triplicate; vertical bars indicate standard deviation. Significant difference was based on Student t test (**P < .01) vs control (DsRed for hTERT overexpression, and Scramble for telomerase inhibition). (B) Graph shows tumor growth in NOD.Cg-Prkdcscid Il2rgtm1Wjl/SzJ mice implanted with My-La cells overexpressing hTERT or not (control). In all, 1 × 10⁶ cells were xenografted in 8 mice for each condition, and tumor size was measured twice a week for 24 days. Significant difference was based on Student t test (**P < .01) vs control. (C) Tumor growth (mm3 per day) and final tumor weight were determined at day 24. (D) In all hTERT conditions, visible tumors were detected (2) compared with control mice (1). MyLa cell–derived tumors were stained with Mayer’s hematoxylin (3), and immunohistochemistry identified T-cell staining for CD3 (4) (Dako Cytomation).
Effects of telomerase variation on cell tumorigenicity. (A) Soft agar assays were performed for 1301, My-La, FE-PD, and Hut78 cells after viral infection for hTERT overexpression or telomerase inhibition. No colony formation could be observed for FE-PD and Hut78 cells. For 1301 and My-La cells, colonies (>8 cells) were counted in 3 different fields per well. Results were expressed as mean from experiments done in triplicate; vertical bars indicate standard deviation. Significant difference was based on Student t test (**P < .01) vs control (DsRed for hTERT overexpression, and Scramble for telomerase inhibition). (B) Graph shows tumor growth in NOD.Cg-Prkdcscid Il2rgtm1Wjl/SzJ mice implanted with My-La cells overexpressing hTERT or not (control). In all, 1 × 10⁶ cells were xenografted in 8 mice for each condition, and tumor size was measured twice a week for 24 days. Significant difference was based on Student t test (**P < .01) vs control. (C) Tumor growth (mm3 per day) and final tumor weight were determined at day 24. (D) In all hTERT conditions, visible tumors were detected (2) compared with control mice (1). MyLa cell–derived tumors were stained with Mayer’s hematoxylin (3), and immunohistochemistry identified T-cell staining for CD3 (4) (Dako Cytomation).
On the basis of our observations concerning the role of hTERT on in vitro proliferation, survival, and clonogenicity, we investigated its effects on the in vivo tumorigenic properties of My-La, a CTCL cell line, in immunodeficient mice. My-La cells that did or did not overexpress hTERT (control vector vs hTERT vector) were xenografted into NOD.Cg-Prkdcscid Il2rgtm1Wjl/SzJ mice (Figure 6B). Tumor formation was clearly detected as early as 10 days following the inoculation of My-La cells. We observed a major impact on tumor development induced by ectopic hTERT expression. Indeed, in all mice grafted with hTERT overexpressing My-La cells, both tumor volume (Figure 6B) and weight (Figure 6C) were strongly increased compared with mice grafted with control My-La cells, which barely developed tumors in the tested conditions.
Tumor measurement and weight demonstrated an impressive tumor growth (Figure 6D-2 compared with Figure 6D-1) of 19.25 mm3 per day when hTERT was overexpressed compared with control (1.19 mm3 per day). Histologic sections from My-La cell–derived tumors showed a large number of mitotic cells when hTERT was overexpressed (Figure 6D-3) whereas in control mice, tumors were undetectable. The positive CD3 labeling showed that tumors were composed of T cells (Figure 6D-4).
Discussion
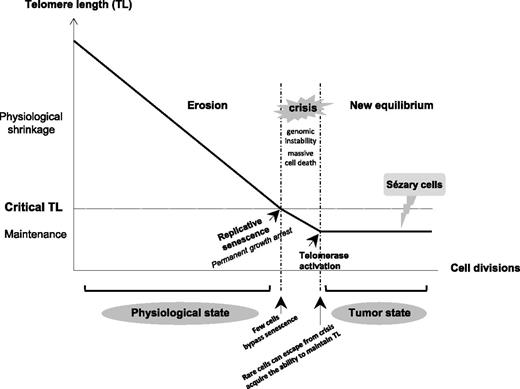
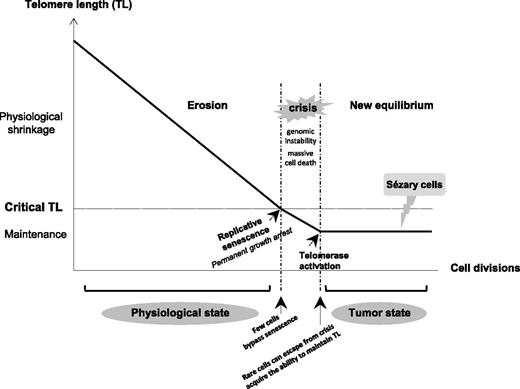
In aggressive subtypes of CTCL, T-MF, and SS, TL was shorter than in healthy donor lymphocytes and in a CTCL subtype associated with good prognosis (C-ALCL). The CTCL cell lines Hut78, Se-Ax, FE-PD, and to a lesser extent My-La, showed a TL that matched that of their corresponding lymphoma subtype of origin. In agreement with our observations, telomere erosion was associated with disease progression and aggressiveness as well as chromosome abnormalities in human tumors.11,37-39 Indeed, data from our group22,27 and from others23-26,28,29,40-43 showed the presence of more complex chromosome aberrations in aggressive CTCL than in C-ALCL.28,44 When telomeres become critically short, it is believed that their protective function is compromised and that cells follow the flow diagram process (Figure 7) with replicative senescence, crisis, escape from crisis, and maintenance of TL.45 Our data support this theoretical process and also suggest that aggressive CTCLs are passed-over crisis cells. Furthermore, we demonstrated here that short telomeres are restricted to neoplastic T cells, especially in SS cells. This critical point in elderly patients was not previously addressed by the rare investigations of telomere status in patients with CTCL.18-20
Diagram of TL variation according to cell division in somatic cells from physiologic to tumor state. Due to the end-replication problem in most somatic cells, loss of telomeric sequences occurs during each cell division, resulting in the gradual and predictable erosion of telomeres. When TL becomes critically short, it is believed that the telomere’s protective function is compromised. Dysfunctional telomeres are recognized as damaged DNA, which triggers a permanent growth arrest known as replicative senescence. Occasionally, cells acquire mutations (in checkpoint genes such as p53 and p16) that bypass senescence and continue to proliferate, driving further telomere erosion and culminating in a period of massive cell death and genomic instability that is termed crisis. Rare cells can escape from crisis and acquire the ability to maintain their TL, mostly by reactivating telomerase. Short telomeres associated with complex numerous chromosome aberrations and a TA seem to support that SS cells are passed-over crisis cells that have an aptitude for proliferating without limit.
Diagram of TL variation according to cell division in somatic cells from physiologic to tumor state. Due to the end-replication problem in most somatic cells, loss of telomeric sequences occurs during each cell division, resulting in the gradual and predictable erosion of telomeres. When TL becomes critically short, it is believed that the telomere’s protective function is compromised. Dysfunctional telomeres are recognized as damaged DNA, which triggers a permanent growth arrest known as replicative senescence. Occasionally, cells acquire mutations (in checkpoint genes such as p53 and p16) that bypass senescence and continue to proliferate, driving further telomere erosion and culminating in a period of massive cell death and genomic instability that is termed crisis. Rare cells can escape from crisis and acquire the ability to maintain their TL, mostly by reactivating telomerase. Short telomeres associated with complex numerous chromosome aberrations and a TA seem to support that SS cells are passed-over crisis cells that have an aptitude for proliferating without limit.
Because the ability to maintain TL is accomplished by activating telomerase in most tumor cells,8-10 we investigated the status of the catalytic subunit of the human telomerase hTERT in SS patient cells. The vast majority of SS cells displayed a diploid hTERT locus and presented a low level of hTERT expression. This low level of hTERT mRNA was associated with TA and short telomeres in SS cells. This suggests that low levels of hTERT transcripts are sufficient to account for basal TA and to maintain functional short telomeres. This could represent an Achilles’ heel of such tumor cells since inhibition of hTERT alone led to a drastic drop in TA in SS cell lines. Moreover, TA in SS patient cells seemed to be correlated with the percentage of SS cells in S phase of the cell cycle (data not shown). A putative link between cell proliferation and TA was previously reported in primary human mammary epithelial cells.46,47 By using an extensive panel of hTERT mutants, Mukherjee et al47 were able to decipher the diversity of biologic functions attributed to hTERT. They demonstrated that the ability of hTERT to enhance cell proliferation required hTERT catalytic activity but was uncoupled from telomere elongation. While these elegant observations were made in cultured human mammary epithelial cells, our study directly addressed the association between hTERT expression and cell proliferation in SS cells.
To further investigate hTERT function in CTCL, we inhibited hTERT activity in cell lines (Hut78, My-La, FE-PD, and 1301) by using hTERT shRNA constructs. The inhibition of hTERT led to a drastic reduction of proliferation, which was associated with activation of senescence markers, and drove rapidly to cell death, emphasizing the role of telomerase in cell proliferation and survival. This was also observed by inhibition of TERC expression, the RNA component of telomerase. Nonetheless, the cell proliferation defect was more pronounced when inhibiting the hTERT catalytic component than when inhibiting the TERC RNA component, suggesting that hTERT may exert TERC-independent effects on cell proliferation. In contrast, enhanced hTERT expression led to an increase of cell proliferation. Changes in cell proliferation occurred without measureable variations in TL, suggesting that telomerase could regulate cell proliferation independently of its roles in telomeres, as reported recently.48 The cell cycle distribution of CTCL cell lines, with and without telomerase, was not significantly altered, but cells overexpressing hTERT progressed more quickly through the cell cycle (data not shown). In addition, since hTERT inhibition led to cell death, we focused on the impact of hTERT overexpression on tumorigenicity both in vitro by using a soft agar clonogenicity assay and in vivo by using xenografts in immunodeficient mice. Upregulation of hTERT in 1301 and My-La cells significantly enhanced colony formation capacity as well as tumor development. This tumor formation was clearly detectable as early as 10 days after inoculating immunodeficient mice with My-La overexpressing hTERT. At the end of the experiment, large tumors were observed with cells overexpressing hTERT (mean weight, 342 mg), whereas no tumor was detectable in mice grafted with control cells.
In summary, this study showed that aggressive CTCL subtypes exhibited short telomeres. This consistent short length was restricted to neoplastic T cells. We observed that CTCL cells were telomerase positive. In these cells, we assumed that telomerase expression could be involved in maintaining functional telomeres. Beyond this role, telomerase might exert functions on proliferation and tumorigenicity in vitro and in vivo, as shown by proliferation and soft agar assays and xenografts in immunodeficient mice. Further investigations are necessary to improve our knowledge of the molecular pathways implicated in these additional telomerase functions. Nevertheless, the data presented here adds an appealing perspective for the development of treatment targeting telomerase functions in such lymphomas, especially in aggressive CTCL cells.
The online version of this article contains a data supplement.
The publication costs of this article were defrayed in part by page charge payment. Therefore, and solely to indicate this fact, this article is hereby marked “advertisement” in accordance with 18 USC section 1734.
Acknowledgments
The authors are very grateful to B. Rousseau, Animalerie A2 Université Bordeaux, for helping with tumor measurements and to A. Giese, histology platform Cancéropole Grand Sud Ouest-Site de Recherche Intégrée sur le Cancer (SIRIC) Bordeaux Recherche Intégrée en Oncologie (BRIO) for technical assistance (Bordeaux, France). The authors thank Dr Canamero, Centro Nacional de Investigaciones Oncológicas (Madrid, Spain) and Dr Segal-Bendirdjian, Institut National de la Santé et de la Recherche Médicale UMR-S 1007 (Paris, France) for their advice regarding hTERT antibodies, Dr Vial for providing the CD158e/K antibody (Centre Hospitalier Universitaire [CHU] Bordeaux, France), Dr V. Gire for her kind support (Unité mixte de recherche 5237, Montpellier, France), Dr R. M’kacher for helpful discussion (Commissariat à l'énergie atomique, Direction des Sciences du Vivant/Institut de radiobiologie cellulaire et moléculaire, Fontenay aux Roses, France), and Dr. C Bedichaud, Etablissement Français Du Sang Bordeaux (France). The authors also thank C. Martin for secretarial assistance, the volunteer blood donors, and the tumor bank (CHU Bordeaux).
This work was supported by grants from Société Française de Dermatologie, Ligue Contre le Cancer, Conseil Regional d’Aquitaine (No. 20081302003), Caractérisation des Anomalies Cytogénétiques des Lymphomes T cutanés par obtention de xénogreffes, CHU Bordeaux, and SIRIC BRIO. Lentiviral vectors production was conducted in the P3 facility, Bergonié Institute (Bordeaux, France). L. A. was supported by Programme Hospitalier de Recherche Clinique Essai multicentrique de phase II évaluant le bénéfice thérapeutique du lenalidomide (Revlimid) dans les lymphomes cutanés primitifs B diffus à grandes cellules “type-jambe” en rechute ou réfractaires à un traitement initial associant Rituximab et polychimiothérapie, Centre Hospitalier Universitaire Bordeaux 2011/28-REV-LEG.
Authorship
Contribution: E.C. conceived and designed the study, performed IQFISH experiments, DNA extractions, and cell culture, analyzed and interpreted the data, and wrote the manuscript; L.A. performed lentiviral, western blot, soft agar, and xenografts experiments; M.P.-C. performed immunostaining, FISH experiments, slide scanning, and quantitative image analysis as well as statistical analysis; J.F. performed qPCR analysis, TRAP assay, and RNA and protein extractions with Y.I.; D.C. designed qPCR primers and analyzed qPCR data; E.L. performed and analyzed array comparative genomic hybridization experiments; A.B. and J.F. performed qPCR analysis; W.S. and E.C. performed IQFISH; F.R. and M.P.-C. performed hTERT FISH experiments; A.P.-L., B.V., and M.B.-B. provided CTCL patients; A.P.-L. and M.B.-B. provided patient samples and clinical data; F.B. performed cell cycle analysis; P.D. participated in the design of the study and data interpretation; J.-P.M. supervised all the research; and L.A., M.P.-C., D.C., P.D., M.B.-B., and J.-P.M. assisted in writing the manuscript.
Conflict-of-interest disclosure: The authors declare no competing financial interests.
Correspondence: Edith Chevret, Histologie et pathologie moléculaire des tumeurs, EA 2406, Université Bordeaux, 146 Rue Leo Saignat, 33076 Bordeaux, France; e-mail: edith.chevret@u-bordeaux2.fr.
References
Author notes
L.A., M.P.-C., and J.F. contributed equally to this study.

