Key Points
Rcor1 knockout mice show a block in fetal erythropoiesis at the proerythroblast stage.
Rcor1 represses expression of HSCs and myeloid genes during erythropoiesis, including Csf2rb, which is important in myeloid function.
Abstract
The corepressor Rcor1 has been linked biochemically to hematopoiesis, but its function in vivo remains unknown. We show that mice deleted for Rcor1 are profoundly anemic and die in late gestation. Definitive erythroid cells from mutant mice arrest at the transition from proerythroblast to basophilic erythroblast. Remarkably, Rcor1 null erythroid progenitors cultured in vitro form myeloid colonies instead of erythroid colonies. The mutant proerythroblasts also aberrantly express genes of the myeloid lineage as well as genes typical of hematopoietic stem cells (HSCs) and/or progenitor cells. The colony-stimulating factor 2 receptor β subunit (Csf2rb), which codes for a receptor implicated in myeloid cytokine signaling, is a direct target for both Rcor1 and the transcription repressor Gfi1b in erythroid cells. In the absence of Rcor1, the Csf2rb gene is highly induced, and Rcor1−/− progenitors exhibit CSF2-dependent phospho-Stat5 hypersensitivity. Blocking this pathway can partially reduce myeloid colony formation by Rcor1-deficient erythroid progenitors. Thus, Rcor1 promotes erythropoiesis by repressing HSC and/or progenitor genes, as well as the genes and signaling pathways that lead to myeloid cell fate.
Introduction
Histone modifications and their deregulation have been implicated in many hematologic disorders, including severe anemia, myelodysplastic disorders, and leukemias.1,2 Furthermore, inhibitors of the enzymes that catalyze histone modifications, histone deacetylases (HDACs) and demethylases, have been used in the clinic.1 For this reason, considerable effort has been invested in determining the roles of chromatin modifiers throughout hematopoiesis. The specificity of these modifiers, however, is conferred by transcription factors and their cofactors.
A predominant cofactor in cells is Rcor1 (also called CoREST). Rcor1 is present in complexes containing several chromatin modifiers associated with transcriptional repression, including the histone 3 lysine 4 demethylase Kdm1a which binds to Rcor1 directly,3 and HDACs.4,5 Proteins with chromatin binding properties, such as the high mobility group protein 20b (Hmg20b), are also present.6 A potential role for Rcor1 in red blood cell (RBC) development has been suggested by the interaction of Rcor1 and Kdm1a with Gfi1b,7 a member of the Gfi zinc finger transcriptional repressors, which is essential for erythropoiesis.8 However, in Kdm1a knockout mice, erythropoiesis is impaired,9 but knockdown of another Rcor1 cofactor, Hmg20b, promotes terminal differentiation of both a mouse fetal liver cell line (I/11) and primary fetal liver proerythroblasts.10 Similarly, HDACs both inhibit the growth of early erythroid precursors and promote erythropoietin-mediated differentiation and survival of erythroid precursors.11 These seemingly contradictory results likely reflect recruitment of the histone-modifying enzymes through different corepressors. To begin to dissect this complexity, we have determined the role of Rcor1 function in vivo.
Materials and methods
Mice
Rcor1flox/+ mice were generated by Ozgene, Inc (details are provided in supplemental data available at the Blood Web site ) and crossed to Meox2-Cre transgenic mice (The Jackson Laboratory, #003755) to create Rcor1+/− mice. Rcor1flox/+ and Rcor1+/− mice were backcrossed with C57BL/6J mice for at least 10 generations. Mx1-Cre mice (The Jackson Laboratory, #003556) were used to generate Mx1-Cre; Rcor1flox/– embryos. The primers A3 (5′-atttgtgtcatgtgtcatgta-3′) and B2 (5′-gggaagctcatctataggcaa-3′) were used to distinguish Rcor1+ (1.1 kb) and Rcor1– alleles (350 bp). The primers A2 (5′-gtagttgtcttcagacactcc-3′) and B2 were used to distinguish Rcor1flox (550 bp) and Rcor1+ alleles (400 bp).
Flow cytometry analysis and cell sorting
Cells from mechanically dissociated E13.5-E15.5 fetal livers were pre-incubated with mouse Fc block, stained with CD71-fluorescein isothiocyanate, TER119-phycoerythrin (PE) and propidium iodide and either analyzed with an LSRII (BD Biosciences), or sorted with an Influx cell sorter (BD Biosciences) for making RNA sequencing (RNA-Seq) libraries. To isolate R1 (Lineage–, CD71low) and R2 (Lineage–, CD71hi) cells for colony-forming assays, cells were stained with CD71-fluorescein isothiocyanate, a lineage cocktail (TER119, Gr1, Mac1, B220, CD3, CD4, and CD8)-PE and propidium iodide and sorted with an Influx cell sorter. Csf2rb expression was detected by using CD131-PE. Data were analyzed by using FlowJo (Tree Star, Inc.). For antibody clone information, see supplemental data.
In vitro colony-forming assay
R1 and R2 cells sorted by fluorescence-activated cell sorter (FACS) were plated in mouse methylcellulose complete medium (HSC007; R&D Systems). Mouse interferon alfa (IFN-α) (R&D Systems), and Jak2 inhibitor TG101384 (Selleckchem) were used at 1000 U/mL and 500 nM, respectively.
RNA-Seq and computational analysis
R2 cells from E13.5 fetal livers were sorted directly into TRIzol LS (Invitrogen); 2 μg total RNA from pooled samples was used to make 1 Illumina-compatible indexed library using the Illumina mRNA-Seq Sample Preparation Kit. Four libraries (2 biologic replicates each for control and mutant) were mixed at equal concentration and sequenced by an Illumina HiSequation 2000 using version 3 sequencing reagents at the Genomics Core Facility (University of Oregon).
An in-house, open-source pipeline for RNA-Seq was used (details in supplemental data). Differential expression analysis of uniquely mapped reads at the gene level was conducted via linear modeling in edgeR, and all P values were false discovery rate adjusted. Genes used for gene set enrichment analysis (GSEA) were selected on the basis of fold change and tag counts. Genes with (mutant/control) >2 or <0.5 and an false discovery rate–adjusted P value < .05 were further evaluated for tag counts. For tag count evaluation, the total reads from each library were adjusted to that of the library with the smallest total number of reads. To minimize the influence of genes with extremely low expression levels, only genes with a difference of >50 adjusted reads between genotypes were used for GSEA.
Accession number
The Gene Expression Omnibus (GEO) accession number for all unpublished gene expression data is GSE50708.
Chromatin immunoprecipitation analysis
MEL-745A cl. DS19 cells were provided by Stuart Orkin and maintained in Dulbecco’s modified Eagle medium with 10% fetal calf serum, 1% penicillin-streptomycin (Pen/Strep), and 1% l-glutamine.
Chromatin immunoprecipitation (ChIP) analyses were performed as described.12 Briefly, chromatin from 1 × 10⁷ mouse erythroleukemia (MEL) cells, 5 × 10⁶ control R2 fetal liver cells, or 5 × 10⁶ mutant fetal liver cells was immunoprecipitated overnight at 4°C using 5 μg Rcor1 antibody13 or Gfi1b antibody (D-19; Santa Cruz Biotechnology). After reversal of cross-links, samples were purified by using Qiagen columns. Qantitative polymerase chain reaction (qPCR) primers are shown in supplemental Table 5. ChIP DNA was quantified with a standard curve and normalized to the input DNA.
Statistical analysis
Statistical comparisons between 2 samples were made by using Student t tests. Multiple-group comparisons were analyzed by a 1-way analysis of variance with a Newman-Keuls post hoc test in Prism 6 (GraphPad Software). Two-way analysis of variance was used for matched colony-forming unit (CFU) analyses within genotypes treated with and without TG101348.
Results
Disruption of the Rcor1 gene causes embryonic lethality
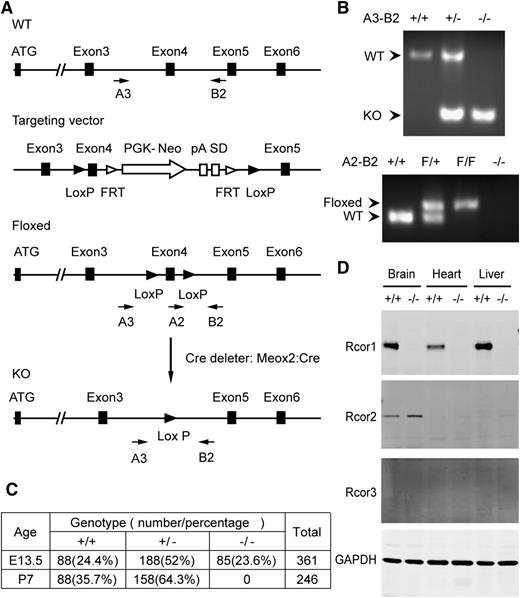
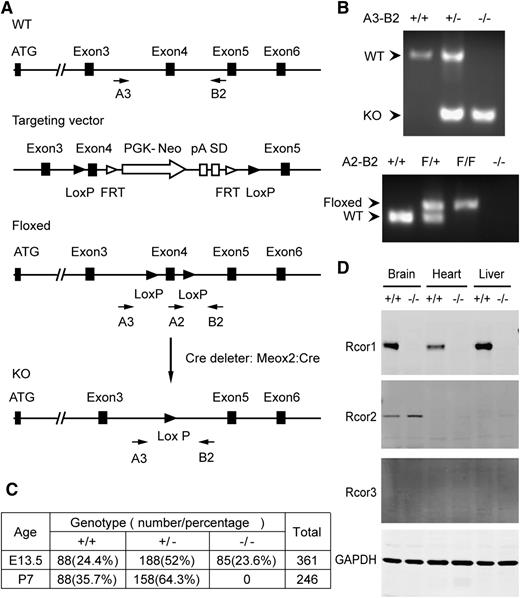
We generated Rcor1flox/+ mice in which Cre-mediated recombination will delete exon 4 and introduce a premature stop codon (Figure 1A-B). We used the Meox2-Cre deleter strain14 to generate mice carrying the germline Rcor1– allele. The resulting Rcor1+/− mice, after genetic removal of the Cre transgene, appeared normal and fertile. Intercrosses of Rcor1+/− mice showed that Rcor1−/− embryos were present at the expected Mendelian ratios at E13.5, but no viable Rcor1−/− offspring survived to P7 (Figure 1C). By E15.5, almost all mutant embryos were severely edematous, and by E16.5, ∼75% of mutant embryos were dead. Importantly, no Rcor1 protein was detected in the Rcor1−/− embryos (Figure 1D), suggesting that the loss of Rcor1 resulted in embryonic lethality.
Targeted disruption of murine Rcor1 results in embryonic lethality. (A) Gene targeting strategy for the Rcor1 locus: schematic representation of the wild-type (WT) Rcor1+ allele, targeting vector, Rcor1flox allele (Floxed), and mutant Rcor1– allele (KO). Rcor1flox/+ mice were crossed with Meox2-Cre and subsequently outcrossed to obtain Rcor1+/− mice. Arrows indicate positions of the A3, A2, and B2 genotyping primers. (B) Top panel: PCR analysis with primers A3 and B2 to resolve WT and mutant Rcor1 alleles (KO) in E13.5 embryos. Bottom panel: PCR analysis with primers A2 and B2 to resolve WT and floxed (F) Rcor1 allele in E13.5 embryos. (C) Genotypes resulting from Rcor1 heterozygote matings. (D) Western blot analysis showing the expression levels of Rcor1, -2, and -3 proteins in different tissues of E13.5 WT and KO embryos. FRT, flippase recognition target sites; GAPDH, loading control; pA, polyadenylation site; PGK-Neo, neomycin resistance cassette; SD, splice donor.
Targeted disruption of murine Rcor1 results in embryonic lethality. (A) Gene targeting strategy for the Rcor1 locus: schematic representation of the wild-type (WT) Rcor1+ allele, targeting vector, Rcor1flox allele (Floxed), and mutant Rcor1– allele (KO). Rcor1flox/+ mice were crossed with Meox2-Cre and subsequently outcrossed to obtain Rcor1+/− mice. Arrows indicate positions of the A3, A2, and B2 genotyping primers. (B) Top panel: PCR analysis with primers A3 and B2 to resolve WT and mutant Rcor1 alleles (KO) in E13.5 embryos. Bottom panel: PCR analysis with primers A2 and B2 to resolve WT and floxed (F) Rcor1 allele in E13.5 embryos. (C) Genotypes resulting from Rcor1 heterozygote matings. (D) Western blot analysis showing the expression levels of Rcor1, -2, and -3 proteins in different tissues of E13.5 WT and KO embryos. FRT, flippase recognition target sites; GAPDH, loading control; pA, polyadenylation site; PGK-Neo, neomycin resistance cassette; SD, splice donor.
Rcor1−/− embryos die because of a defect in definitive erythropoiesis
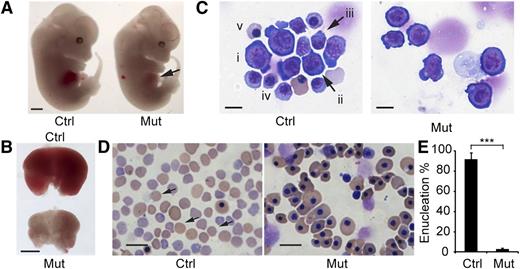
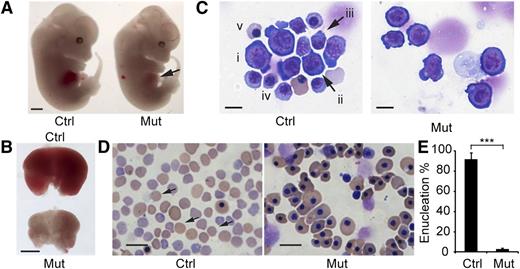
Between E13.5 and E16.5, the fetal liver is the major site of definitive erythropoiesis15 and mainly contains nucleated erythropoietic precursors. Beginning at E13.5, the mutant embryos exhibited pale livers (Figure 2A-B). Although embryo size was not significantly different among genotypes, the Rcor1−/− fetal livers were much smaller (Figure 2B), with 72% fewer cells than those of control littermates (Rcor1+/+: 9.9 ± 0.74 × 10⁶ cells per liver; Rcor1+/−: 9.14 ± 2.89 × 10⁶ cells per liver; Rcor1−/−: 2.77 ± 0.71 × 10⁶ cells per liver). Because no significant differences between Rcor1+/+ and Rcor1+/− embryos were measured in any experiments, we refer to them collectively as control. Mutant fetal livers contained primarily early erythroblasts, whereas control fetal livers contained cells at all different stages of erythropoiesis (Figure 2C). Likewise, E15.5 mutant peripheral blood lacked mature, enucleated RBCs (Figure 2D), whereas control peripheral blood contained more than 90% enucleated RBCs (Figure 2E). No other overt morphologic changes were observed. Thus, we attributed the lethality in Rcor1−/− embryos to defects in definitive erythropoiesis.
Rcor1 null embryos exhibit defective embryonic erythropoiesis. (A) E13.5 control (Ctrl) and mutant (Mut) littermates. Note pale liver in mutant (arrow). Scale bar: 1 mm. (B) Comparison of E13.5 control and mutant fetal livers. The mutant fetal liver is smaller and paler than the control fetal liver. Scale bar: 1 mm. (C) May-Grunwald Giemsa staining of E13.5 fetal liver cytospin preparations. The control liver contains early erythroid progenitors (i: BFU-E or CFU-E like cells; ii: proerythroblast) and late erythroid precursors (iii: early basophilic erythroblast; iv: late basophilic erythroblast; v: orthochromatophilic erythroblast). The mutant fetal liver contains primarily early-stage erythroid progenitors. Scale bar: 10 μm. (D) May-Grunwald Giemsa staining of E15.5 peripheral blood smears showing enucleated definitive erythrocytes (arrow) in the control that are lacking in the mutant. In the mutant, nearly all the circulating blood cells are primitive wave erythroid cells of normal appearance. Scale bar: 20 μm. (E) Mean of enucleated RBC frequency in control (n = 5) and mutant (n = 3) E15.5 peripheral blood. Error bars show standard deviation (SD). ***P < .001. Images for (A-B) were taken with a Zeiss SteREO Lumar.V12 microscope, a Neo-Lumar S ×0.8 FWD 80-mm objective and an AxioCam HRc camera. Images for (C-D) were acquired with a Zeiss Axiovert S-100 (Carl Zeiss), an AxioCam HRc camera, and either (C) a Zeiss plan-neofluar ×100/1.30 oil lens or (D) a Zeiss plan-neofluar ×40/1.30 oil lens.
Rcor1 null embryos exhibit defective embryonic erythropoiesis. (A) E13.5 control (Ctrl) and mutant (Mut) littermates. Note pale liver in mutant (arrow). Scale bar: 1 mm. (B) Comparison of E13.5 control and mutant fetal livers. The mutant fetal liver is smaller and paler than the control fetal liver. Scale bar: 1 mm. (C) May-Grunwald Giemsa staining of E13.5 fetal liver cytospin preparations. The control liver contains early erythroid progenitors (i: BFU-E or CFU-E like cells; ii: proerythroblast) and late erythroid precursors (iii: early basophilic erythroblast; iv: late basophilic erythroblast; v: orthochromatophilic erythroblast). The mutant fetal liver contains primarily early-stage erythroid progenitors. Scale bar: 10 μm. (D) May-Grunwald Giemsa staining of E15.5 peripheral blood smears showing enucleated definitive erythrocytes (arrow) in the control that are lacking in the mutant. In the mutant, nearly all the circulating blood cells are primitive wave erythroid cells of normal appearance. Scale bar: 20 μm. (E) Mean of enucleated RBC frequency in control (n = 5) and mutant (n = 3) E15.5 peripheral blood. Error bars show standard deviation (SD). ***P < .001. Images for (A-B) were taken with a Zeiss SteREO Lumar.V12 microscope, a Neo-Lumar S ×0.8 FWD 80-mm objective and an AxioCam HRc camera. Images for (C-D) were acquired with a Zeiss Axiovert S-100 (Carl Zeiss), an AxioCam HRc camera, and either (C) a Zeiss plan-neofluar ×100/1.30 oil lens or (D) a Zeiss plan-neofluar ×40/1.30 oil lens.
Rcor1 is required for the transition from proerythroblast to basophilic erythroblast
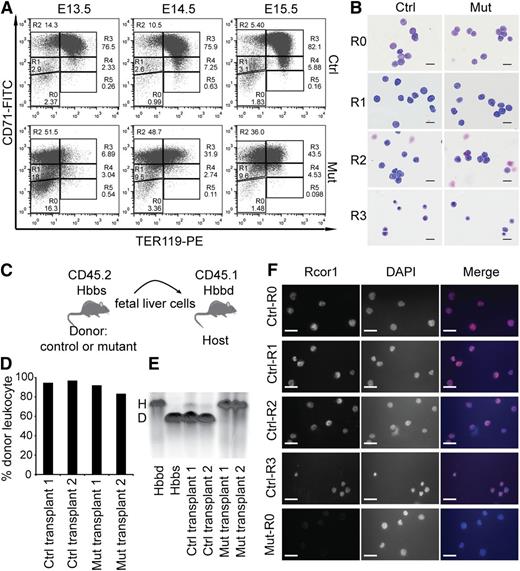
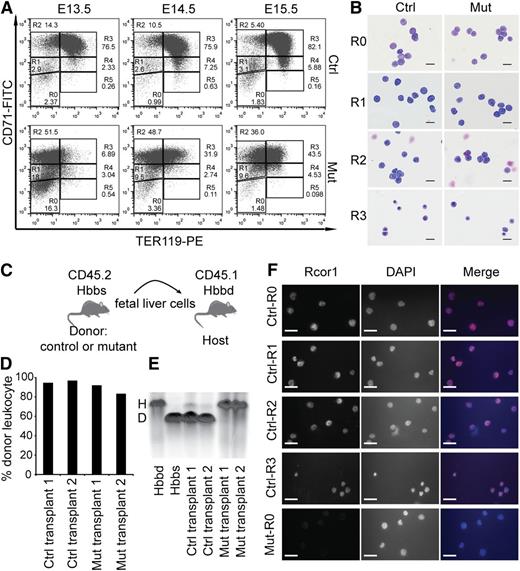
To identify which stage of erythropoiesis was affected in the Rcor1−/− mice, we performed flow cytometry analysis of CD71 and TER11916 markers on fetal liver cells (Figure 3A). By E14.5, most control cells progressed through the proerythroblast stage (R2) to the basophilic, chromatophilic, and orthochromatophilic erythroblast stages (R3 and R4). In contrast, most mutant liver cells were arrested at the proerythroblast stage (R2 to R3).
Erythropoietic differentiation in Rcor1 knockout mice is blocked at the transition from proerythroblast to basophilic erythroblast. (A) Flow cytometry profiles of fetal liver cells stained with CD71 and TER119. R0-R5: Gates of different erythroblast populations according to their expression levels of CD71 and TER119. R0 contains mixed populations of hematopoietic stem cell (HSC) and early progenitors, such as CMP, GMP, and MEP; R1 consists of mostly immature RBC progenitors, including BFU-E and CFU-E; R2 comprises mainly proerythroblasts and early basophilic erythroblasts; R3 contains early and late basophilic erythroblasts; R4 is composed of chromatophilic and orthochromatophilic erythroblasts; and R5 contains late orthochromatophilic erythroblasts and reticulocytes. Note that the transition from R2 to R3 is arrested in the mutant fetal liver. (B) May-Grunwald Giemsa staining showing similar morphology of FACS-sorted mutant and control E14.5 fetal liver cells. Scale bar: 20 μm. (C) Schematic diagram showing transplant of fetal liver cells that express CD45.2 and β-globin haplotype Hbbs (donor) into irradiated mice double congenic for CD45.1 and β-globin haplotype Hbbd (host). (D) Donor cell contribution to circulating leukocytes of adult WT mice transplanted with 2 million E13.5 mutant or control fetal liver cells. (E) Hemoglobin electrophoresis analysis indicates that mutant fetal liver cells cannot generate RBCs after transplantation into WT adult mice. (F) Immunostaining for Rcor1 protein in FACS-sorted E14.5 fetal liver cells. Mutant R0 cells serve as a negative control (NC). Nuclei labeled with 4′,6 diamidino-2-phenylindole (DAPI). Scale bar: 20 μm. Images in this figure were acquired with a Zeiss Axiovert S-100, a Zeiss plan-neofluar ×63/1.25 oil lens, and an AxioCam HRc camera. D, donor; H, host.
Erythropoietic differentiation in Rcor1 knockout mice is blocked at the transition from proerythroblast to basophilic erythroblast. (A) Flow cytometry profiles of fetal liver cells stained with CD71 and TER119. R0-R5: Gates of different erythroblast populations according to their expression levels of CD71 and TER119. R0 contains mixed populations of hematopoietic stem cell (HSC) and early progenitors, such as CMP, GMP, and MEP; R1 consists of mostly immature RBC progenitors, including BFU-E and CFU-E; R2 comprises mainly proerythroblasts and early basophilic erythroblasts; R3 contains early and late basophilic erythroblasts; R4 is composed of chromatophilic and orthochromatophilic erythroblasts; and R5 contains late orthochromatophilic erythroblasts and reticulocytes. Note that the transition from R2 to R3 is arrested in the mutant fetal liver. (B) May-Grunwald Giemsa staining showing similar morphology of FACS-sorted mutant and control E14.5 fetal liver cells. Scale bar: 20 μm. (C) Schematic diagram showing transplant of fetal liver cells that express CD45.2 and β-globin haplotype Hbbs (donor) into irradiated mice double congenic for CD45.1 and β-globin haplotype Hbbd (host). (D) Donor cell contribution to circulating leukocytes of adult WT mice transplanted with 2 million E13.5 mutant or control fetal liver cells. (E) Hemoglobin electrophoresis analysis indicates that mutant fetal liver cells cannot generate RBCs after transplantation into WT adult mice. (F) Immunostaining for Rcor1 protein in FACS-sorted E14.5 fetal liver cells. Mutant R0 cells serve as a negative control (NC). Nuclei labeled with 4′,6 diamidino-2-phenylindole (DAPI). Scale bar: 20 μm. Images in this figure were acquired with a Zeiss Axiovert S-100, a Zeiss plan-neofluar ×63/1.25 oil lens, and an AxioCam HRc camera. D, donor; H, host.
To determine whether the accumulation of R2 and R3 cells in the mutants reflected a differentiation arrest rather than aberrant marker expression, we examined the morphology of the FACS-sorted cells. Mutant R2 and R3 cells were identical to their control counterparts at these stages (Figure 3B). Thus, the altered expression pattern of TER119 and CD71 in the mutants represented a differentiation arrest.
To stringently test whether mutant erythroid progenitors can form mature RBCs, we performed a transplantation experiment wherein fetal liver cells from control and mutant CD45.2 embryos with the β hemoglobin haplotype Hbbs were transplanted into sublethally irradiated C57BL/6 mice congenic for both CD45.1 and the β hemoglobin haplotype Hbbd (Figure 3C). Host blood was analyzed for donor hemoglobin contribution at 4 weeks (data not shown) and 12 weeks after transplantation. Mutant fetal liver cells generated leukocytes with a frequency similar to that of control cells (Figure 3D); however, no mutant peripheral RBCs were detected (Figure 3E), indicating that mutant erythroid progenitor differentiation was blocked rather than temporarily arrested.
Immunostaining of sorted control fetal liver cells showed that Rcor1 protein is present in all of the cells from R0 to R3 (Figure 3F), supporting our results that the disruption of the Rcor1 complex plays an important role at these differentiation stages.
Rcor1 null erythroid progenitors have a cell-autonomous defect and potential for myeloid differentiation
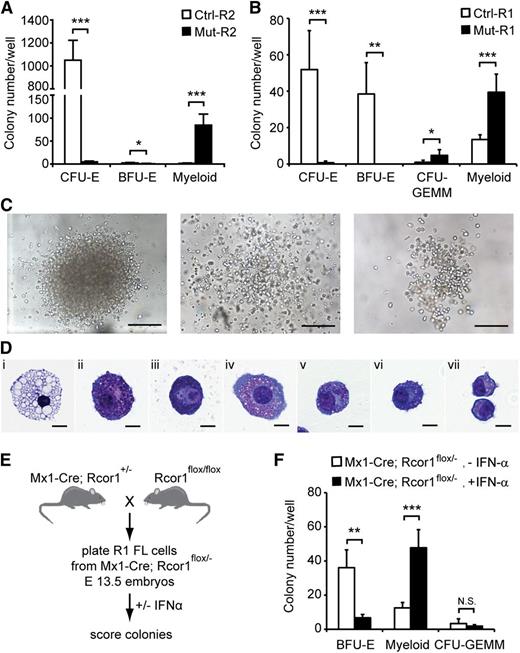
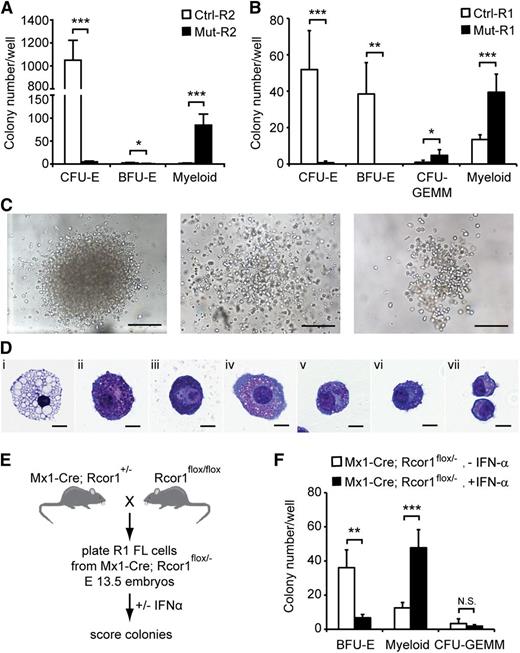
To determine whether the developmental arrest of Rcor1−/− erythroid cells is a cell-intrinsic defect, we performed in vitro colony-forming assays using lineage-depleted E13.5 fetal liver cells. Equal numbers of R2 cells (Figure 3A) were cultured in methylcellulose medium containing recombinant erythropoietin, stem cell factor, interleukin-3 (IL-3) and IL-6, which support the growth of erythroid and myeloid progenitors. As expected, control R2 cells generated almost exclusively CFU-erythroid (CFU-E) colonies. By contrast, very few, if any, CFU-E colonies were detected in Rcor1−/− R2 cells (Figure 4A), consistent with the erythroid defect observed in vivo. Instead, large numbers of heterogeneous myeloid colonies were detected (Figure 4A,C). Immature granulocytes, mast cells, and macrophages were present in individual cytospun colonies stained with May-Grunwald Giemsa reagent (Figure 4D).
In vitro colony-forming assays reveal a cell-autonomous defect in erythropoiesis and enhanced myeloid potential in Rcor1-deficient erythropoietic progenitors. (A-B) Numbers of colonies generated from (A) FACS-sorted R2 fetal liver cells or (B) R1 fetal liver cells in methylcellulose culture. Results from 4 experiments for R2 and 5 experiments for R1 are shown (mean ± SD). Equal numbers of control and mutant cells were plated in each experiment. (C) Representative myeloid colonies generated from methylcellulose cultures of mutant R2 cells. Scale bar: 200 μm. (D) Representative cells from cytospin preparations of mutant myeloid colonies stained with May-Grunwald Giemsa. (i) Macrophage, (ii-iii) mast cells, and (iv-vii) granulocytes. Scale bar: 10 μm. (E) Schematic diagram for generating inducible Rcor1 deletions in R1 fetal liver (FL) cells. (F) Numbers of colonies generated from FACS-sorted R1 Mx1-Cre; Rcor1flox/– fetal liver cells cultured in methylcellulose with or without IFN-α. Results from 6 experiments are shown (mean ± SD). All images were acquired by using a Zeiss Axiovert S-100 and AxioCam HRc cameras. A Zeiss Fluar ×10/0.5 objective was used for the images in (C) and a Zeiss plan-neofluar ×100/1.30 oil objective was used for the images in (D). *P < .05; **P < .01; ***P < .001. Myeloid colonies, colonies containing mast cells, granulocytes, and/or macrophages; N.S., nonsignificant.
In vitro colony-forming assays reveal a cell-autonomous defect in erythropoiesis and enhanced myeloid potential in Rcor1-deficient erythropoietic progenitors. (A-B) Numbers of colonies generated from (A) FACS-sorted R2 fetal liver cells or (B) R1 fetal liver cells in methylcellulose culture. Results from 4 experiments for R2 and 5 experiments for R1 are shown (mean ± SD). Equal numbers of control and mutant cells were plated in each experiment. (C) Representative myeloid colonies generated from methylcellulose cultures of mutant R2 cells. Scale bar: 200 μm. (D) Representative cells from cytospin preparations of mutant myeloid colonies stained with May-Grunwald Giemsa. (i) Macrophage, (ii-iii) mast cells, and (iv-vii) granulocytes. Scale bar: 10 μm. (E) Schematic diagram for generating inducible Rcor1 deletions in R1 fetal liver (FL) cells. (F) Numbers of colonies generated from FACS-sorted R1 Mx1-Cre; Rcor1flox/– fetal liver cells cultured in methylcellulose with or without IFN-α. Results from 6 experiments are shown (mean ± SD). All images were acquired by using a Zeiss Axiovert S-100 and AxioCam HRc cameras. A Zeiss Fluar ×10/0.5 objective was used for the images in (C) and a Zeiss plan-neofluar ×100/1.30 oil objective was used for the images in (D). *P < .05; **P < .01; ***P < .001. Myeloid colonies, colonies containing mast cells, granulocytes, and/or macrophages; N.S., nonsignificant.
We also cultured R1 cells (Figure 3A) from control and mutant fetal livers. Control R1 cells contain mostly less mature erythroid progenitors (BFU-E) and few primitive erythroid progenitors (CFU-GEMM; CFU-granulocyte, -erythroid, -monocyte, -megakaryocyte). Similar to mutant R2 cells, mutant R1 cells produced few, if any, erythroid colonies and generated large numbers of myeloid colonies that were not qualitatively different from the myeloid colonies in mutant R2 cultures (Figure 4B). Mutant R1 cells formed more CFU-GEMM colonies than control; however, they were pale, consistent with defective erythroid differentiation. Together with the lack of differentiated mutant erythroid cells in WT hosts after transplantation (Figure 3E), these findings suggest that a cell-intrinsic defect causes the arrest in erythropoiesis in Rcor1 mutants.
The dramatic increase in myeloid colony frequency in mutant cell cultures suggested either that mutant erythroid progenitors have the potential to become myeloid cells or that an atypical myeloid progenitor accumulates in the Rcor1 constitutive knockout fetal liver. We reasoned that inducing Rcor1 deletion following the isolation of normal progenitors would allow us to distinguish these 2 possibilities. Rcor1flox/flox mice were mated with Mx1-Cre mice to generate embryos in which the expression of Cre recombinase is inducible by IFN-α (Figure 4E).17 Sorted R1 cells from E13.5 Mx1-Cre; Rcor1flox/–- fetal livers were plated into methylcellulose culture medium with or without IFN-α.9 Interestingly, we observed a decrease of BFU-E and a concomitant, proportional increase of myeloid colonies in the IFN-α–treated cells (Figure 4F). Complete recombination of the floxed allele was confirmed in 22 of 23 myeloid colonies by PCR analysis (Figure 1B and data not shown). By contrast, the floxed Rcor1 allele was detectable in fully hemoglobinized CFU-GEMM. Cre-deficient Rcor1flox/– R1 cells cultured with or without IFN-α had indistinguishable CFU activity, indicating that IFN-α itself does not influence myeloid cell production (supplemental Figure 1). Thus, the increase in myeloid colonies is associated specifically with depletion of Rcor1 in progenitors that make BFU-E cells.
In parallel experiments using R2 cells from Mx1-Cre; Rcor1flox/– fetal livers, no difference in CFU-E and myeloid colony output was observed following treatment with IFN-α (data not shown). We suspect that turnover of Rcor1 was not fast enough to direct the lineage switch in CFU-E progenitors.
To test for aberrant white blood cell potential in Rcor1 mutant mice in vivo, we measured myeloid and lymphoid cells by flow cytometry. Although Mac1/Gr1+ myeloid cells in the mutant fetal livers increased fivefold in frequency, their absolute number per liver was not different from controls. B-cell (B220+) and T-cell (CD3+) numbers were both decreased in the mutant fetal livers (supplemental Figure 2). Evaluation of common myeloid progenitors (CMPs), granulocyte-monocyte progenitors (GMPs), or megakaryocyte-erythroid progenitors (MEPs)18 in the mutant fetal liver revealed a 1.8-fold decrease, 2.8-fold decrease, and a very modest 13% increase in their frequency, respectively (supplemental Figure 3). Thus, in the Rcor1 mutants, there is not a propensity to inappropriately expand the myeloid lineage. Presumably, the myeloid lineage–supporting cytokines present in the culture medium are absent or inactive in the fetal liver.
Rcor1 represses myeloid lineage and HSC and/or progenitor genes in erythroid progenitors
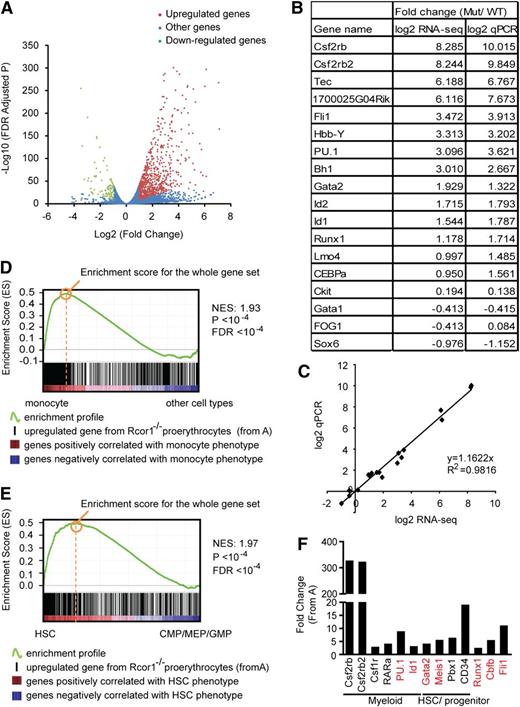
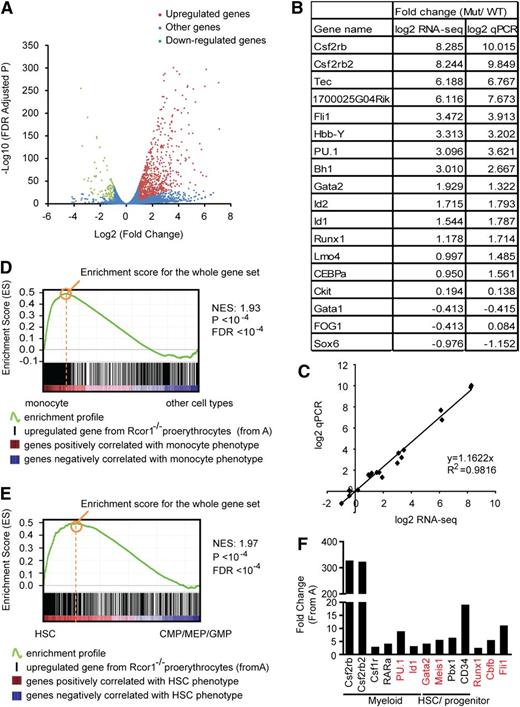
We performed messenger RNA profiling to investigate the underlying molecular mechanisms for both the block of erythropoiesis and increased myeloid potential in Rcor1-deficient R2 cells. Our bioinformatic analysis identified genes in the mutant cells that were either upregulated (n = 760) or downregulated (n = 87) by twofold relative to the controls (Figure 5A; supplemental Table 1). A good correlation (R2 = 0.9816) between RNA-Seq and qPCR was observed for the 18 genes assayed (Figure 5B-C).
Knockout of Rcor1 results in the upregulation of myeloid genes. (A) Volcano plot from RNA-Seq showing all expressed genes. The y-axis shows statistical significance. A false discovery rate (FDR) –adjusted P value of .05 is 1.3 on this scale. The x-axis shows the magnitude of change (mutant/control). Red dots, all upregulated genes with fold change ≥2 (P < .05) and an adjusted tag number of >50 (average mutant reads minus average control reads; for details, see “Materials and methods”). Green dots, all downregulated genes with fold change ≤2 (P < .05) and an adjusted tag number of >50 (average control reads minus average mutant reads). Blue dots, all other genes. (B) Confirmation of representative RNA-Seq results by qPCR. (C) Correlation between qPCR and RNA-Seq data based on data points from (B). (D) GSEA showing that genes that are upregulated in mutant Rcor1−/− cells correlate positively with genes that are enriched in monocytes. Heat map: genes are ranked according to their relative expression levels in monocytes to “other” hematopoietic cell types (LT-HSC, NK cells, monocytes, granulocytes, erythrocytes, naive CD4 cells, naive CD8 cells, active CD4 cells, active CD8 cells, B cells). Red, highly enriched in monocytes. Black vertical lines represent single genes from the upregulated Rcor1−/− gene set, which are positioned with respect to the ranked list of the reference cell type expression data set. The green line is the running sum for calculating the enrichment score (ES). Positive and negative ES indicate enrichment at the top and bottom of the ranked reference list, respectively. ES is normalized (NES) on the basis of differences in gene set size and correlations between gene sets and is used to compare GSEA results across experiments. (E) GSEA showing that genes upregulated in Rcor1−/− cells are correlated positively with genes that are highly expressed in HSCs. Heat map: genes are ranked according to their relative expression levels in HSCs relative to CMPs, GMPs, and MEPs.21 Colors and NES as described in (D). (F) Examples of de-repressed genes from Rcor1−/− cells. Red colored genes have been reported to block erythropoiesis when de-repressed in RBC progenitors.
Knockout of Rcor1 results in the upregulation of myeloid genes. (A) Volcano plot from RNA-Seq showing all expressed genes. The y-axis shows statistical significance. A false discovery rate (FDR) –adjusted P value of .05 is 1.3 on this scale. The x-axis shows the magnitude of change (mutant/control). Red dots, all upregulated genes with fold change ≥2 (P < .05) and an adjusted tag number of >50 (average mutant reads minus average control reads; for details, see “Materials and methods”). Green dots, all downregulated genes with fold change ≤2 (P < .05) and an adjusted tag number of >50 (average control reads minus average mutant reads). Blue dots, all other genes. (B) Confirmation of representative RNA-Seq results by qPCR. (C) Correlation between qPCR and RNA-Seq data based on data points from (B). (D) GSEA showing that genes that are upregulated in mutant Rcor1−/− cells correlate positively with genes that are enriched in monocytes. Heat map: genes are ranked according to their relative expression levels in monocytes to “other” hematopoietic cell types (LT-HSC, NK cells, monocytes, granulocytes, erythrocytes, naive CD4 cells, naive CD8 cells, active CD4 cells, active CD8 cells, B cells). Red, highly enriched in monocytes. Black vertical lines represent single genes from the upregulated Rcor1−/− gene set, which are positioned with respect to the ranked list of the reference cell type expression data set. The green line is the running sum for calculating the enrichment score (ES). Positive and negative ES indicate enrichment at the top and bottom of the ranked reference list, respectively. ES is normalized (NES) on the basis of differences in gene set size and correlations between gene sets and is used to compare GSEA results across experiments. (E) GSEA showing that genes upregulated in Rcor1−/− cells are correlated positively with genes that are highly expressed in HSCs. Heat map: genes are ranked according to their relative expression levels in HSCs relative to CMPs, GMPs, and MEPs.21 Colors and NES as described in (D). (F) Examples of de-repressed genes from Rcor1−/− cells. Red colored genes have been reported to block erythropoiesis when de-repressed in RBC progenitors.
To gain insight into the differentiation programs regulated by Rcor1, we used GSEA19 to compare the upregulated and downregulated gene sets from Rcor1−/− R2 cells with those of reference gene expression profiles. We exploited published microarray data sets for long-term HSCs (LT-HSCs), monocytes, granulocytes, naive and active T cells, B cells, natural killer (NK) cells, and nucleated (immature) erythrocytes.20 Genes enriched in monocytes (Figure 5D) and granulocytes (supplemental Figure 4) were highly enriched in the Rcor1−/− upregulated genes (supplemental Table 2). These results suggested that myeloid genes were expressed ectopically and inappropriately in the Rcor1−/− cells, consistent with their myeloid differentiation potential in the colony-forming assays.
Interestingly, transcripts associated with LT-HSCs were enriched in both the up- and downregulated genes in the Rcor1 mutants, with a much higher ES for the upregulated gene set (supplemental Table 2). Because multipotent progenitors were not included in the comparison of HSCs and differentiated cells,20 this HSC signature may not truly represent HSCs. We therefore performed GSEA analysis by using published expression profiles for HSC, CMP, GMP, and MEP cells.21 This analysis revealed an enrichment of HSC (Figure 5E) and CMP (supplemental Figure 3) transcripts in the upregulated genes in mutant R2 cells (supplemental Table 3), further suggesting that both HSC and early progenitor genes are de-repressed in Rcor1−/− cells.
Interestingly, no major changes in the expression levels were detected in a subset of factors critical for erythropoiesis,22 including Gata1, Zfpm1/Fog1, Scl/Tal1, Klf1/Eklf, Lmo2, Tcf3/E2A, and erythropoietin receptor (supplemental Figure 5). Thus, it is unlikely that the differentiation block in the Rcor1 mutant is due to a lack of positively acting regulators for erythropoiesis. Instead, our data suggest that Rcor1 promotes erythroid differentiation by repressing myeloid genes and HSC and progenitor genes. Examples of myeloid genes include transcription factors, such as RARα,23 PU.124 and Id1,25 which promote myelopoiesis, as well as the cytokine CSF2/IL3/IL5 receptor β common chain (Csf2rb and Csf2rb2) and macrophage colony-stimulating factor receptor (Csf1r). Similarly, genes encoding factors that are important in maintaining HSCs and early progenitors, including Gata2,26 Meis1,27 Pbx128 and CD34,29 were de-repressed. Notably, overexpression of PU.1,24 Id1,30 Meis1,31 Gata2,32,33 Fli1,34 and the Runx1/Cbfb complex35-37 (Figure 5F) can interfere with normal erythropoiesis.
Increased CSF2 signaling in Rcor1 mutant erythroid cells contributes to their myeloid potential
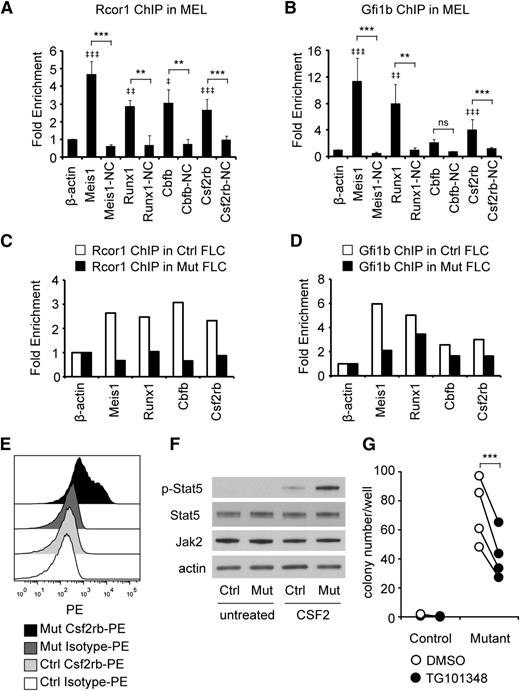
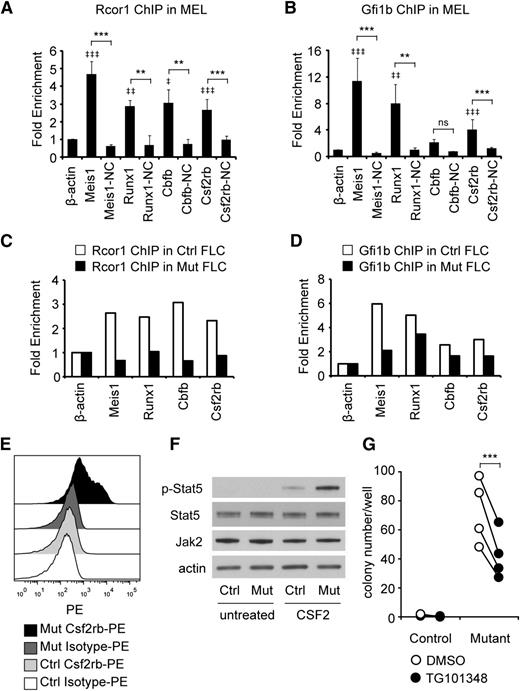
To identify which genes were direct Rcor1 targets, we performed ChIP analysis followed by qPCR. Gfi1b binding was also assessed, given the previously demonstrated interaction between Gfi1b and Rcor1 and their shared binding at many hematopoietic genes.7 We focused on Runx1 and Cbfb because their overexpression is detrimental to erythroid development.35-37 Csf2rb was also assayed because of its robust induction in Rcor1−/− cells (300-fold; Figure 5B). Meis1, a known target of Gfi1b and Rcor1,38 was included as a positive control. To guide our design of ChIP primers (supplemental Table 5), we used published Kdm1a ChIP-seq sites that were close to transcriptional start sites.9 Primer sites located more than 2 kb away from Kdm1a or Gfi1b binding sites, as well as the expressed β-actin gene, served as NCs. In our initial screen of the MEL cell line, binding of both Rcor1 and Gfi1b was detected at the promoter regions of Meis1, Runx1, and Csf2rb (Figure 6A-B). Similar binding patterns of Rcor1 and Gfi1b at these targets were confirmed in control R2 cells prepared from fetal livers (Figure 6C-D); however, in R2 cells, Gfi1b binding was also detected at the Cbfb promoter. As expected, in mutant fetal liver cells, Rcor1 was depleted from these promoters (Figure 6C). These data indicate that Rcor1 directly regulates these genes in fetal liver cells in vivo, likely together with Gfi1b.
Rcor1 mutants exhibit a hypersensitive CSF2 signaling pathway. (A-B) Rcor1 and Gfi1b occupy the promoters of indicated target genes measured by (A) Rcor1 ChIP and (B) Gfi1b ChIP analysis in the MEL cell line. Binding is represented as fold enrichment relative to a negative region from the β-actin gene intron. For each gene, a site 2 to 8 kb away from the positive binding site served as the internal NC. Results from 3 experiments are shown (mean ± SD). ‡ indicates comparisons to β -actin: ‡P < .05; ‡‡P < .01; ‡‡‡P < .001. *Indicates comparison with internal NC: *P < .05; **P < .01; ***P < .001. (C) Rcor1 ChIP and (D) Gfi1b ChIP analysis in primary control R2 fetal liver cells (FLCs) and mutant total FLCs. Binding is represented as fold enrichment relative to a negative region from the β-actin gene intron. The mean of 2 independent experiments is shown. (E) Representative flow cytometry analysis of Csf2rb expression level in E13.5 control fetal liver (n = 10) and mutant fetal liver (n = 5). PE-conjugated anti-Csf2rb or PE-conjugated immunoglobulin G1 (isotype control) were used. (F) Western blot analysis showing that purified TER119– mutant cells have higher levels of p-Stat5, but similar levels of total Stat5 and Jak2 protein, following treatment with CSF2. This experiment was repeated once more with the same result. (G) Colony-forming assay results showing that the Jak2 inhibitor TG101348 reduces CFU-GM colonies generated from mutant fetal liver R2 cells. Results from 4 independent control or mutant fetal livers treated with TG101348 or dimethylsulfoxide (DMSO) are shown (mean ± SD). ***P < .001.
Rcor1 mutants exhibit a hypersensitive CSF2 signaling pathway. (A-B) Rcor1 and Gfi1b occupy the promoters of indicated target genes measured by (A) Rcor1 ChIP and (B) Gfi1b ChIP analysis in the MEL cell line. Binding is represented as fold enrichment relative to a negative region from the β-actin gene intron. For each gene, a site 2 to 8 kb away from the positive binding site served as the internal NC. Results from 3 experiments are shown (mean ± SD). ‡ indicates comparisons to β -actin: ‡P < .05; ‡‡P < .01; ‡‡‡P < .001. *Indicates comparison with internal NC: *P < .05; **P < .01; ***P < .001. (C) Rcor1 ChIP and (D) Gfi1b ChIP analysis in primary control R2 fetal liver cells (FLCs) and mutant total FLCs. Binding is represented as fold enrichment relative to a negative region from the β-actin gene intron. The mean of 2 independent experiments is shown. (E) Representative flow cytometry analysis of Csf2rb expression level in E13.5 control fetal liver (n = 10) and mutant fetal liver (n = 5). PE-conjugated anti-Csf2rb or PE-conjugated immunoglobulin G1 (isotype control) were used. (F) Western blot analysis showing that purified TER119– mutant cells have higher levels of p-Stat5, but similar levels of total Stat5 and Jak2 protein, following treatment with CSF2. This experiment was repeated once more with the same result. (G) Colony-forming assay results showing that the Jak2 inhibitor TG101348 reduces CFU-GM colonies generated from mutant fetal liver R2 cells. Results from 4 independent control or mutant fetal livers treated with TG101348 or dimethylsulfoxide (DMSO) are shown (mean ± SD). ***P < .001.
The Csf2rb gene encodes the receptor β subunit shared by the cytokines CSF2, IL-3, and IL-5, which stimulate proliferation, differentiation, survival, and functional activation of myeloid cells.39 We therefore hypothesized that overexpression of Csf2rb in Rcor1−/− erythroid precursors might influence their response to cytokines and contribute to the inappropriate generation of myeloid colonies (Figure 4). A fourfold increase in anti-Csf2rb staining on the mutant fetal liver cells was detected by using flow cytometry (Figure 6E; median fluorescence intensity of control: 166.4 ± 24.2, n = 10; median fluorescence intensity of mutant: 692 ± 136.9, n = 5; P < .0001). Notably, cell surface expression of Csf2rb was also detected in immunophenotypically defined erythroid progenitor populations40 in Rcor1 mutants but not controls (supplemental Figure 6).
The α subunits that associate with Csf2rb determine the cellular cytokine response, and we noted that the α subunit of the CSF2 receptor is expressed at a higher level than the α subunits of IL-3 and IL-5 receptors in our mutant RNA-Seq data sets. Upon stimulation of R2 cells with CSF2, levels of phospho-Stat5, an important downstream mediator of CSF2 signaling, were increased fivefold in mutant cells (Figure 6F), whereas total Jak2 and Stat5 protein levels were the same in control and mutant cells. To test whether this altered signaling pathway in Rcor1−/− erythroid cells contributed to their generation of myeloid colonies, the Jak/Stat pathway was blocked with a specific Jak2 inhibitor, TG101348.41 This inhibitor reduced the number of myeloid colonies formed by mutant cells by 40% (Figure 6G). Taken together, these results suggest that hyperactivation of the Csf2rb signaling pathway contributes to the generation of myeloid cells by mutant erythroid progenitors.
Discussion
This study provides the first in vivo evidence that Rcor1 is an essential corepressor in erythropoiesis. Rcor1 is present in protein complexes with Kdm1a and HDACs in different cell types, and Rcor1 can bind Kdm1a directly.3 Nonetheless, the germline knockouts of Kdm1a and HDAC mice exhibit a more severe phenotype than the Rcor1 knockouts, dying by E7.542 and E10.543 respectively, compared with ∼E16.5 for Rcor1 mutants. However, elimination of Kdm1a or Rcor1 in the RBC lineage blocks erythropoiesis at the transition of proerythroblast to basophilic erythroblast.9 Thus, the transcription factors that recruit Rcor1 are predicted to be only a subset of the factors that recruit Kdm1a.
In cells with erythroid potential, Rcor1 has been shown to physically interact with Gfi1b,7 Scl/Tal1,44 and Bcl11a.45 Rcor1 and Gfi1 bind to 720 common targets in MEL cells (25.8% of total Rcor1 targets7 ), and numerous erythroid maturation defects are shared by Rcor1−/− and Gfi1b−/− mice. Both knockout mice die at ∼E15.5 to E16.5 because of arrested definitive erythropoiesis. Furthermore, Gfi1b−/− cells8 and Rcor1−/− cells cannot form typical BFU-E and CFU-E, and instead exhibit the potential to form mast cell colonies in cytokine-supplemented cultures (Figure 4). Collectively, these data suggest that Gfi1b and Rcor1 work together to regulate early steps in definitive erythropoiesis in vivo. Given that functional erythropoiesis is preserved in BCL11A-deficient erythroid cells and their major phenotype at the transcriptional level is failure to repress embryonic β-like and α-like globin gene expression,46 BCL11A is not a likely candidate for mediating early definitive erythroid cell maturation together with Rcor1. Scl/Tal1 is important but is not essential for the generation of mature RBCs,47 and Scl/Tal1 and Rcor1 share a number of gene targets7,48 ; however, the functional interactions between Scl/Tal1 and Rcor1 in early erythroid cell differentiation remain to be explored.
One of the more striking findings of our studies is that Rcor1-deficient cells enriched for erythroid precursors have vastly increased myeloid potential in vitro. Our use of a conditional Rcor1 knockout model to delete Rcor1 from phenotypically normal R1 cells revealed a decrease in BFU-E accompanied by a proportionate increase in myeloid colony formation. These data suggest that BFU-E or earlier stage progenitors can transition to a myeloid phenotype after deletion of Rcor1. This could also account for the higher frequency of CFU-GEMM colonies comprising both erythroid and myeloid cells observed in the induced mutant R1 cultures. Our transcriptome analysis of Rcor1−/− proerythroblasts suggests that proerythroid gene expression is not affected by loss of Rcor1, and the de-repression of genes associated with HSC and progenitor cell function and myeloid differentiation likely drive this myeloid lineage switch. An alternative explanation for the observed increase in myeloid colonies in the R1 culture may be that loss of Rcor1 can increase proliferation of a preexisting myeloid progenitor pool. Given the lower frequency of phenotypic GMP and CMP observed in the mutants (supplemental Figure 3), these primitive myeloid progenitors are unlikely candidates.
The most robustly upregulated transcript in Rcor1−/− proerythroblasts was Csf2rb, and Csf2rb was readily detectable on mutant erythroid cells. Our ChIP results indicated that both Gfi1b and Rcor1 occupy the Csf2rb promoter in vivo, suggesting that this complex directly represses Csf2rb expression in WT erythroid cells. Interestingly, a recent study also shows Kdm1a at this site.9 Moreover, the myeloid transcription factors PU.1 and C/EBPα,49,50 both overexpressed in the mutant erythroid cells, can directly activate the Csf2rb gene. Several studies showed that increasing the activity of Csf2rb is sufficient to induce myeloid colony formation from both fetal liver cells and bone marrow.51,52 Similarly, overexpression of an activated form of the human Csf2rb in fetal liver cells induces growth factor–independent proliferation and differentiation of mast cells and neutrophils.53 We demonstrated that Csf2rb overexpression in the mutant erythroid cells makes them hypersensitive to CSF2 stimulation. Moreover, inhibition of Jak2, a major effector of CSF2 signaling, significantly reduced the myeloid colony-forming capacity of Rcor1-deficient cells (Figure 6G). Thus, overexpression of Csf2rb in Rcor1 mutant erythroid cells likely contributes to the adoption of a myeloid cell fate in colony-forming assays.
Previously, Gfi1b was shown to directly repress the transforming growth factor-β (TGF-β) receptor gene, Tgfbr3, and thereby modifies TGF-β signaling to facilitate the differentiation of immature progenitors (MEP) toward the erythroid lineage.54 Our transcriptome analysis of Rcor1-deficient committed erythroid precursors did not reveal a large increase in TGFb receptor expression relative to control cells. Specifically, Tgfbr3 was downregulated (mutant/control = 0.779-fold), whereas Tgfbr1 (mutant/control = 1.64-fold) and Tgfb2 (mutant/control = 1.94-fold) were modestly upregulated. Thus, the Gfi1b-Rcor1 complex likely has different targets at specific stages of erythropoiesis.
In summary, our work revealed an essential role for Rcor1 in promoting erythroid progenitor maturation and restricting their differentiation toward alternative myeloid lineages.
The online version of this article contains a data supplement.
The publication costs of this article were defrayed in part by page charge payment. Therefore, and solely to indicate this fact, this article is hereby marked “advertisement” in accordance with 18 USC section 1734.
Acknowledgments
We thank Jennifer Miller, Travis Polston, and Andrea Ansari for mouse genotyping and animal care and Hyunjung Lee and Kimberly Hamlin for the blood analysis.
This work was supported by grants (National Institute of Neurological disorders and Stroke) NS22518 (G.M.), (Linked Specialized Center Cooperative Agreement) 5UL1RR024140 (S.K.), (Center Core Grant) 5P30CA069533 (S.K.M.), and (National Heart, Lung and Blood Institute) HL069133 (W.H.F.) from the National Institutes of Health. H.Y. was supported by an American Heart Association predoctoral fellowship. S.H.O. and G.M. are investigators at the Howard Hughes Medical Institute.
Authorship
Contribution: H.Y., D.C.G., W.H.F., and G.M. designed the experiments; H.Y., D.C.G., and G.F. performed the experiments with technical help from M.A.K. and S.H.O.; H.Y., D.C.G., G.F., W.H.F., and G.M. analyzed the experimental data; T.N. generated the Rcor1−/− mice; S.K. and S.K.M. analyzed the RNA-Seq data; J.W.T. provided essential reagents; and H.Y., D.C.G., and G.M. wrote the manuscript.
Conflict-of-interest disclosure: The authors declare no competing financial interests.
Correspondence: Gail Mandel, Medical Research Building Room 322, Oregon Health & Science University, 3181 SW Sam Jackson Park Rd, Portland, OR 97239, e-mail: mandelg@ohsu.edu.

