Abstract
Background: The use of high-throughput ¡®omic¡¯ data holds great promise to better match patients to drugs. A necessary step to realize this goal is to identify molecular markers that are predictive of clinical phenotypes such as sensitivity to drugs. Although large expression datasets from AML patients with clinical, genetic, and molecular annotation exist, due to the high-dimensionality (i.e., number of genes >> number of patients), it is an open challenge to identify robust molecular markers that are consistently associated with a phenotype across studies.
Method: To resolve this challenge, we developed a novel computational method, named SPARROW, to reduce the dimensionality of expression data by identifying genes that represent important molecular events in publicly available AML expression data. In particular, it aims to identify hub regulators whose expression levels are predictive of many downstream genes¡¯ expression levels (Fig 1), by using a novel statistical technique to discriminate direct associations from complex correlations. We measured expression and in vitro drug sensitivity in 30 primary AML samples. Out of 160 drugs considered, 55 drugs exhibited activity against at least half the patient samples. We processed the drug sensitivity data by curve fitting and then extracting summary statistics, such as the activity area (AA), area under the curve (AUC), IC50, EC50, and Amax.
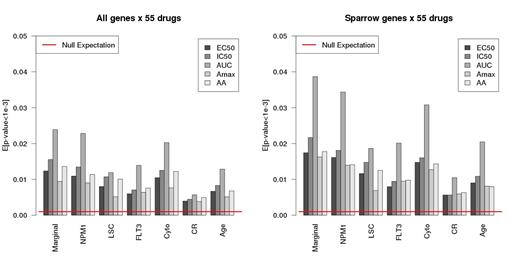
Results: The top N hubs selected by SPARROW (with 2 methods for choosing sparsity level) are highly enriched for genes important in AML (Fig 2). The significance of enrichment was much better than 5 other widely used hub detection methods. SPARROW identifies hubs that are direct targets of perturbation of the underlying AML disease process. Hub expression is therefore especially informative of the molecular state of the disease and correspondingly the sensitivity or resistance of patient cells to drug treatment. We took the 400 top SPARROW hubs and tested for association with the summary statistics of 55 drugs. Considering the top 400 hubs increases statistical power to detect significant associations than when all 18,000 are considered (Fig 3).
For each SPARROW hub that was significantly associated (FDR=0.05) with AUC for multiple drugs, we tested for enrichment of the associated drugs for a shared functional class. We present the results for four classes: 1) High expression of FLT3 was associated with increased sensitivity to the FLT3 inhibitors sunitinib, AP24534, and tandutinib (p-value: 0.01). 2) TRF2 and PRMT6 are enriched for association (p -values: 0.007, 0.034) with sensitivity to the nucleoside analogues (azacitidine, cladribine, clofarabine, fludarabine) or alkylators (melphalan, mitomycin C). The protection of human telomeres depends primarily on TRF2. PRMT6 dimethylates histone H3, which inhibits H3K4 trimethylation by MLL. 3) Notably, SMARCA4 and TRF2 are enriched for increased sensitivity (p-values: 0.015, 0.005) to daunorubicin, mitoxantrone, etoposide, and topotecan, all topoisomerase inhibitors. SMARCA4 is essential for proliferation of both normal hematopoietic leukemia stem cells. 4) For HDAC inhibitors belinostat, MS-275, panobinostat, andvorinostat, 2 hubs were significantly associated with increased sensitivity: RNF24 and BAZ2B (p-values: 6.5x10⁻⁵, 5.7x10⁻⁴). Suggestively, BAZ2B has a bromodomain, commonly involved in chromatin mediated regulation. Thus, it is intriguing that high expression level of these genes is associated with chemotherapy drug sensitivity, bringing new insight into the mechanisms that govern individual patient response to chemotherapy.
Conclusion: These results demonstrate that SPARROW can reduce the dimensionality of expression data into a highly informative set of genes, which can facilitate the identification of robust molecular markers for chemotherapy drugs.
Significance of the overlap between top N hubs and (A) known AML drivers from the TCGA study, (B) genes annotated to AML from Malacards, and (C) genes whose expression is associated with survival time.
Significance of the overlap between top N hubs and (A) known AML drivers from the TCGA study, (B) genes annotated to AML from Malacards, and (C) genes whose expression is associated with survival time.
No relevant conflicts of interest to declare.
Author notes
Asterisk with author names denotes non-ASH members.


