Introduction:
Histologic transformation (HT) in patients with low-grade Non-Hodgkin lymphoma (LG-NHL) has historically been associated with poor survival. We previously described the predictive value of the revised international prognostic index (R-IPI) to differentiate patients into good and poor-risk survival groups. The recently developed NCCN international prognostic index (NCCN-IPI) has demonstrated improved discrimination capacity over the IPI in patients with de novo DLBCL. Here, we investigate the utility of the NCCN-IPI in patients with transformed lymphoma (TL) and further assess the impact of relevant clinical variables on survival in a multivariate analysis.
Methods
Patients with a biopsy proven diagnosis of DLBCL transformed from LG-NHL were identified between January 2001 and December 2011 through the Moffitt Cancer Center Total Cancer Care Database. Patients with Richter's transformation were excluded. All patients received rituximab-based chemotherapy at HT. Risk scores were calculated for all patients based on variables at the time of TL diagnosis. Progression free survival (PFS) and overall survival (OS) were calculated from the date of transformation, estimated by the Kaplan-Meier method (K-M), and compared using the long-rank test. Predictors of survival were assessed using the Cox proportional hazards model, and multivariate analyses of significant factors were assessed by backward elimination.
Results
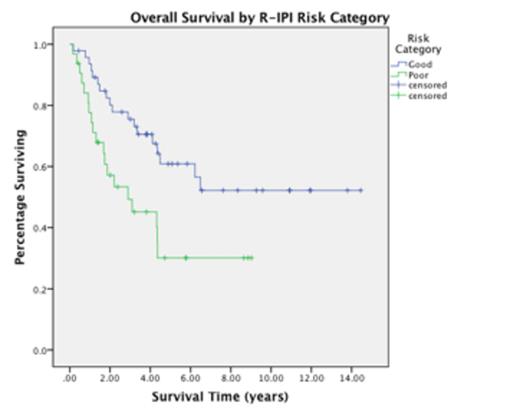
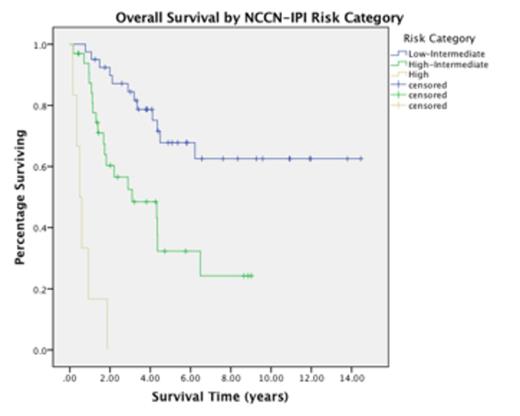
A total of 79 patients with transformed DLBCL were identified. The median age at transformation was 64 years (range 21 – 88). The most common original LG-NHL diagnosis was follicular lymphoma (74.7%) followed by marginal zone lymphoma (21.5%). The majority of patients (89.9%) presented with stage III/IV disease at transformation. The most common treatment regimen at transformation was R-CHOP (81%) followed by R-ICE (12.7%).] The median PFS for the entire group was 1.98 years (95% CI, 1.28-2.67) and the median OS was 4.49 years (95% CI, 2.52-6.47). The NCCN-IPI risk model demonstrated better discrimination of survival risk and was able to identify 3 statistically distinct groups by log-rank analysis, p<0.001 (Figure 1). The R-IPI scoring systems was only able to identify 2 risk groups within this TL population, p=0.010 (Figure 2). A comparison of the estimated 2-year PFS and OS between the R-IPI and NCCN-IPI scoring systems is demonstrated in Table 1. Of note, the NCCN-IPI identifies a particularly poor risk survival group within the "high-risk" category with an estimated 2-year OS of 0% versus 57% for the "poor-risk" R-IPI group.
On univariate analysis of OS, performance status (HR 1.56, p=0.037), elevated LDH (HR 3.02, p=0.001), the presence of B-symptoms (HR 2.14, p=0.026), the original FLIPI score at the time of original LG-NHL diagnosis (HR 2.86, p<0.001), the R-IPI (HR 2.29, p=0.012), and the NCCN-IPI (HR 4.57, p<0.001) were all significantly correlated with survival. Further risk stratification by serum albumin <3.7, which we have previously described in the context of de novo DLBCL, was not statistically significant in this TL cohort (HR 1.66, p=0.215). Additionally, there was no significant correlation with older age (0.065), advanced stage (p=0.793), prior treatment (p=0.249), cell of origin (p=0.379), time to transformation (p=0.496), or autologous transplant (p=0.418). On multivariate analysis of overall survival, both the original FLIPI score (HR 2.04, p=0.032) and the NCCN-IPI (HR 4.17, p=0.002) retained statistical significance.
Conclusions
The NCCN-IPI scoring system demonstrated superior discrimination of survival risk over the R-IPI among patients with transformed Non-Hodgkin Lymphoma and was the strongest predictor of progression free and overall survival at the time of transformation on multivariate analysis. The categorization of a high-risk group with an extremely poor 2-year overall survival, identifies a subset of patients who might benefit from more aggressive or experimental approaches.
Risk Category (n=79)
| Risk Score . | 2 yr OS . | 2 yr PFS . | ||||
|---|---|---|---|---|---|---|
| R-IPI (%) | NCCN-IPI (%) | R-IPI | NCCN-IPI | R-IPI | NCCN-IPI | |
| Low / Very Good | 0 (0) | 0-1 (0) | ||||
| Low-Intermediate / Good | 1-2 (59.5) | 2-3 (51.9) | 80% | 88% | 59% | 63% |
| High-Intermediate | 4-5 (40.5) | 63% | 40% | |||
| High / Poor | 3-5 (40.5) | 6 (7.6) | 57% | 0% | 35% | 0% |
No relevant conflicts of interest to declare.
Author notes
Asterisk with author names denotes non-ASH members.


