Abstract
Background and Aim: PET is a useful tool that allows deeper assessment of response beyond that measured by M protein levels. It has been reported to predict outcome following both ASCT and recently non-transplant setting too. To be able to integrate PET-CT negativity to internationally accepted response criteria the cut-off level needs to be validated by independent investigators. This prospective study was initiated to elucidate the prognostic role of PET-CT in the ASCT setting testing the cut-off level 4.2 initially reported by Zamagniet al versus the cut-off (3.35) based on our results.
Patients and Methods: 139 consecutive patients diagnosed and transplanted in Ankara University with pre- and post-transplant (Tx) PET-CT imaging were included. Patients were: Median age 56.5 +/- 8.7 (M/F: 79/60), ISS I/II/III: 50/55/34, renal impairment (10.8%), bone involvement (90.6%), del13q (40.9%), t(4;14) and/or p53(26.5%), LDH high(12.9%), induction with Bortezomib (73.4%). Pre-Tx clinical response ³VGPR: 52.9%, post-Tx clinical response ³VGPR: 77.5%. Overall Survival (OS): median: 33 months (4.2-141 months). PASW statistics for Windows program was used for statistical analysis.
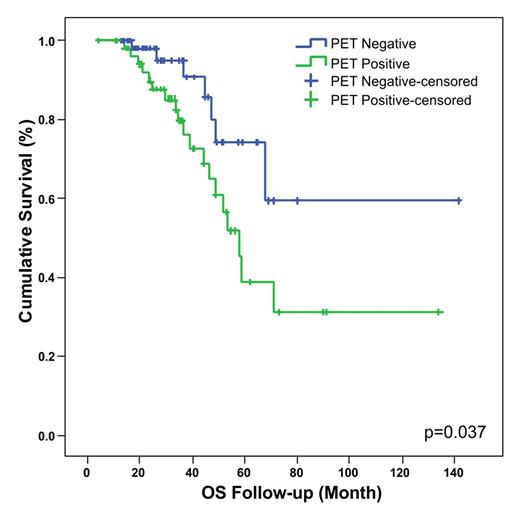
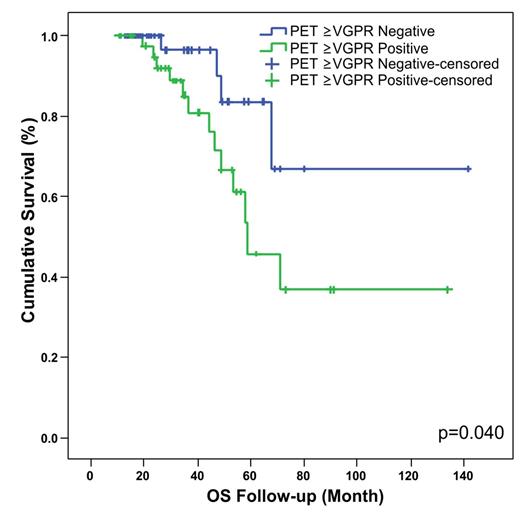
Results: ROC analysis revealed 3.35 as a significant cut-off level (p=0.005; OS). PET-CR was defined FDG uptake less than 4.2 or 3.35 depending on the analysis. Pre-Tx PET-CR:17.4%, post-Tx PET-CR: 69.6% (<4.2), 46.4% (<3.35). Cross tabulation of post-Tx clinical response versus PET response is summarized in Table 1. PET (>4.2) was predictive for PFS (p=0.05) but not OS (p=0.096). However PET (>3.35) was predictive for OS (p=0.037) but not PFS. PET (>4.2) was predictive for OS (p=0.014) and PFS (p=0.019)among only ³VGPR patients. Similarly PET (>3.35) among ³VGPR patients was also predictive for OS (p=0.05) and PFS (p=0.04). PET-CR was not predictive among ³CR patients significantly. Cox regression analysis for PFS, when PET (>4.2) is used, ISS was significant only (OR: 1.99, p=0.049) when post-Tx clinical response (OR: 0.46, p=0.022) is not included in the model. For OS, clinical response both pre-Tx (OR: 0.35, p=0.015) and post-Tx (OR: 0.18, p<0.001) is the only significant parameter. PET (>3.35) increased the predictive value of PET. In addition to clinical response, PET-CR appeared as a borderline significant factor for OS: pre-Tx (OR: 2.2, p=0.078), post-Tx (OR: 2.26, p=0.067).
In conclusion both PET (<4.2) and PET (<3.35) recognizes deeper responses as manifested by extension of PFS (PET<4.2) and OS (PET<3.35). Both assessments were able to define patients with separate survival outcomes within the ³VGPR group. This effect could not be confirmed within the ³CR group due to the relatively smaller sample size. After multivariate analysis only PET (>3.35) approached significance. To be able to integrate PET-CR to response criteria definition of PET-CR needs to be confirmed.
| . | PET cut-off 4.2 . | PET cut-off 3.35 . | ||
|---|---|---|---|---|
| Number of patients | negative | positive | negative | positive |
| <PR | 2 | 0 | 2 | 0 |
| PR | 15 | 5 | 9 | 11 |
| VGPR | 39 | 14 | 31 | 22 |
| CR | 22 | 14 | 15 | 21 |
| < VGPR | 17 | 5 | 11 | 11 |
| 3 VGPR | 61 | 28 | 46 | 43 |
| < CR | 56 | 19 | 42 | 33 |
| 3 CR | 22 | 14 | 15 | 21 |
| 3 year PFS | 45.8% | 25.6% | 48.9% | 28.9% |
| 3 year OS | 91.6% | 76.1% | 94.9% | 79.5% |
No relevant conflicts of interest to declare.
Author notes
Asterisk with author names denotes non-ASH members.


