Key Points
TFR2, a gene mutated in hemochromatosis and a partner of the EPO receptor, limits erythropoiesis expansion in mice.
Iron deficiency mimics TFR2 deletion in the erythroid compartment.
Abstract
Transferrin receptor 2 (TFR2) contributes to hepcidin regulation in the liver and associates with erythropoietin receptor in erythroid cells. Nevertheless, TFR2 mutations cause iron overload (hemochromatosis type 3) without overt erythroid abnormalities. To clarify TFR2 erythroid function, we generated a mouse lacking Tfr2 exclusively in the bone marrow (Tfr2BMKO). Tfr2BMKO mice have normal iron parameters, reduced hepcidin levels, higher hemoglobin and red blood cell counts, and lower mean corpuscular volume than normal control mice, a phenotype that becomes more evident in iron deficiency. In Tfr2BMKO mice, the proportion of nucleated erythroid cells in the bone marrow is higher and the apoptosis lower than in controls, irrespective of comparable erythropoietin levels. Induction of moderate iron deficiency increases erythroblasts number, reduces apoptosis, and enhances erythropoietin (Epo) levels in controls, but not in Tfr2BMKO mice. Epo-target genes such as Bcl-xL and Epor are highly expressed in the spleen and in isolated erythroblasts from Tfr2BMKO mice. Low hepcidin expression in Tfr2BMKO is accounted for by erythroid expansion and production of the erythroid regulator erythroferrone. We suggest that Tfr2 is a component of a novel iron-sensing mechanism that adjusts erythrocyte production according to iron availability, likely by modulating the erythroblast Epo sensitivity.
Introduction
Transferrin receptor 2 (TFR2), the gene mutated in hemochromatosis type 31 is a transmembrane protein homologous to TFR1. Though not involved in iron transport, TFR2 binds the iron-loaded transferrin (holo-TF), even if with a lower affinity than TFR1,2,3 a finding that suggests a potential regulatory role. TFR2 is expressed in the liver and, to a lower extent, in erythroid cells.2,4 In iron-replete conditions, TFR2 protein is stabilized on the plasma membrane by binding to its ligand holo-TF. This induces a reduction of TFR2 lysosomal degradation5 or a decreased shedding of the receptor from the plasma membrane (A.P., L.S., and C.C., unpublished manuscript). All of these properties make TFR2 a good candidate sensor for iron bound to circulating TF, measured as transferrin saturation (TS).
Humans with mutations of TFR2 develop iron overload1,6,7 with low hepcidin levels8 ; a similar phenotype occurs in mice with constitutive9-12 or liver conditional12,13 Tfr2 deletion.
The hepatic form of TFR2 is proposed to cooperate with the hereditary hemochromatosis protein HFE, the atypical major histocompatibility complex class I protein, responsible for hemochromatosis type 1.14 The TFR2/HFE complex is presumed to activate the transcription of hepcidin (HAMP), the master regulator of iron homeostasis,15 in response to increased TS, although the molecular mechanisms remain poorly understood.
Although the involvement of TFR2 in the regulation of HAMP has been extensively studied, the erythroid function of the protein has not been investigated in depth. TFR2 and the erythropoietin receptor (EPOR) are activated synchronously and coexpressed during erythroid differentiation.2,16,17 Moreover, in erythroid precursors, TFR2 associates with EPOR in the endoplasmic reticulum and is required for the efficient transport of the receptor to the cell surface. Finally, TFR2 knockdown in vitro delays the terminal differentiation of human erythroid progenitors.17 Thus, the erythroid TFR2 is a component of the EPOR complex and is required for efficient erythropoiesis.
We have recently demonstrated that the phenotype of Tfr2 total (Tfr2−/−) and liver-specific (Tfr2LCKO) knockout (KO) mice lacking the hepcidin inhibitor Tmprss6 switches from iron overload to iron deficiency, overlapping the phenotype of Tmprss6−/− mice. An intriguing finding in the double KO mice that we generated was that only Tmprss6−/−Tfr2−/− mice developed erythrocytosis; this was not observed in Tmprss6−/−Tfr2LCKO mice.18 We hypothesized that this abnormality was accounted for by the loss of the erythroid Tfr2 in Tfr2−/−; thus, we proposed that TFR2 might be a limiting factor for erythropoiesis, particularly in conditions of iron restriction.19 However, because Tmprss6−/−Tfr2−/− mice have lower hepcidin than Tmprss6−/− and Tmprss6−/− animals with liver-specific deletion of Tfr2, it remained to be proven that Tfr2 deletion rather than iron deficiency or variable hepcidin levels explain the observed phenotype.
To unambiguously elucidate the function of TFR2 in erythropoiesis, particularly when iron-restricted, we generated a mouse model lacking Tfr2 in the erythroid precursors by transplanting lethally irradiated wild-type (WT) mice with the bone marrow from Tfr2−/− donors and manipulated the dietary iron content of the transplanted animals.
This model straightforwardly indicates that erythroid Tfr2 is essential to balance the red cell number according to the available iron, a crucial mechanism of adaptation to iron deficiency.
Methods
Mouse strains and bone marrow transplantation
Tfr2−/− mice (129S2 strain) were as previously described.12 Bone marrow (BM) cells were harvested from 12 weeks old female Tfr2−/− mice or control WT littermates. Five × 106 cells/mouse were injected IV into lethally irradiated (950 cGy) 8-week-old C57BL/6-Ly-5.1 male mice (Charles River). The animals were maintained in the animal facility of San Raffaele Scientific Institute (Milano, Italy) in accordance with the European Union guidelines. The study was approved by the Institutional Animal Care and Use Committee of the San Raffaele Scientific Institute.
Two months after BM transplantation (BMT), blood was collected by tail vein puncture into tubes containing 40 mg/mL EDTA for the evaluation of hematological parameters and donor/host chimerism. Mice were fed a standard diet (200 mg/kg carbonyl-iron, Scientific Animal Food and Engineering, SAFE, Augy, France) or an iron-deficient (ID) diet (iron content: 3 parts per million, SAFE), starting the last 3 weeks before being sacrificed and were sacrificed at 4 or 6 months after BMT. Blood was collected by tail vein puncture for hematological analysis, serum transferrin saturation, and serum erythropoietin (Epo) levels determination when mice were sacrificed. Livers and spleens were weighed, dissected, and immediately snap-frozen for RNA analysis or dried for tissue iron quantification. BM cells were harvested and processed for flow cytometry analysis and cell sorting.
Hematological analysis and tissue iron content
Hemoglobin (Hb) concentration, red blood cell (RBC) count, and erythrocyte indexes (mean corpuscular volume, mean corpuscular hemoglobin), transferrin saturation, and tissue iron content were determined by standard methods as described in detail in the supplemental Materials available on the Blood Web site.
Flow cytometry
For phenotypic analysis by flow cytometry, bone marrow cells were pretreated with rat-anti-mouse CD16/CD32 (BD Pharmingen) to block unspecific immunoglobulin binding, and subsequently stained with phycoerythrin rat anti-mouse Ter119 (BD Biosciences) and antigen-presenting cell rat anti-mouse CD44 (BD Biosciences) for 30 minutes in the dark at 4°C.
Donor/host chimerism was evaluated on mouse peripheral blood and BM cells from transplanted mice by using FITC-conjugated anti-mouse CD45.1 (BD Biosciences) and antigen-presenting cell–conjugated anti-mouse CD45.2 antibodies (BD Biosciences). Cells were analyzed at FACS Canto TM II.
Apoptosis was evaluated by using fluorescein isothiocyanate (FITC)_Annexin V Apoptosis Kit I (BD Pharmingen 556547). Briefly, cells were washed twice with cold phosphate-buffered saline and then resuspend in 1X Binding Buffer at a concentration of 1 × 10⁶ cells/mL. 1 × 10⁵ cells were incubated with 5 μL of FITC Annexin V and propidium iodide (PI) for 15 minutes at room temperature in the dark and then analyzed by flow cytometry within 1 hour.
Cell sorting
BM cells were pretreated with a rat anti-mouse CD16/CD32 (BD Pharmingen) to prevent unspecific immunoglobulin binding, and subsequently stained with FITC-conjugated rat anti-mouse Ter119 (BD Biosciences) and phycoerythrin-conjugated rat anti-mouse CD71 (BD Biosciences) for 30 minutes in the dark at 4°C. Cells were sorted by using MoFlo XDP cell sorter.
qRT-PCR
Quantitative reverse transcriptase–polymerase chain reaction (qRT-PCR) was performed on total liver and spleen and isolated BM cells as described in the supplemental Material.
Statistics
Data are presented as mean ± standard deviation. Unpaired 2-tailed Student t test was performed using GraphPad Prism 5.0 (GraphPad). P < .05 was considered statistically significant.
Results
Development of Tfr2BMKO model
To determine the impact of Tfr2 deletion on erythropoiesis, we generated a mouse model lacking Tfr2 specifically in the erythroid precursors by transplanting WT C57BL/6-Ly-5.1 mice with the BM cells obtained from Tfr2−/− donors. Two different groups of BM transplantation chimeras were generated by transplanting 5 × 10⁶ BM cells from Tfr2−/− mice (Tfr2BMKO) or from WT mice (controls) into lethally irradiated C57BL/6-Ly-5.1 mice (20 Tfr2BMKO and 20 controls). Because BM donor and recipient mice were different in the alternative allelic form of the pan-leukocyte antigen CD45, it was possible to identify the donor (CD45.2) or recipient (CD45.1) origin of the hematopoietic cells by flow cytometry analysis using specific antibodies. Treated mice were analyzed at sacrifice for donor/host chimerism in the BM. Engraftment of donor cells, calculated as the proportion of CD45.2+ to the total CD45+ cells, was nearly complete (98% to 99%) at 4 months after transplantation (supplemental Figure 1) and was maintained in animals treated with an ID diet.
Tfr2BMKO mice have low Hamp expression despite normal iron parameters
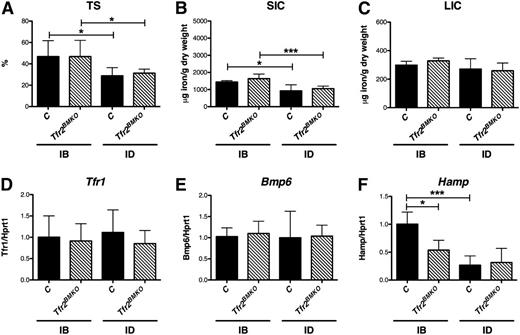
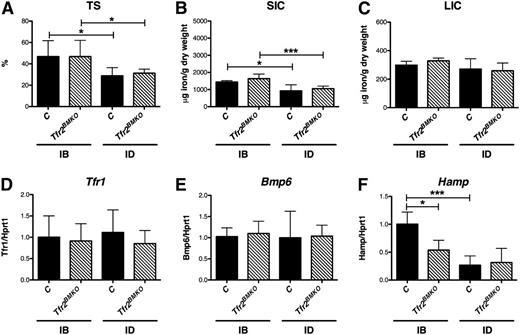
Four months after BMT, Tfr2BMKO mice maintained with an iron balanced (IB) diet for 3 weeks had TS and spleen (SIC) and liver (LIC) iron content comparable to controls (Figure 1A-C). This finding also was confirmed at 6 months after BMT (supplemental Figure 2). The ID diet induced a similar decrease of TS (Figure 1A) and SIC (Figure 1B) in both groups, whereas LIC was unchanged (Figure 1C), indicating a mild degree of ID. Compatible with LIC, the hepatic expression of the Tfr1 of WT and Tfr2BMKO mice was comparable and was not modulated by ID (Figure 1D). This was also the case for bone morphogenetic protein 6, the iron-responsive Hamp activator (Figure 1E).
Iron parameters and hepatic genes expression of Tfr2BMKO mice. Iron parameters and hepatic gene expression were determined in mice 4 months after transplantation with a WT (controls) or a Tfr2−/− (Tfr2BMKO) BM. Three weeks before being sacrificed a group of mice was fed an ID or an IB diet. Graphed in the figure are: (A) TS; (B) splenic and (C) hepatic non-heme iron content (SIC and LIC); (D) liver messenger RNA (mRNA) expression of Tfr1, (E) bone morphogenetic protein 6 (Bmp6) and (F) Hepcidin (Hamp) relative to hypoxanthine phosphoribosyltransferase 1 (Hprt1). mRNA expression ratio was normalized to an IB control mean value of 1. Mean values of 3 to 8 animals for genotype (controls, Tfr2BMKO) and treatment (IB, ID) are graphed. Error bars indicate standard error. Asterisks refer to a statistically significant difference. *P < .05; ***P < .005. C, controls.
Iron parameters and hepatic genes expression of Tfr2BMKO mice. Iron parameters and hepatic gene expression were determined in mice 4 months after transplantation with a WT (controls) or a Tfr2−/− (Tfr2BMKO) BM. Three weeks before being sacrificed a group of mice was fed an ID or an IB diet. Graphed in the figure are: (A) TS; (B) splenic and (C) hepatic non-heme iron content (SIC and LIC); (D) liver messenger RNA (mRNA) expression of Tfr1, (E) bone morphogenetic protein 6 (Bmp6) and (F) Hepcidin (Hamp) relative to hypoxanthine phosphoribosyltransferase 1 (Hprt1). mRNA expression ratio was normalized to an IB control mean value of 1. Mean values of 3 to 8 animals for genotype (controls, Tfr2BMKO) and treatment (IB, ID) are graphed. Error bars indicate standard error. Asterisks refer to a statistically significant difference. *P < .05; ***P < .005. C, controls.
Conversely, Hamp expression (Figure 1F) was reduced in Tfr2BMKO mice as compared with controls in mice kept an IB diet. Despite the normal hepatic iron content, ID induced a decrease of Hamp levels in control mice, but not in Tfr2BMKO animals, which have already low basal levels.
Tfr2BMKO mice have increased RBC and Hb levels
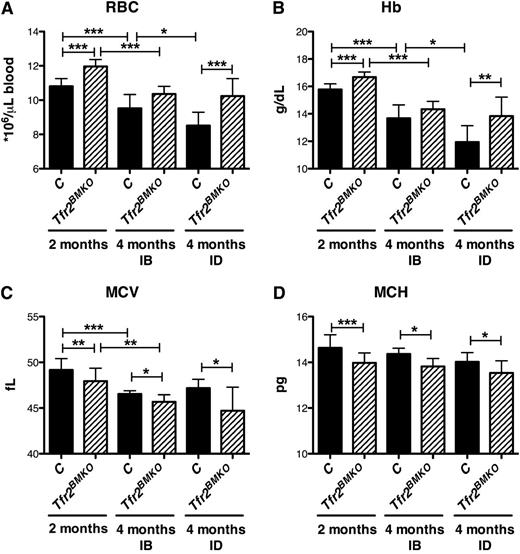
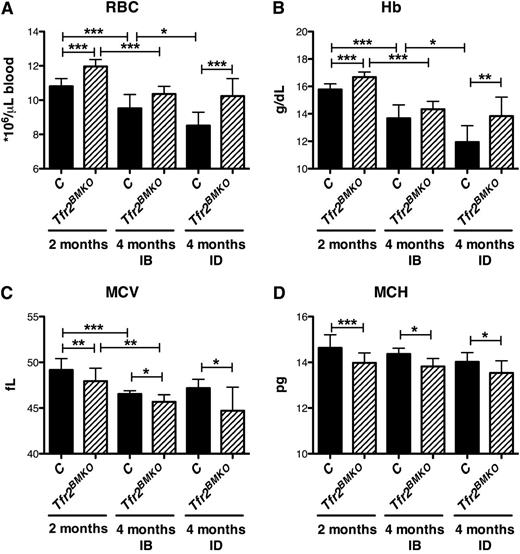
In normal iron (IB) conditions mice transplanted with Tfr2−/− BM cells had higher red blood cell (RBC) (Figure 2A; supplemental Figure 3A) counts and Hb levels (Figure 2B) than controls, although the differences were statistically significant only at early time points after BMT. In the cohort of mice fed with the ID diet, RBC and Hb levels were unmodified in Tfr2BMKO mice, whereas both parameters decreased in controls (Figure 2A-B), further strengthening the difference of hematological parameters between the 2 groups of mice. The increased RBC counts observed in Tfr2BMKO were accompanied by reduction of mean corpuscular volume (Figure 2C; supplemental Figure 3C) and mean corpuscular hemoglobin (Figure 2D; supplemental Figure 3D), both in IB and in ID.
Hematological parameters of Tfr2BMKO mice. The hematological parameters of mice were analyzed 2 and 4 months after transplantation with a WT (controls) or a Tfr2−/− (Tfr2BMKO) BM. Mice were fed as in legend to Figure 1 (see text for details). In the figure are graphed: (A) RBC; (B) Hb; (C) mean corpuscular volume (MCV) and (D) mean corpuscular hemoglobin (MCH). Mean values of 6 to 15 animals for genotype (controls, Tfr2BMKO), time after BMT (2 or 4 months), and treatment (IB, ID) are graphed. Error bars indicate standard error. Asterisks refer to a statistically significant difference. *P < .05; **P < .01; ***P < .005.
Hematological parameters of Tfr2BMKO mice. The hematological parameters of mice were analyzed 2 and 4 months after transplantation with a WT (controls) or a Tfr2−/− (Tfr2BMKO) BM. Mice were fed as in legend to Figure 1 (see text for details). In the figure are graphed: (A) RBC; (B) Hb; (C) mean corpuscular volume (MCV) and (D) mean corpuscular hemoglobin (MCH). Mean values of 6 to 15 animals for genotype (controls, Tfr2BMKO), time after BMT (2 or 4 months), and treatment (IB, ID) are graphed. Error bars indicate standard error. Asterisks refer to a statistically significant difference. *P < .05; **P < .01; ***P < .005.
Terminal erythropoiesis is increased in Tfr2BMKO mice
In adult organisms, mature erythrocytes are the terminally differentiated cellular product derived from hematopoietic stem and progenitor cells. These cells undergo a series of lineage choice fate decisions, ultimately committing to the erythroid lineage and beginning erythropoiesis. Traditionally, erythropoiesis has been divided into 3 stages: early erythropoiesis, terminal erythroid differentiation, and reticulocyte maturation. Terminal erythroid differentiation begins with proerythroblasts differentiating into basophilic, polychromatic, and then orthochromatic erythroblasts that enucleate to become reticulocytes. In the final stage of erythropoiesis, reticulocytes mature into discoid erythrocytes, losing intracellular organelles.
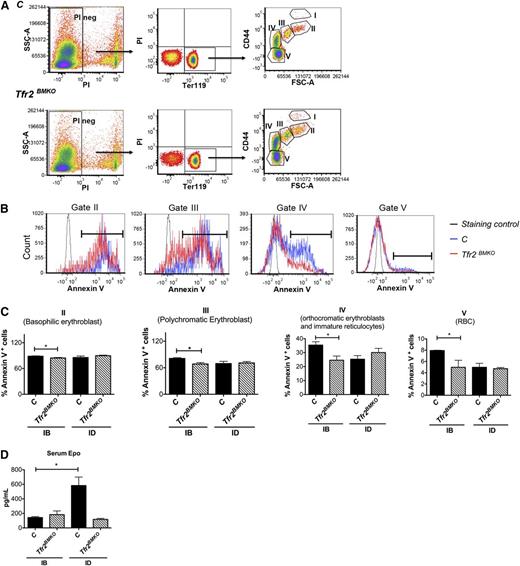
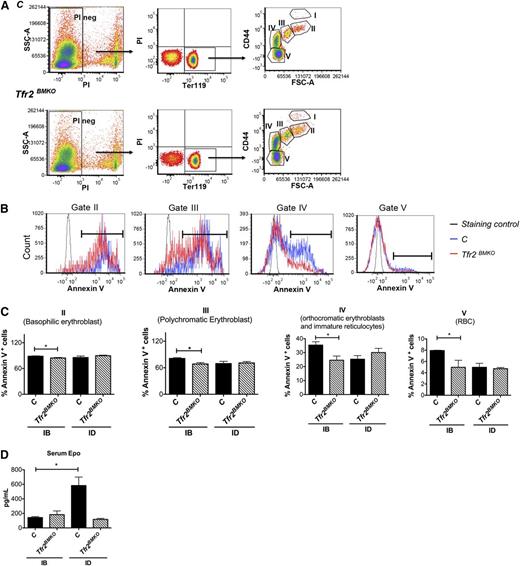
Viable murine erythroblasts at distinct stages of terminal differentiation were analyzed by flow cytometry using Ter119 and CD44 antibodies staining on BM cells and forward scatter (reflecting cell size), as described previously.20 The expression levels of CD44 as a function of forward scatter (FSC) in all Ter119+ cells separate 5 distinct clusters: proerythroblasts (I), basophilic erythroblasts (II), polychromatic erythroblasts (III), orthochromatic erythroblasts and immature reticulocytes (IV), and mature red cells (V) (Figure 3A).
Analysis of erythropoiesis and serum Epo levels of Tfr2BMKO mice. Mice were analyzed 4 months after transplantation with a WT (controls) or a Tfr2−/− (Tfr2BMKO) BM. Mice were fed as in legend to Figure 1 (see text for details). (A) Representative gating strategy for analysis of Ter119 subpopulations in controls and Tfr2BMKO mice. Viable cells (impermeable to PI) from BM were analyzed for Ter119/CD44 expression. Ter119 were gated and further analyzed with respect to FSC and CD44 surface expression for subpopulation composition (gated cluster I-V). (B) The survival of erythroblasts in the BM was examined for annexin V binding to assess apoptosis. Representative histograms of annexin V binding in basophilic (gate cluster II), polychromatic (gate cluster III), orthochromatic erythroblast (gate cluster IV), and RBC (gate cluster V). Staining control is a sample in which PI and annexin V were omitted. (C) Histogram represents percentage of apoptotic cells in basophilic (gate cluster II), polychromatic erythroblasts (gate cluster III), orthochromatic erythroblast (gate cluster IV), and RBC (gate cluster V). (D) Serum Epo levels. Mean values of 3 to 9 animals for genotype and treatment (control IB, Tfr2BMKO IB, control ID, Tfr2BMKO ID) are graphed. Bars indicate standard error. Asterisks refer to a statistically significant difference. *P < .05.
Analysis of erythropoiesis and serum Epo levels of Tfr2BMKO mice. Mice were analyzed 4 months after transplantation with a WT (controls) or a Tfr2−/− (Tfr2BMKO) BM. Mice were fed as in legend to Figure 1 (see text for details). (A) Representative gating strategy for analysis of Ter119 subpopulations in controls and Tfr2BMKO mice. Viable cells (impermeable to PI) from BM were analyzed for Ter119/CD44 expression. Ter119 were gated and further analyzed with respect to FSC and CD44 surface expression for subpopulation composition (gated cluster I-V). (B) The survival of erythroblasts in the BM was examined for annexin V binding to assess apoptosis. Representative histograms of annexin V binding in basophilic (gate cluster II), polychromatic (gate cluster III), orthochromatic erythroblast (gate cluster IV), and RBC (gate cluster V). Staining control is a sample in which PI and annexin V were omitted. (C) Histogram represents percentage of apoptotic cells in basophilic (gate cluster II), polychromatic erythroblasts (gate cluster III), orthochromatic erythroblast (gate cluster IV), and RBC (gate cluster V). (D) Serum Epo levels. Mean values of 3 to 9 animals for genotype and treatment (control IB, Tfr2BMKO IB, control ID, Tfr2BMKO ID) are graphed. Bars indicate standard error. Asterisks refer to a statistically significant difference. *P < .05.
In the IB condition, the percentage of BM Ter119+ nucleated cells was higher in Tfr2BMKO mice than in controls (22.97 ± 1.61% vs 16.08 ± 1.72%, respectively; P < .05). In mice fed the ID diet, the percentage of Ter119+ cells was comparable between the 2 groups (Table 1). Considering the differentiation stages, in IB we observed a higher proportion of stage II, III, and IV erythroblasts (Table 1) and reticulocytes in Tfr2BMKO mice than in controls (data not shown). The ID diet increased the proportion of cells in stage II and III only in controls (Table 2).
Erythroid precursors of Tfr2BMKO mice show reduced apoptosis in the presence of normal Epo levels
To evaluate the apoptosis state of the maturing erythroblasts, we examined the survival of BM erythroblasts on the basis of their annexin V binding. Freshly isolated BM cells from controls and Tfr2BMKO mice were stained with antibodies against Ter119 and CD44, incubated with annexin and the viability dye PI, and examined by flow cytometry. Viable cells were analyzed for Ter119, CD44 expression and annexin V binding.
Four months after BMT, Tfr2BMKO mice fed an IB diet showed reduced apoptosis of the erythroid precursors (basophilic, polychromatic, and orthochromatic erythroblasts) and mature RBC, as compared with control mice (Figure 3B-C). This difference was not observed at a later time point (6 months) (supplemental Figure 4A), when the RBC count remained elevated but Hb levels normalized. ID did not influence the rate of apoptosis of Tfr2BMKO erythroblasts. On the contrary, the percentage of apoptotic erythroid precursors decreased in control mice, reaching the levels observed in Tfr2BMKO animals (Figure 3C).
Tfr2BMKO mice show signs of splenic stress erythropoiesis in the presence of normal Epo levels
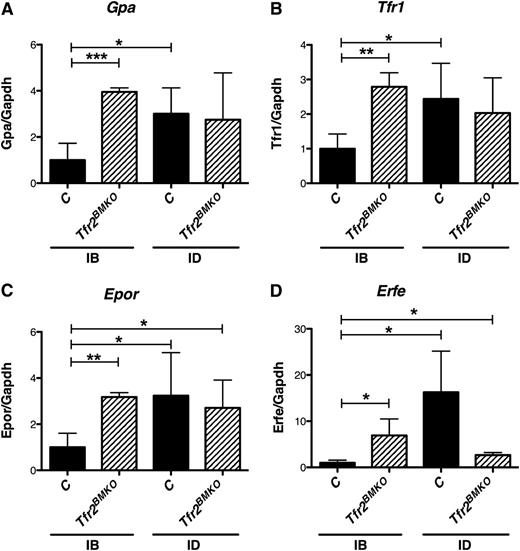
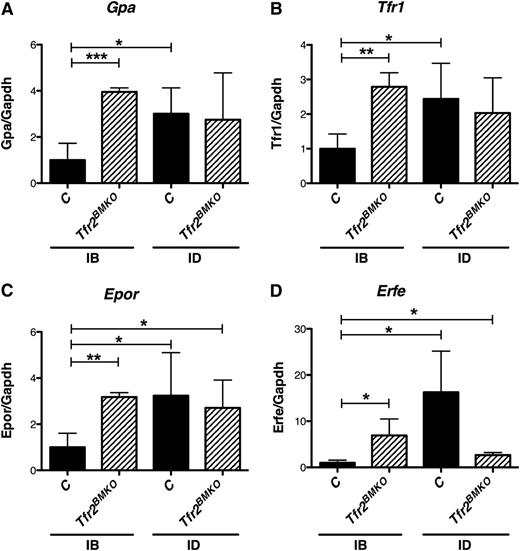
Four months after BMT, the splenic expression of erythroid specific genes, like glycophorin A (Figure 4A), Tfr1(Figure 4B) Epor (Figure 4C), and erythroferrone21 (Erfe; Figure 4D) was higher in Tfr2BMKO than in control mice maintained in IB conditions, suggesting that stress erythropoiesis takes place in the spleen of Tfr2BMKO. In ID, the level of expression was unchanged in Tfr2BMKO mice and increased in control animals, reaching levels observed in mice lacking Tfr2. Accordingly other Epo-EpoR–dependent Janus kinase 2/signal transducer and activator of transcription 5 (Stat5) signaling pathway target genes as B-cell lymphoma extra large (Bcl-xL)22-24 (supplemental Figure 5A) and serine peptidase inhibitor, clade A, member 3G (Serpina3g)25 (supplemental Figure 5B) was upregulated, whereas cyclin G2 (Ccng2) (supplemental Figure 5C) was downregulated, as reported.25
Erythroid genes are expressed in the spleen of Tfr2BMKO mice. The expression of erythroid genes was analyzed in the spleen of mice 4 months after transplantation with a WT (controls) or a Tfr2−/− (Tfr2BMKO) BM. Mice were fed as in legend to Figure 1 (see text for details). In the figure are graphed: (A) splenic mRNA expression of glycophorin A (Gpa), (B) Tfr1, (C) Epor, and (D) splenic mRNA expression of Erfe relative to glyceraldehyde 3-phosphate dehydrogenase (Gapdh). mRNA expression ratio was normalized to an IB control mean value of 1. Mean values of 3 to 8 animals for genotype (controls, Tfr2BMKO) and treatment (IB, ID) are graphed. Error bars indicate standard error. Asterisks refer to a statistically significant difference. *P < .05; **P < .01; ***P < .005.
Erythroid genes are expressed in the spleen of Tfr2BMKO mice. The expression of erythroid genes was analyzed in the spleen of mice 4 months after transplantation with a WT (controls) or a Tfr2−/− (Tfr2BMKO) BM. Mice were fed as in legend to Figure 1 (see text for details). In the figure are graphed: (A) splenic mRNA expression of glycophorin A (Gpa), (B) Tfr1, (C) Epor, and (D) splenic mRNA expression of Erfe relative to glyceraldehyde 3-phosphate dehydrogenase (Gapdh). mRNA expression ratio was normalized to an IB control mean value of 1. Mean values of 3 to 8 animals for genotype (controls, Tfr2BMKO) and treatment (IB, ID) are graphed. Error bars indicate standard error. Asterisks refer to a statistically significant difference. *P < .05; **P < .01; ***P < .005.
The expression of these erythroid genes in the spleen of Tfr2BMKO is compatible with stress erythropoiesis and in the absence of increased Epo levels is in agreement with an increased Epo sensitivity.
Tfr2BMKO erythroid precursors have increased expression of Epo target genes
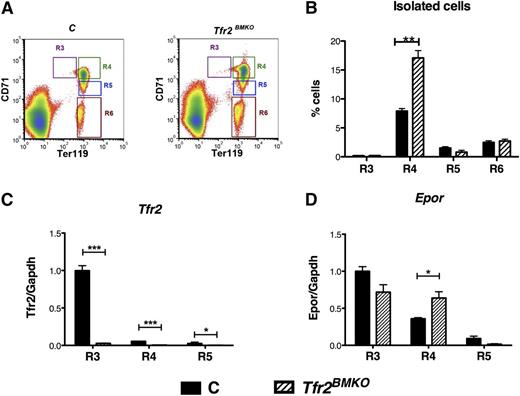
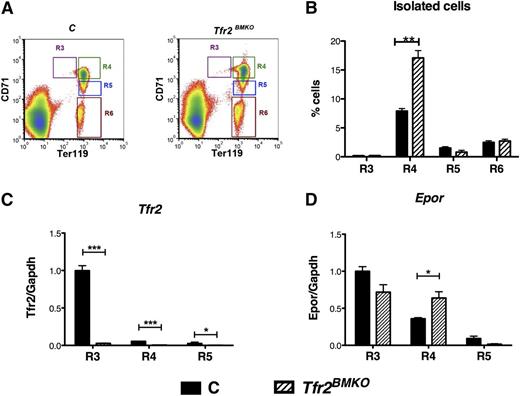
To study the expression of Epor and Epo target genes in specific erythroid subpopulations, BM cells from WT and Tfr2BMKO mice were sorted based on the relative expression levels of Ter119 and CD71 (Tfr1). As described previously,24,26 by using this sorting strategy, basophilic and most of polychromatic erythroblasts CD71high/Ter119high (corresponding to gate II and gate III using CD44/Ter119), which are both increased in Tfr2BMKO mice, can be isolated and further analyzed as a single population. Four different populations of nucleated cells were sorted: CD71high/Ter119low, corresponding to proerythroblasts (R3); CD71high/Ter119high containing a mixture of basophilic and polychromatic erythroblasts (R4), CD71intermediate/Ter119high polychromatic erythroblasts (R5), and CD71low/Ter119high corresponding to orthochromatic erythroblasts (R6) (Figure 5A). The percentage of cells in stage R4 was higher in Tfr2BMKO mice than in control mice (Figure 5B), further proving the increased proportion of erythroid precursors observed by Ter119 and CD44 expression analysis (see the previous section).
Analysis of Tfr2 and Epor in isolated erythroblasts. BM cells from control and Tfr2BMKO mice maintained with an IB diet were sorted as described in the text. (A) Gating strategy for freshly isolated bone marrow erythroid subsets: R3, R4, R5, and R6. Nucleated cells were selected and subsets gated based on Ter119 and CD71. (B) Flow cytometry analysis of BM cells stained with antibodies against Ter119 and CD71. Histograms show the percentage of cells in stage R3, R4, R5, and R6. The number of events is reported in supplemental Table 3. (C-D) mRNA expression of Tfr2 (C) and Epor (D) relative to Gapdh in the R3, R4, and R5 stages. mRNA expression ratio was normalized to the R3 control mean value of 1. mRNA expression ratio was normalized to the control mean value of 1. Mean values of 3 samples for genotype (controls, Tfr2BMKO) and stage (R3, R4, R5, R6) are graphed. Error bars indicate standard error. Asterisks refer to a statistically significant difference. *P < .05; ***P < .005.
Analysis of Tfr2 and Epor in isolated erythroblasts. BM cells from control and Tfr2BMKO mice maintained with an IB diet were sorted as described in the text. (A) Gating strategy for freshly isolated bone marrow erythroid subsets: R3, R4, R5, and R6. Nucleated cells were selected and subsets gated based on Ter119 and CD71. (B) Flow cytometry analysis of BM cells stained with antibodies against Ter119 and CD71. Histograms show the percentage of cells in stage R3, R4, R5, and R6. The number of events is reported in supplemental Table 3. (C-D) mRNA expression of Tfr2 (C) and Epor (D) relative to Gapdh in the R3, R4, and R5 stages. mRNA expression ratio was normalized to the R3 control mean value of 1. mRNA expression ratio was normalized to the control mean value of 1. Mean values of 3 samples for genotype (controls, Tfr2BMKO) and stage (R3, R4, R5, R6) are graphed. Error bars indicate standard error. Asterisks refer to a statistically significant difference. *P < .05; ***P < .005.
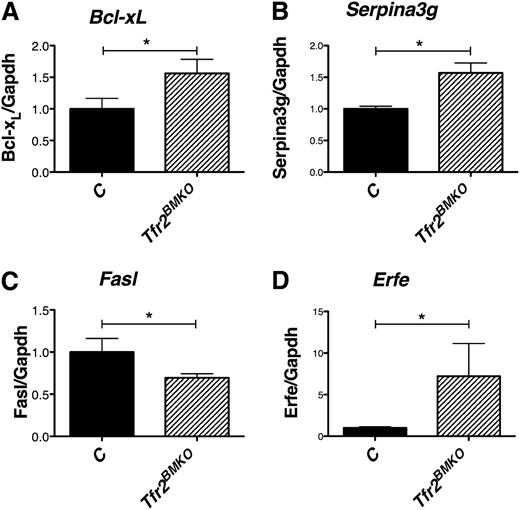
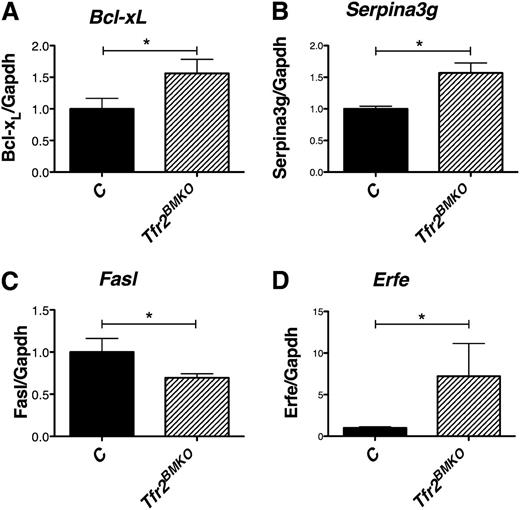
By evaluating the expression of Tfr2 (Figure 5C) in R3, R4, and R5 stage cells, we confirmed that erythroid cells derived from Tfr2BMKO mice do not express Tfr2. In addition, we showed that in controls, both Tfr2 (Figure 5C) and Epor genes (Figure 5D) are highly expressed in R3 and then downregulated during maturation. TFR2 and EPOR show a similar pattern of expression, as observed17 ; interestingly, the downregulation of Epor expression was delayed in the absence of Tfr2, occurring only at R5 stage (Figure 5D). As for the expression profile of the Epo-Epor signaling target genes, R4 erythroblasts from Tfr2BMKO mice, compared with cells derived from mice transplanted with WT BM, expressed higher levels of the Epo-Stat5 target genes Bcl-xL (Figure 6A) and Serpina3g (Figure 6B), lower levels of the apoptotic protein inhibited by the phosphatidylinositol 3-kinase/Akt pathway26,27 Fas ligand (Fasl; Figure 6C) and similar levels of Baculoviral IAP repeat-containing protein 2 (Birc2 or cIap2)28 (data not shown).
Analysis of Epo target genes in basophilic and polychromatic erythroblasts (R4). (A) mRNA expression of Bcl-xL, (B) Serpina3G, (C) Fasl, and (D) Erfe relative to Gapdh in R4 erythroblasts. mRNA expression ratio was normalized to the control mean value of 1. Mean values of 3 samples for genotype (controls, Tfr2BMKO) are graphed. Error bars indicate standard error. Asterisks refer to a statistically significant difference. *P < .05; ***P < .005.
Analysis of Epo target genes in basophilic and polychromatic erythroblasts (R4). (A) mRNA expression of Bcl-xL, (B) Serpina3G, (C) Fasl, and (D) Erfe relative to Gapdh in R4 erythroblasts. mRNA expression ratio was normalized to the control mean value of 1. Mean values of 3 samples for genotype (controls, Tfr2BMKO) are graphed. Error bars indicate standard error. Asterisks refer to a statistically significant difference. *P < .05; ***P < .005.
Erythroblasts from Tfr2BMKO mice produce high levels of the erythroid regulator Erfe
Because expanded erythropoiesis signals iron needs through the erythroid regulator leading to hepcidin suppression, considering that hepcidin is strongly reduced in Tfr2BMKO mice, and because of the presence of spleen erythropoiesis, we analyzed the splenic and erythroblast expression of the candidate erythroid regulator erythroferrone.
Erfe is a protein belonging to the family of tumor necrosis factor-α produced by maturing erythroblasts, recently proposed as the early suppressor of hepcidin after the physiological expansion of erythropoiesis that follows bleeding or Epo treatment.21 Erfe is a target of the Epo-induced Janus kinase 2-Stat5 signaling pathway and is produced during erythroblast terminal differentiation. We observed that IB Tfr2BMKO mice express higher levels of Erfe than control mice in the spleen (Figure 4D), whereas, in ID, Erfe levels are unmodified in Tfr2BMKO mice but increase in controls, reaching the levels observed in mice lacking Tfr2. We confirm that also R4 erythroid precursors from Tfr2BMKO produce higher levels of Erfe than controls (Figure 6D).
Discussion
TFR2 mutations in humans lead to iron overload with low hepcidin in the absence of erythroid abnormalities,1,8 highlighting only the receptor hepatic function. Consequently, most efforts have been concentrated into unraveling the liver role of TFR2 in hepcidin control and the significance of the TFR2 erythroid expression has remained unexplained. Although molecular mechanisms remain incompletely clarified, defective TFR2 impairs hepcidin upregulation in response to increased holo-TF both in humans29 and in mice.30 This is clearly related to the TFR2 ability to bind iron-loaded TF and emphasizes its function as a liver sensor of circulating iron excess.
A major advance in deciphering the extrahepatic role of TFR2 was the serendipitous identification of its partnership with EPOR.17 Foretnikova et al suggested that the TFR2/EPOR association stabilizes EPOR on the cell surface, although TFR2 does not directly bind EPO and does not seem to interfere with the EPO binding to EPOR. They also showed that silencing TFR2 in vitro delays erythroid differentiation. However, these results did not provide clear insights into its function in erythropoiesis, and the consequences of TFR2 ablation in vivo remained uncertain. Increased Hb levels were found in Tfr2−/− mice as compared with WT littermates, but this finding was ascribed to the concomitant iron overload.12,18 An in-depth analysis revealed that only mice with ubiquitous Tfr2 deletion are characterized by increased Hb levels, whereas Tfr2 liver-specific KO12,18 are not, suggesting that high Hb levels might result from the absence of Tfr2 in the erythroid compartment, rather than from the increased iron supply.
In this article, we directly analyzed the erythroid function of TFR2, showing that it has a crucial role in limiting erythropoiesis and avoiding erythrocytosis, a function disguised in iron overload but evident in iron deficiency. At the same time, we discovered that iron deficiency mimics TFR2 deletion in the erythroid compartment.
We started with the observation that erythrocytosis develops in the Tfr2-Tmprss6 double KO mice, but not in the liver-specific Tfr2-Tmprss6 double KO18 animals, although both models showed the same degree of iron deficiency. This led us to propose that TFR2 might limit the erythrocyte numbers especially in iron deficiency.19
Our observation agrees with the results of genomewide association studies, which have identified association of TFR2 genetic variants with RBC number31 and hematocrit and Hb levels,32 suggesting that TFR2 may be involved in the control of erythropoiesis.
To unravel the modalities of this control, we generated a straightforward murine model characterized by specific deletion of Tfr2 in the BM (Tfr2BMKO), where its expression is mostly restricted to the erythroid lineage.4,16 Loss of Tfr2 in the erythroid compartment remarkably increased the erythroid precursor frequency and their terminal differentiation, especially the proportion of maturing erythroblasts and reticulocytes. This was accompanied by decreased rate of apoptosis of cells during the phases of maturation and by signs of stress erythropoiesis (increased Ter119+ cells in the spleen). We cannot exclude a role for Tfr2 in early erythropoiesis because that was not investigated, but we consider it unlikely, because the first stage of terminal differentiation (proerythroblasts) was not expanded in Tfr2BMKO. The changes observed suggest the effect of EPO stimulation33-37 but, surprisingly, serum Epo levels of Tfr2BMKO were not increased. Considering that the survival of the erythroblasts depends on EPO38 and that TFR2 is an EPOR partner,17 we speculate that the genetic loss of Tfr2 increases the EPO sensitivity of erythroid precursor cells. We found an increased expression of several Epo target genes (as Bcl-xL, Fasl, Serpina3g, Ccng2, Epor, and Erfe) in Tfr2−/− erythroblasts in the presence of normal Epo levels that is in agreement with this interpretation. We also considered that Epor expression—that in the absence of reliable anti-Epor antibodies we analyzed only at transcriptional level—was maintained longer in Tfr2−/− erythroblasts during maturation, thus favoring a prolonged Epo responsiveness.
The second surprising and unexpected finding of our model is the observation that the erythroid maturation of control mice (transplanted with a WT BM) fed an ID diet becomes similar to that observed in iron-replete Tfr2BMKO mice. The degree of ID reached with 3 weeks of an iron-poor diet was mild. However, control animals develop anemia with high levels of Epo, whereas the ID diet has no effect on the erythropoiesis of Tfr2BMKO mice, whose Hb levels, RBC number, and percentage of erythroid precursors remain unmodified.
The finding that the erythropoiesis of ID mice with high Epo mimics that of Tfr2BMKO mice with normal Epo and that Tfr2-deficient erythropoiesis is unmodified in ID is another point favoring the suggested increased Epo sensitivity of Tfr2BMKO erythroid precursors.
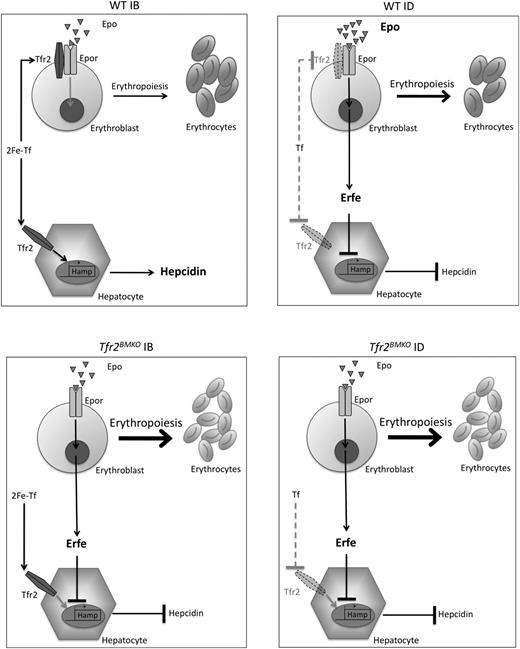
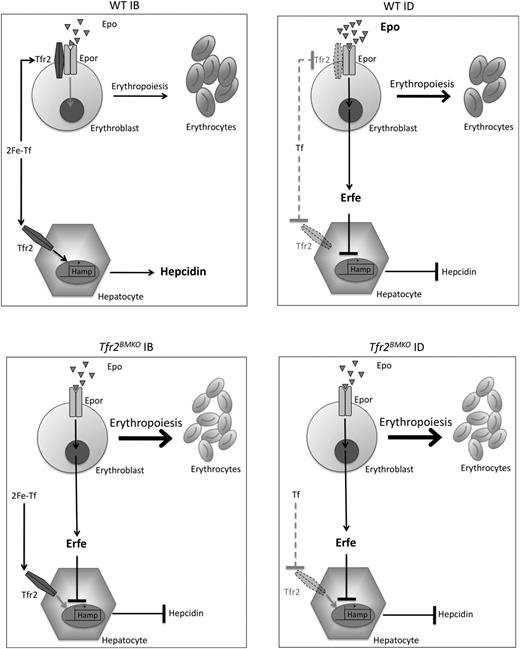
All of these data may be compatible with our recent finding that TFR2, as TFR1, is shed from plasma membrane when not stabilized by the ligand holo-TF, whose levels are especially low in ID. This has been documented both in hepatoma-derived cells, in erythroid cell lines, and in cultures of primary erythroid cells (Pagani et al, in revision). Findings of the present article suggest that loss of Tfr2 mimics ID. We speculate that in IB, Tfr2 might sequester EpoR on the plasma membrane to avoid excessive erythropoiesis expansion (Figure 7).
Model of regulation of erythropoiesis and hepcidin by Tfr2. Regulation of erythropoiesis and hepcidin in WT mice in normal iron status (upper left panel) and in ID (upper right panel). Regulation of erythropoiesis and hepcidin in the absence of Tfr2 in normal conditions (lower left panel) and in ID (lower right panel). Arrow thickness indicates activity or binding. Bold character indicates increase concentration. Dotted lines indicate lack of binding. Dotted Tfr2 represents membrane destabilization from a lack of the ligand (2Fe-Tf). Tf, apotransferrin; 2Fe-Tf, diferric transferrin.
Model of regulation of erythropoiesis and hepcidin by Tfr2. Regulation of erythropoiesis and hepcidin in WT mice in normal iron status (upper left panel) and in ID (upper right panel). Regulation of erythropoiesis and hepcidin in the absence of Tfr2 in normal conditions (lower left panel) and in ID (lower right panel). Arrow thickness indicates activity or binding. Bold character indicates increase concentration. Dotted lines indicate lack of binding. Dotted Tfr2 represents membrane destabilization from a lack of the ligand (2Fe-Tf). Tf, apotransferrin; 2Fe-Tf, diferric transferrin.
A high number of RBCs in relation with Hb levels is a feature of ID that explains the reduced Hb content per cell (mean corpuscular hemoglobin). This occurs to optimize Hb production, to ensure oxygen transport, and to provide the best metal usage in conditions of iron restriction. Small red cells may have a normal or only slightly reduced lifespan, as demonstrated by 51Cr labeling red cells in humans.39 Thus, TFR2 acts to produce efficient red cells but at the same time to save iron when its supply is limited as a means of maintaining a global body iron economy. This function is difficult to disclose when TFR2 is mutated in hemochromatosis type 3, because high transferrin saturation stabilizes TFR2 on plasma membrane and excess iron modifies erythropoiesis. The TFR2 hepatic function appears dominant over its erythroid function.
If TFR2 senses the degree of iron-loaded transferrin simultaneously in BM and hepatocytes, an important implication is that TFR2 adapts hepcidin and erythropoiesis mutual needs (Figure 7). Sensing the degree of available circulating iron (expressed as transferrin saturation), TFR2 would represent a natural link between the 2 distant tissues, although it does not play the role of erythroid regulator.40-42 Indeed, Tfr2BMKO mice have reduced Hamp levels secondary to erythropoiesis expansion and in the absence of alterations of systemic iron homeostasis. It is likely that the increased iron release, resulting from low hepcidin levels, is used by the expanded erythropoiesis, leaving iron parameters unmodified. Among the proposed erythroid regulators able to suppress hepcidin production, we found that the transcription of the recently discovered erythroid regulator Erfe21 was upregulated both in total spleen and in erythroid precursors isolated from Tfr2BMKO mice. This finding is in agreement with the proposed increased Epo sensitivity of Tfr2−/− erythroblasts, because Erfe is an Epo-target gene.21 Erfe transcription is also enhanced in control animals kept in ID, again strengthening the concept that Tfr2-deficient erythropoiesis mimics the adaptation that occurs in ID, because both conditions are characterized by low hepcidin levels.
In conclusion, we have identified a new mechanism for regulating erythropoiesis in an ID manner. TFR2 is a modulator of erythropoiesis, in keeping with its role of EPOR partner. We speculate that, by modulating the EPO sensitivity of the erythroid precursors, TFR2 may act as a control system of RBC number to maintain a correct balance between their production and the available iron.
The online version of this article contains a data supplement.
There is an Inside Blood Commentary on this article in this issue.
The publication costs of this article were defrayed in part by page charge payment. Therefore, and solely to indicate this fact, this article is hereby marked “advertisement” in accordance with 18 USC section 1734.
Acknowledgments
This work was supported in part by the Telethon Onlus Foundation (grant GGP12025), Ricerca Finalizzata (RF-2010-2312048) Ministero Sanità, Ministero dell’Istuxione dell’Universta e della Ricerca Progetto di Rilevante Interesse Nazionale (MIUR-PRIN) (2010-2011) (C.C.); and Telethon Onlus Foundation, Telethon Institute for Gene Therapy Core Grant, Ricerca Finalizzata (2010 RF10-17), Ministero Sanità, (G.F.), and MIUR-FIRB (2008 RBFR087JCI_002) (M.R.L.).
Authorship
Contribution: A.N. designed the experimental work, performed research, analyzed data, and wrote the paper; M.R.L. performed research, analyzed data, and cowrote the paper; M.R., G.M., and A.P. performed research and analyzed data; L.S. contributed to the experimental design and to analyzing the data; G.F. contributed to the experimental design, to analyzing the data, and to writing the manuscript; C.C. designed research and critically reviewed the paper; and all authors approved the final version of the manuscript.
Conflict-of-interest disclosure: The authors declare no competing financial interests.
Correspondence: Clara Camaschella, Vita Salute San Raffaele University, IRCCS Ospedale San Raffaele, Via Olgettina, 60, 20132 Milano, Italy; e-mail: camaschella.clara@hsr.it.
References
Author notes
A.N. and M.R.L. contributed equally to this study.

