Abstract
Research Objectives: The Centers for Medicare and Medicaid Services (CMS) uses hospital readmissions as an indicator of quality of care during the index hospitalization. Patients with hematologic malignancies are at high risk of abnormal blood glucose levels, in particular hyperglycemia. Hyperglycemia during hematopoietic stem cell transplantation (HCT) is associated with adverse outcomes such as infection, delayed engraftment, and prolonged length of stay. Little is known about the association between pre-stem cell infusion glucose patterns as a prognostic indicator of patient outcomes.
Methods: This single institution retrospective study using electronic health records (EHR) investigated the association of mean glucose levels prior to stem cell infusion with length of stay (LOS), 30 and 90 day readmissions, and time to engraftment in 739 patients undergoing bone marrow transplant between January 1, 2009 and December 31, 2013. Data was sorted and reported with the assistance of our BMT data management team and our institution's Data Warehouse who procured information from EPIC, EPIC's predecessor, and hospital-linked databases. Data were analyzed using descriptive statistics, Kruskal-Wallis, and Chi-square analyses.
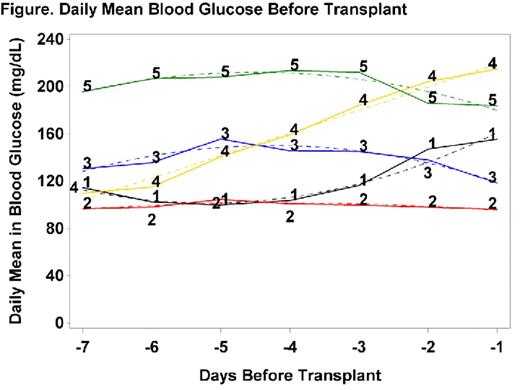
Results: Mean age was 57+ 14. The majority of population was male (55%) and was racially and ethnically mixed (White 38%, African American 23%, Hispanic 6%, Asian 7%, Other 21%). Twenty two percent of patients had a diagnosis of diabetes (ICD9 250.X). A review of mean glucose levels prior to stem cell infusion in 619 evaluable patients identified five unique patterns (see Figure), characterized by glucose levels 7 days prior to infusion (normal/moderate/high) and trend over time (stable/increasing): normal/stable (n=445), high/stable (n=16), moderate/increasing (n=75), high/ increasing (n=28), and moderate/stable (n=55). Kruskal-Wallis and Chi-square analyses showed that a normal/ stable pattern of daily mean blood glucose prior to stem cell infusion was associated with significantly lower LOS (p<0.0001) and lower 90 day readmission (p=0.0212).
Conclusions: Our study indicates that the pattern of pre-transplant blood glucoses may be a prognostic indicator of adverse outcomes in patients undergoing HCT, in particular LOS and 90 day readmission rate. This has important implications for health care utilization. The mechanism to this association of blood glucose patterns and increased use of health services is currently being investigated further by our team. While study limitations include its retrospective nature and that this is a single institution study, its strengths include a robust sample size and use of EHR. EHR could be used further as a modality to help identify those patients who might merit endocrine consults and stricter glucose control to limit LOS and readmission rate. EHR may also help to pinpoint the etiology to the hyperglycemia, such as exposure to steroids or other agents as well as more physiologic causes. In addition, future studies may incorporate biomarkers to help predict patient outcome in relation to glucose levels.
Above are the trajectories of 619 evaluable patients categorized into five unique groups of patients each with a different trend in blood glucose values 7 days prior to transplant. Group 4 starts at around 100 and worsens up to transplant. Group 5 starts out high at 500 and stays high until transplant. Group 2 starts out at 100 and remains there until transplant. Group 3 starts at 120 and stays there. Group 1 starts at 120 and increases to 160. As you can see from the table under the graph most patients are in group 2 (72%).
| . | Pre-Transplant BG Trajectory Group . | P-value . | ||||
|---|---|---|---|---|---|---|
| 1 | 2 | 3 | 4 | 5 | ||
| LOS Median [Q1-Q3] | 23.69 [18.27-38.28] | 20.12 [16.18-26.19] | 24.04 [20-29.89] | 23.67 [20.77-26.93] | 22.56 [19.72-28.05] | <0.0001 |
| Time to engraftment among engrafted* Median [Q1-Q3] | 11 [10.5-12] | 11 [10-12] | 11 [10-12] | 11 [11-12] | 11 [9-12] | 0.2530 |
| 30 Day Readmission No Yes | 52 (69%) 23 (31%) | 355 (80%) 90 (20%) | 38 (69%) 17 (31%) | 20 (71%) 8 (29%) | 12 (75%) 4 (25%) | 0.1410 |
| 90 Day Readmission No Yes | 39 (52%) 36 (48%) | 300 (67%) 145 (33%) | 30 (55%) 25 (45%) | 14 (50%) 14 (50%) | 11 (69%) 5 (31%) | 0.0212 |
No relevant conflicts of interest to declare.
Author notes
Asterisk with author names denotes non-ASH members.


