Key Points
High-risk SMM patients’ immune status is mildly impaired as compared with age-matched healthy individuals.
High-risk SMM patients can be effectively immunomodulated by lenalidomide, even when combined with low-dose dexamethasone.
Abstract
There is significant interest in immunotherapy for the treatment of high-risk smoldering multiple myeloma (SMM), but no available data on the immune status of this particular disease stage. Such information is important to understand the interplay between immunosurveillance and disease transformation, but also to define whether patients with high-risk SMM might benefit from immunotherapy. Here, we have characterized T lymphocytes (including CD4, CD8, T-cell receptor γδ, and regulatory T cells), natural killer (NK) cells, and dendritic cells from 31 high-risk SMM patients included in the treatment arm of the QUIREDEX trial, and with longitudinal peripheral blood samples at baseline and after 3 and 9 cycles of lenalidomide plus low-dose dexamethasone (LenDex). High-risk SMM patients showed at baseline decreased expression of activation-(CD25/CD28/CD54), type 1 T helper-(CD195/interferon-γ/tumor necrosis factor-α/interleukin-2), and proliferation-related markers (CD119/CD120b) as compared with age-matched healthy individuals. However, LenDex was able to restore the normal expression levels for those markers and induced a marked shift in T-lymphocyte and NK-cell phenotype. Accordingly, high-risk SMM patients treated with LenDex showed higher numbers of functionally active T lymphocytes. Together, our results indicate that high-risk SMM patients have an impaired immune system that could be reactivated by the immunomodulatory effects of lenalidomide, even when combined with low-dose dexamethasone, and support the value of therapeutic immunomodulation to delay the progression to multiple myeloma. The QUIREDEX trial was registered to www.clinicaltrials.gov as #NCT00480363.
Introduction
Multiple myeloma (MM) is an incurable plasma cell (PC) malignancy characterized by preceding benign stages termed monoclonal gammopathy of undetermined significance (MGUS) and smoldering MM (SMM). It is of interest that no major differences have been described for the genetic and phenotypic profiles of clonal PCs during disease evolution from MGUS to SMM and treatment-requiring MM.1-8 However, an intrinsic relation between disease progression and a progressively impaired immune system has been suggested,9,10 and among the risk factors that predict transformation of SMM into treatment-requiring MM is the presence of immunoparesis.11 Accordingly, extensive characterization of bone marrow (BM) and peripheral blood (PB) samples from MGUS and MM patients has revealed that although immune effector cells remain functional in MGUS patients, T lymphocytes and natural killer (NK) cells from newly diagnosed and relapsed MM patients are unable to produce a tumor-specific immune response due to (1) cytokine production by clonal PCs (eg, transforming growth factor β),12 (2) T-cell exhaustion and anergy,13,14 or (3) inhibitory signaling through coexpression of programmed cell death protein 1 (PD-1) and programmed death ligand 1 (PD-L1) in effector and tumor cells, respectively.15,16 However, it remains unclear whether the quantitative and functional immune deregulation typically observed in MM is a cause or a consequence of the increasing tumor burden.10 Because immunomodulatory drugs (IMiDs) and novel monoclonal antibodies (eg, anti-CD38 and anti-SLAMF7) rely on the activity of T lymphocytes and NK cells,17 such an impaired immune system may represent a barrier for immunotherapy in active disease but not in preceding SMM, for which immunotherapeutic strategies aiming at preventing disease progression would be effective with the help of functionally active T lymphocytes and NK cells. It is unfortunate that virtually no data are available on the immune status of patients with SMM or on whether their immune status could be therapeutically modulated (eg, using IMiDs); such information would be important to further understand the interplay between immunosurveillance and disease transformation, as well as to define whether patients with SMM might benefit from immunotherapeutic strategies.
The interest in SMM has significantly increased in recent years due to both the identification of well-defined patient subgroups with different risks of progression11,18 and to the demonstration of the potential benefit in time to progression and overall survival of treating high-risk SMM patients with lenalidomide plus low-dose dexamethasone (LenDex).19 Of note, Mateos et al, in a recent update of this trial, have shown that even though a significant fraction of patients remained with detectable disease after therapy (ie, less than a complete response), only 14 of 57 (25%) patients randomized to receive treatment have progressed so far20 ; hence, it could be hypothesized that in addition to the direct tumor reduction induced by LenDex, other factors such as immunosurveillance might play a role in delaying tumor progression. However, this has never been demonstrated. Furthermore, the combination used in the QUIREDEX trial includes the potential antagonist effects of the immunomodulatory lenalidomide vs the immunosuppressive dexamethasone21-25 ; accordingly, such a potentially antagonist combination may represent a dilemma in the design of clinical trials investigating preemptive therapy in high-risk SMM.26
Here, we have analyzed the phenotypic profiles of T lymphocytes, NK cells, and dendritic cells (DCs) in high-risk SMM patients enrolled in the QUIREDEX trial and compared them against those of age-matched healthy individuals to determine the immune status in high-risk SMM. Afterward, we monitored such patients after 3 and 9 cycles of LenDex induction therapy to evaluate the role of T-lymphocyte and NK-cell functionality in delaying disease progression to symptomatic MM. Lastly, we compared the immune profiles of both cell populations during maintenance with lenalidomide as a single-agent to measure the potential antagonistic effect of dexamethasone.
Patients and methods
Study design
In this preplanned exploratory analysis, we evaluated the immunophenotypic profiles of T lymphocytes and NK cells from a total of 119 PB samples from 31 of the 57 high-risk SMM patients allocated into the treatment arm of the QUIREDEX trial and for whom longitudinal samples were available at baseline, after 3 cycles of LenDex, at the end of induction therapy, and during maintenance with lenalidomide at least 3 months after dexamethasone discontinuation (this last analysis was performed in 13 of the 31 patients). The criteria for patient inclusion and the design of the QUIREDEX trial have been described elsewhere19 ; briefly, high-risk SMM was defined based on the presence of at least 2 of the 3 following criteria: BM PC infiltration ≥10%, high M-component (IgG ≥30g/L or IgA ≥20g/L or B-J protein >1 g/24 hours)18 , or ≥95% clonal PCs from total BM PCs plus immunoparesis.11 High-risk SMM patients were treated with an induction phase of 9 4-week cycles of LenDex followed by maintenance with lenalidomide; maintenance therapy was initially given until disease progression, but a protocol amendment limited the total duration of treatment (induction plus maintenance) to 2 years.19 A total of 10 healthy donors aged >60 years were also studied and used as normal reference. All control and patient samples were collected after informed consent was given by each individual, according to the local ethical committees and the Helsinki Declaration. Baseline demographic and disease characteristics of the high-risk SMM patients are summarized in Table 1.
Immunophenotypic protein expression of T lymphocytes, NK cells, and DCs
We evaluated by multiparameter flow cytometry a total of 30 different markers distributed across 4-color monoclonal antibody combinations in PB T lymphocytes and NK cells (supplemental Table 1, available on the Blood Web site). Each combination included either CD4 plus CD8 to identify helper and cytotoxic T lymphocytes, or CD3 plus CD56 to identify total T lymphocytes, as well as CD56dim (cytotoxic) and CD56bright (immune regulator) NK cells (supplemental Table 2). A total of 63 phenotypic parameters were evaluated in each patient sample. EDTA-anticoagulated PB samples from each subject were immunophenotyped during the first 24 hours after extraction using a direct immunofluorescence technique to evaluate surface antigen expression. For intracellular cytokine staining, heparin-anticoagulated PB samples diluted in RPMI 1640 with L-glutamine (1:1 v/v) were cultured during 4 hours at 37°C in a 5% carbon dioxide–humidified atmosphere in the presence of phorbol 12-myristate 13-acetate (25 ng/mL) and ionomycin (0.5 mg/m) with or without 10 μg/mL of brefeldin A (used as negative control). Simultaneous staining for intracytoplasmatic interferon (IFN)-γ, tumor necrosis factor (TNF)-α, interleukin (IL)-2, and CD40L and surface antigens was performed by use of the IntraStain fixation and permeabilization kit (DakoCytomation). Regulatory T cells (Tregs) were enumerated using the following combination of markers: CD25–fluorescein isothiocyanate (FITC)/CD127-phycoerythrin (PE)/CD4–peridinin-chlorophyll-protein complex–Cy5.5/forkhead box (FOX)P3-allophycocyanin. In brief, 200 μL of heparin anticoagulated PB samples were incubated for 15 minutes at room temperature and in the dark. Cells were washed in phosphate-buffered saline and then fixed and permeabilized with FoxP3 Staining Buffer Set (eBioscience) for FOXP3 staining. To enumerate DCs and determine their relative distribution into myeloid, plasmacytoid, and tissue macrophage subpopulations, 200 μL of heparin anticoagulated PB samples were immunophenotyped using a direct immunofluorescence technique based on 6 4-color combinations of monoclonal antibodies. All combinations included HLA-DR–FITC/CD45–peridinin-chlorophyll-protein complex–Cy55 and CD123-allophycocyanin with a different PE-conjugated marker in each of the 6 combinations: CD80, CD86, CD16, BDCA-1, CD14, and CD11c. Data acquisition was performed for ∼2 × 10⁵ leukocytes per tube in a FACSCanto II flow cytometer (BD Biosciences, San Jose, CA) and using the FACSDiva software (version 6.1). Monitoring of instrument performance was performed daily using Cytometer Setup Tracking (BD Biosciences) and rainbow 8-peak beads (Spherotech, Lake Forest, IL) after laser stabilization, following the EuroFlow guidelines27 ; sample acquisition was systematically performed after longitudinal instrument stability was confirmed. Data analysis was performed using the Infinicyt software (Cytognos SL, Salamanca, Spain).
Cell cycle analyses
The proliferation index of CD4 and CD8 T lymphocytes and total NK cells was analyzed using 3-color staining for nuclear DNA and 2 cell surface antigens. Briefly, 100 μL of EDTA-anticoagulated PB samples were incubated at room temperature for 15 minutes in the dark with the following combination of monoclonal antibodies (FITC, PE): CD4, CD8, and CD3, CD56. After lysing nonnucleated red cells, the nucleated cells were washed and stained with 3 μL per tube of DRAQ5 (Vitro SA, Madrid, Spain). After another 10 minutes of incubation, samples were immediately acquired in a FACSCanto II flow cytometer using the FACSDiva software program, and information on ≥105 cells corresponding to the whole PB cellularity was measured and stored. Data were analyzed with the Infinicyt software, and the percentage of cells in the S-phase of the cell cycle was calculated as described elsewhere.28
Statistical analysis
The number of PB CD4 and CD8 T lymphocytes and CD56dim and CD56bright NK cells was recorded as absolute number of cells per microliter. Antigen expression was defined as percentage of positive cells for markers in which 2 discrete subsets could be identified (negative vs positive cells), or by mean fluorescence intensity units for markers with a homogeneous and unimodal pattern of expression. A supervised cluster analysis was performed using the MultiExperiment Viewer software (version 4.6.1) to compare the immunophenotypic protein expression profiles (iPEPs) obtained for high-risk SMM patients at baseline, after 3 cycles of LenDex, and at the end of induction therapy. The Pearson correlation and average linkage clustering were used as distance and linkage methods, respectively. The comparison between patient iPEPs at the end of induction vs maintenance was performed by principal component analysis based on the simultaneous evaluation of the 63 phenotypic parameters analyzed per sample under the automated population separator graphical representation of the Infinicyt software. The Mann-Whitney U test or the Kruskal-Wallis H test was used to evaluate the statistical significance of differences observed between 2 groups or among >2 groups, respectively. We used the SPSS software (version 15.0; SPSS, Chicago, IL) for all statistical analyses.
Results
The immune status of high-risk SMM patients
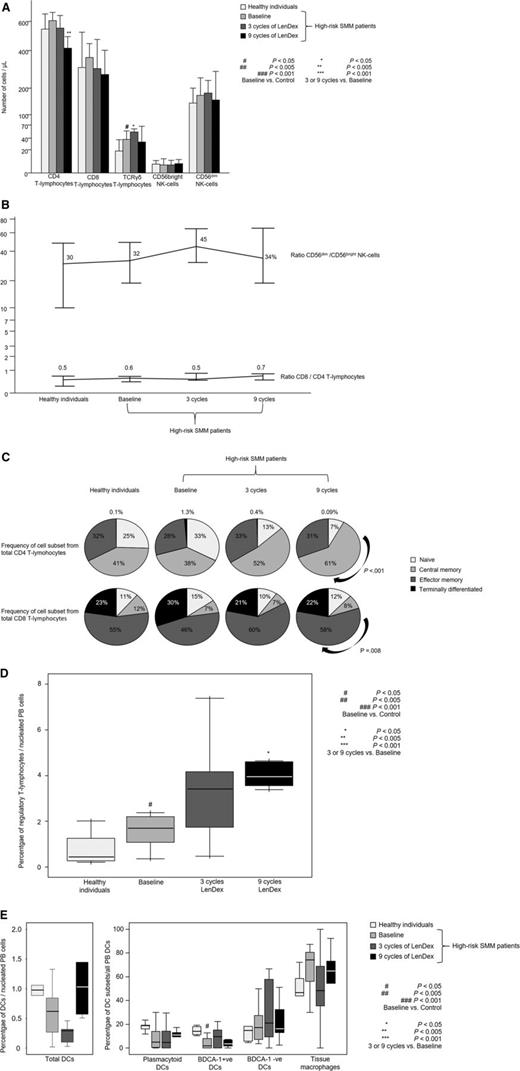
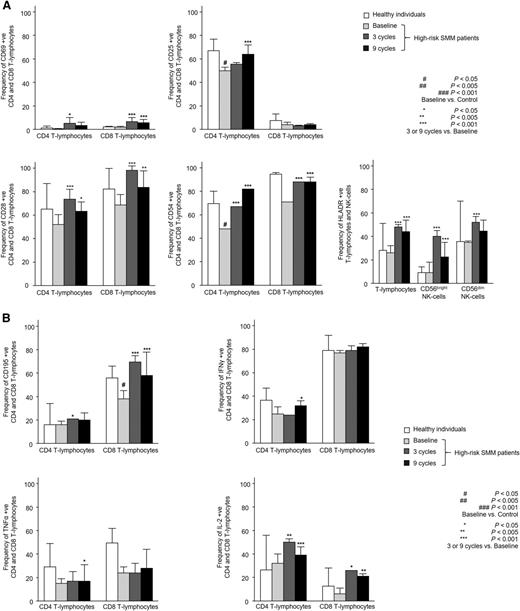
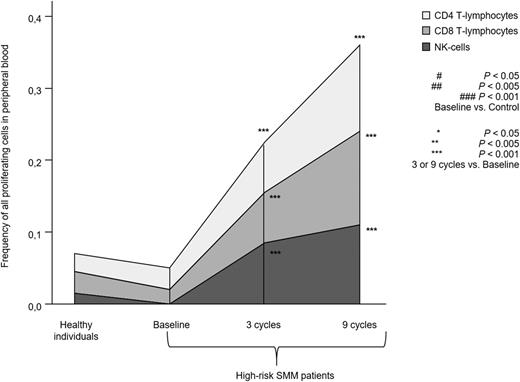
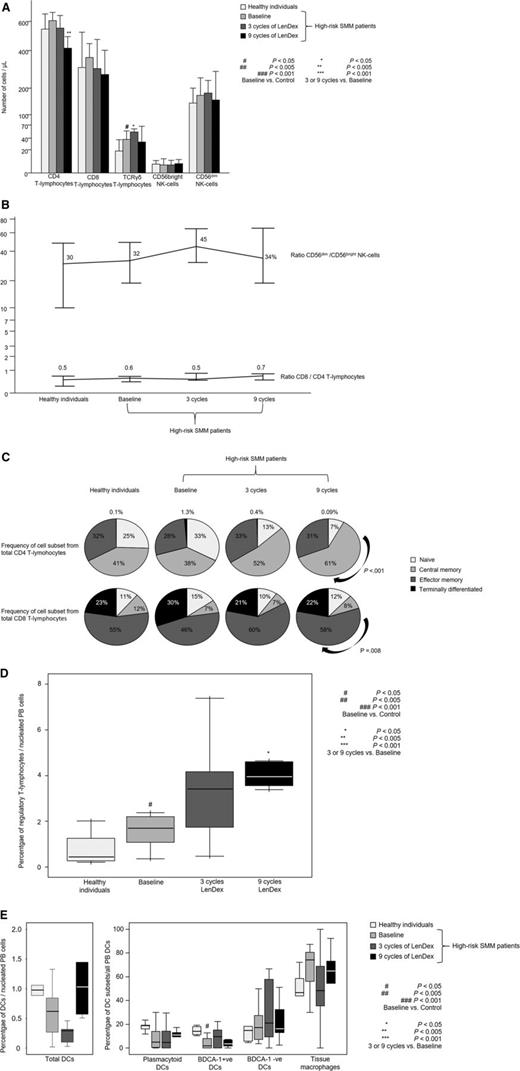
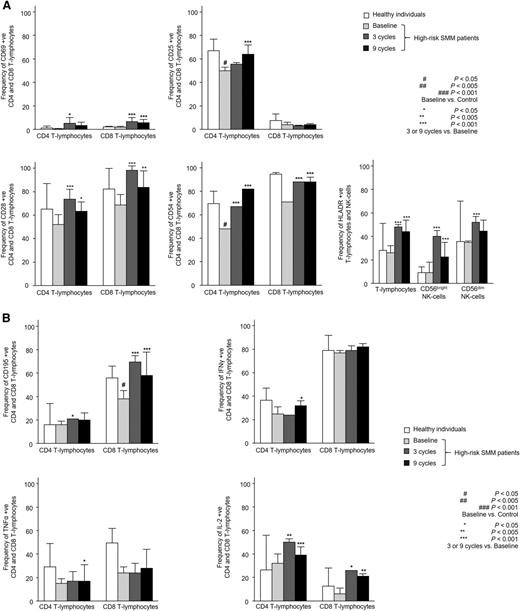
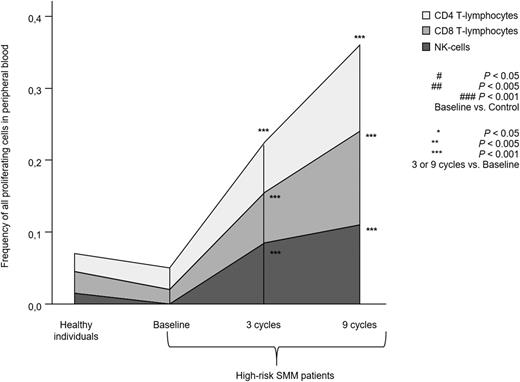
Patients with high-risk SMM showed normal absolute numbers of CD4 and CD8 T lymphocytes, as well as CD56dim and CD56bright NK cells (Figure 1A). No differences were noted for the relative distribution of the CD4 and CD8 subsets within total T lymphocytes or for CD56dim and CD56bright cells within the total NK-cell compartment (Figure 1B). High-risk SMM patients also showed similar distribution of antigen-related maturation subsets within total CD4 and CD8 T lymphocytes as compared with healthy individuals (Figure 1C). By contrast, in the PB of patients with high-risk SMM as compared with age-matched healthy individuals, there was a significant increment of T-cell receptor (TCR)γδ-positive T lymphocytes (median of 37 vs 18 cells per microliter; P = .02) and Tregs (median of 1.7% vs 0.5%; P = .04) (Figure 1D). There was a trend for lower DC counts in high-risk SMM patients vs healthy individuals (P = .08; Figure 1E), and a more detailed analysis of the distinct subsets of DCs and tissue macrophages showed an altered distribution of BDCA-1 positive myeloid DCs (2% vs 14%; P = .02) and tissue macrophages (74% vs 47%; P = .06). Although no differences were observed for the absolute numbers and cellular distribution of CD4 and CD8 T lymphocytes, significant differences emerged when comparing their iPEPs: the expression levels of activation markers such as CD25, CD28, and CD54 (Figure 2A) and type 1 T helper (Th1)-related markers such as surface CD195 and the secretion of IFN-γ, TNF-α, or IL-2 (Figure 2B) were significantly inferior in T lymphocytes from high-risk SMM patients vs healthy individuals. A significant downregulation of proliferation-related markers such as CD119 and CD120b was also noted among high-risk SMM patients (P < .005; data not shown), but no significant differences in the percentage of proliferating CD4 and CD8 T lymphocytes (or NK cells) were observed as compared with healthy age-matched individuals (Figure 3).
Distribution of T lymphocytes and NK cells. Distribution of CD4, CD8, and TCRγδ T lymphocytes and CD56dim and CD56bright NK cells in PB samples from heathy individuals aged >60 years (n = 10) and high-risk patients with SMM (n = 31) studied at baseline and after 3 and 9 cycles of induction therapy with LenDex as assessed by multiparameter flow cytometry. (A) Absolute counts (cells per microliter). (B) Ratio of CD56dim to CD56bright NK cells and of CD8 to CD4 T lymphocytes. (C) Distribution of antigen-maturation related subsets within total CD4 (upper row) and CD8 (lower row) T lymphocytes. (D) Percentage of Tregs among nucleated PB cells. (E) Percentage of total DCs among nucleated PB cells (left) and distribution of DC subsets (right), including plasmacytoid, BDCA-1–positive and –negative DCs, and tissue macrophages. In (A), bars represent median values; vertical lines represent the upper bound of the 95% confidence intervals. In (D) and (E), notched boxes represent 25th and 75th percentile values; the line in the middle corresponds to the median value, and the vertical lines correspond to both the 10th and 90th percentiles.
Distribution of T lymphocytes and NK cells. Distribution of CD4, CD8, and TCRγδ T lymphocytes and CD56dim and CD56bright NK cells in PB samples from heathy individuals aged >60 years (n = 10) and high-risk patients with SMM (n = 31) studied at baseline and after 3 and 9 cycles of induction therapy with LenDex as assessed by multiparameter flow cytometry. (A) Absolute counts (cells per microliter). (B) Ratio of CD56dim to CD56bright NK cells and of CD8 to CD4 T lymphocytes. (C) Distribution of antigen-maturation related subsets within total CD4 (upper row) and CD8 (lower row) T lymphocytes. (D) Percentage of Tregs among nucleated PB cells. (E) Percentage of total DCs among nucleated PB cells (left) and distribution of DC subsets (right), including plasmacytoid, BDCA-1–positive and –negative DCs, and tissue macrophages. In (A), bars represent median values; vertical lines represent the upper bound of the 95% confidence intervals. In (D) and (E), notched boxes represent 25th and 75th percentile values; the line in the middle corresponds to the median value, and the vertical lines correspond to both the 10th and 90th percentiles.
Immunophenotypic features of T lymphocytes and NK cells. Detailed immunophenotypic features of CD4 and CD8 T lymphocytes, as well as CD56dim and CD56bright NK cells in PB samples from heathy individuals aged >60 years (n = 10) and high-risk patients with SMM (n = 31) studied at baseline and after 3 and 9 cycles of induction therapy with LenDex with regard to antigen expression of activation (A) and Th1-related immune response markers (B). Bars represent median values; vertical lines represent the upper bound of the 95% confidence intervals.
Immunophenotypic features of T lymphocytes and NK cells. Detailed immunophenotypic features of CD4 and CD8 T lymphocytes, as well as CD56dim and CD56bright NK cells in PB samples from heathy individuals aged >60 years (n = 10) and high-risk patients with SMM (n = 31) studied at baseline and after 3 and 9 cycles of induction therapy with LenDex with regard to antigen expression of activation (A) and Th1-related immune response markers (B). Bars represent median values; vertical lines represent the upper bound of the 95% confidence intervals.
Proliferation of T lymphocytes and NK cells. Total percentage of proliferating S-phase T lymphocytes and NK cells in PB samples from heathy individuals aged >60 years (n = 10) and high-risk patients with SMM (n = 31) studied at baseline and after 3 and 9 cycles of induction therapy with LenDex. Each area represents the specific fluctuation of S-phase CD4 (light gray) and CD8 T lymphocytes (gray) and NK cells (dark gray).
Proliferation of T lymphocytes and NK cells. Total percentage of proliferating S-phase T lymphocytes and NK cells in PB samples from heathy individuals aged >60 years (n = 10) and high-risk patients with SMM (n = 31) studied at baseline and after 3 and 9 cycles of induction therapy with LenDex. Each area represents the specific fluctuation of S-phase CD4 (light gray) and CD8 T lymphocytes (gray) and NK cells (dark gray).
Immunomodulation of high-risk SMM patients with LenDex
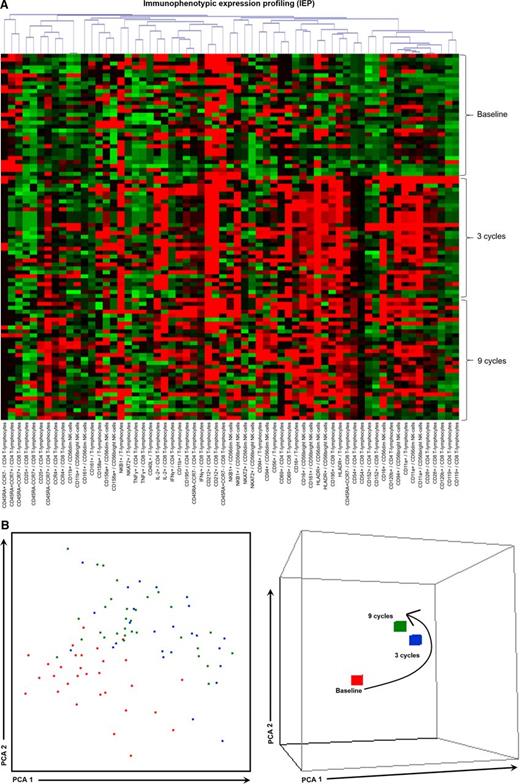
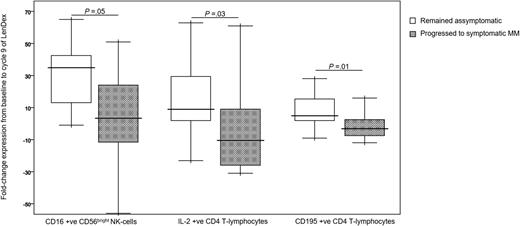
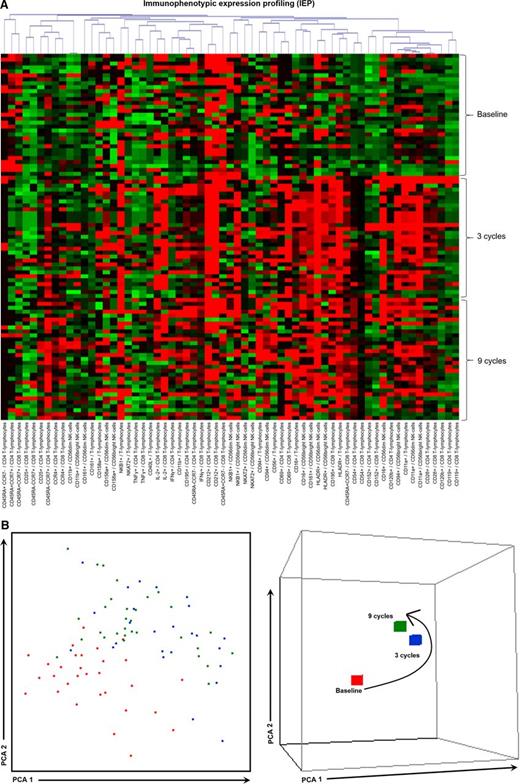
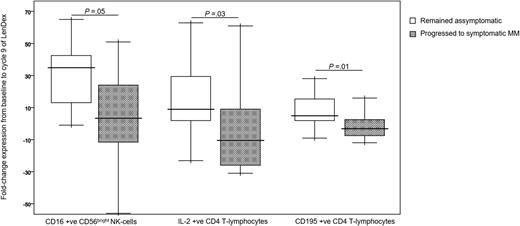
To assess the combined effect of LenDex on T lymphocytes and NK cells, we compared the immune status of the 31 high-risk SMM patients at baseline (inclusion in the clinical trial) vs after 3 and 9 cycles of LenDex. Of interest, the absolute number of TCRγδ-positive T lymphocytes and the frequency of Tregs were further increased after 3 and 9 cycles of LenDex, respectively; conversely, CD4 T lymphocytes were significantly decreased at the end of induction therapy (Figure 1A). No significant differences were noted for the remaining cell populations, including overall DC counts and distribution of DC subsets and tissue macrophages, or for the relative distribution of the CD4/CD8 and CD56dim/CD56bright subsets within total T lymphocytes and NK cells, respectively (Figure 1B). By contrast, there was a marked shift in the distribution of antigen-related maturation subsets induced by LenDex, which was reflected by a significant increase of central memory CD4 T lymphocytes (38% vs 52% vs 61% at baseline and cycles 3 and 9 of LenDex, respectively; P < .001) and effector memory CD8 T lymphocytes (46% vs 60% vs 58% at baseline and cycles 3 and 9 of LenDex, respectively; P < .001; Figure 1C). Because the accumulation of antigen-experienced T lymphocytes is typically related to increased activation and proliferation, we then compared the iPEPs of T lymphocytes and NK cells of all patient samples longitudinally collected at baseline and after cycles 3 and 9 of LenDex (Figure 4). Accordingly, CD4 and/or CD8 T lymphocytes showed an increased expression of activation markers such as CD69, CD25, CD28, and CD54, together with an upregulation of the Th1-related chemokine CCR5 (CD195) and increased cytokine production of IFNγ, TNF-α, and IL-2. An overall analysis on total (CD3+) T lymphocytes plus CD56dim and CD56bright NK cells showed an upregulation of the activation marker HLA-DR (P < .001; Figure 2A), the antibody‐dependent cell‐mediated cytotoxicity–associated receptor CD16 (P ≤ .005), and the adhesion molecules CD11a (P ≤ .001) and CD11b (P ≤ .005) after 3 and 9 courses of LenDex (data not shown). By contrast, no differences were observed for the expression of the lectinlike receptor CD94 or the inhibitory receptors CD158a, CD161, NKB1, and NKAT2 in the surface of NK cells throughout induction therapy (data not shown). Cell cycle analysis (Figure 3) revealed that the percentage of cells in S-phase progressively increased from baseline vs 3 and 9 cycles of LenDex for CD4 T lymphocytes (0.03% vs 0.07% vs 0.12%; P < .001) and CD8 T lymphocytes (0.02% vs 0.07% vs 0.13%; P < .001), as well as for NK cells (0% vs 0.09% vs 0.11%; P < .001). Upon demonstrating the immunomodulation of high-risk SMM throughout the 9 induction cycles of LenDex, we then investigated whether patients achieving at least very good partial response (≥VGPR) after 9 cycles of LenDex showed unique immune features at this specific time point. Of interest, patients with ≥VGPR had a trend toward (1) lower expression of CD158a (P = .09) and the NKAT (P = .06) killer-cell immunoglobulin-like receptor among total CD56dim NK cells, (2) higher expression of CD25 (P = .04), CD120b (P = .06), and CD54 (P = .08) among CD4 T lymphocytes, and (3) higher expression of CD28 (P = .07) and CD195 (P = .01) among CD8 T lymphocytes. Also, the percentage of proliferating NK cells was significantly increased (P = .02) among patients with ≥VGPR. Next, we investigated whether patients with sustained disease control showed unique phenotypic features as compared with patients who progressed to treatment-requiring MM. At the latest update and with a median follow-up of 5 years, 19 patients remained asymptomatic, whereas 12 cases progressed to symptomatic MM (supplemental Figure 1); there were no significant differences in median follow-up between patients remaining asymptomatic and those progressing to symptomatic MM. At baseline, only the percentage of CD158a-positive CD56dim NK cells significantly differed between asymptomatic and progressing cases (median of 16% and 38%, respectively; P = .02), whereas upon therapy, patients with sustained disease control showed significantly increased absolute numbers of TCRγδ-positive T lymphocytes (median of 53 vs 35 cells per microliter; P = .03) as well as a higher expression of CD94 among CD56dim cytotoxic NK cells (56% vs 40%; P = .001) after LenDex treatment. To account for differences in baseline levels, we also compared median fold-change expression (from baseline to cycle 9 of LenDex) of each individual marker between asymptomatic and progressing patients. Our results show that among asymptomatic vs progressing patients, CD16 fold-change expression in CD56bright NK cells (35 vs 4; P = .05), IL-2 (9 vs −10.5; P = .03), and CD195 (5 vs −3; P = .01) fold-change expression in CD4 T lymphocytes were significantly increased (Figure 5).
iPEPs at baseline and after 3 and 9 cycles of induction therapy. iPEPs of CD4 and CD8 T lymphocytes and CD56dim and CD56bright NK cells in PB samples from high-risk patients with SMM (n = 31) studied at baseline and after 3 and 9 cycles of induction therapy with LenDex. (A) Each of the 63 phenotypic parameters evaluated is distributed per individual columns, indicated at the bottom as “expression of the marker/immune cell population,” and represented by color bars depicting normalized intensity values against those observed in heathy individuals aged >60 years (n = 10), ranging from low (dark green) to high (dark red) expression levels. (B) PCA graphical view of patient iPEPs. In the 2-dimensional PCA representation (left), each patient is represented by a single dot colored according to the sample time point: baseline (orange) and cycles 3 (blue), and 9 (green) of LenDex, whereas in the 3-dimensional PCA representation (right), all patient samples were grouped according to their respective time point. PCA, principal component analysis.
iPEPs at baseline and after 3 and 9 cycles of induction therapy. iPEPs of CD4 and CD8 T lymphocytes and CD56dim and CD56bright NK cells in PB samples from high-risk patients with SMM (n = 31) studied at baseline and after 3 and 9 cycles of induction therapy with LenDex. (A) Each of the 63 phenotypic parameters evaluated is distributed per individual columns, indicated at the bottom as “expression of the marker/immune cell population,” and represented by color bars depicting normalized intensity values against those observed in heathy individuals aged >60 years (n = 10), ranging from low (dark green) to high (dark red) expression levels. (B) PCA graphical view of patient iPEPs. In the 2-dimensional PCA representation (left), each patient is represented by a single dot colored according to the sample time point: baseline (orange) and cycles 3 (blue), and 9 (green) of LenDex, whereas in the 3-dimensional PCA representation (right), all patient samples were grouped according to their respective time point. PCA, principal component analysis.
Markers with different fold-change expression between asymptomatic vs progressing high-risk SMM patients. Fold-change expression of CD16 in CD56bright NK cells and of IL-2 and CD195 in CD4 T lymphocytes, from baseline to cycle 9 of induction therapy with LenDex. High-risk SMM patients were grouped into those remaining asymptomatic (n = 19) vs those progressing to symptomatic MM (n = 12). Boxes represent 25th and 75th percentile values; the line in the middle corresponds to the median value; vertical lines correspond to both the 10th and 90th percentiles.
Markers with different fold-change expression between asymptomatic vs progressing high-risk SMM patients. Fold-change expression of CD16 in CD56bright NK cells and of IL-2 and CD195 in CD4 T lymphocytes, from baseline to cycle 9 of induction therapy with LenDex. High-risk SMM patients were grouped into those remaining asymptomatic (n = 19) vs those progressing to symptomatic MM (n = 12). Boxes represent 25th and 75th percentile values; the line in the middle corresponds to the median value; vertical lines correspond to both the 10th and 90th percentiles.
Is dexamethasone abrogating the immunostimulatory effect of lenalidomide?
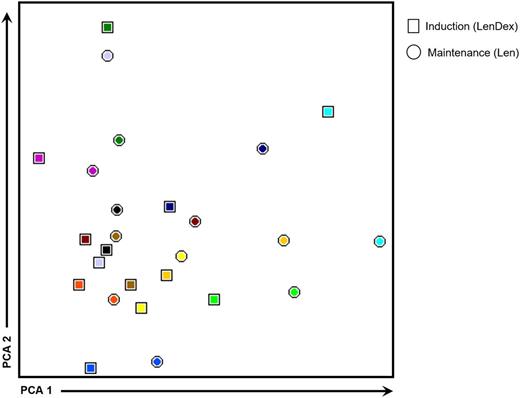
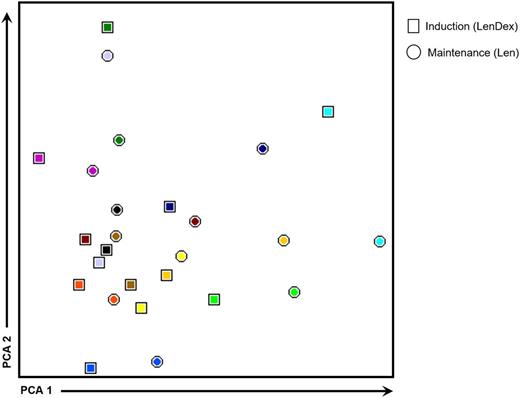
To address the question whether dexamethasone antagonizes the immunomodulatory properties of lenalidomide, we compared the immune profiles of 13 patients in whom PB samples were collected at the end of the 9 induction cycles (LenDex) vs paired samples obtained during maintenance (single-agent lenalidomide; at least 3 months after dexamethasone discontinuation). No significant differences were observed in (1) the absolute numbers of all cell populations analyzed, (2) the relative distribution of CD4/CD8 T lymphocytes and CD56dim/CD56bright NK cells, or (3) the antigen-related maturation subset distribution of CD4 and CD8 T lymphocytes (data not shown). Further comparison of patient iPEPs at cycle 9 vs during maintenance revealed that from the total 63 phenotypic parameters analyzed, only 7 were found to be differentially expressed. Namely, the percentage of CD94-positive and CD154-positive T lymphocytes and CD212-positive CD4 and CD8 T lymphocytes, and the mean fluorescence intensity of CD11a in T lymphocytes; CD56dim and CD56bright NK cells were downregulated during maintenance (data not shown). Accordingly, an overall analysis of patient immune status shows overlapping iPEPs without a clear clustering of samples collected after 9 induction cycles of LenDex (represented by squares in Figure 6) vs maintenance with single-agent lenalidomide (represented by circles in Figure 6).
iPEPs after 9 cycles of induction vs maintenance therapy. iPEPs of CD4 and CD8 T lymphocytes and of CD56dim and CD56bright NK cells in PB samples from high-risk patients with SMM (n = 13) studied after 9 cycles of induction therapy with LenDex vs during maintenance with lenalidomide (Len) at least 3 months after dexamethasone discontinuation. In the PCA graphical view, every patient is represented by a unique color, with squares representing iPEPs from PB samples studied after induction therapy and circles representing iPEPs during maintenance.
iPEPs after 9 cycles of induction vs maintenance therapy. iPEPs of CD4 and CD8 T lymphocytes and of CD56dim and CD56bright NK cells in PB samples from high-risk patients with SMM (n = 13) studied after 9 cycles of induction therapy with LenDex vs during maintenance with lenalidomide (Len) at least 3 months after dexamethasone discontinuation. In the PCA graphical view, every patient is represented by a unique color, with squares representing iPEPs from PB samples studied after induction therapy and circles representing iPEPs during maintenance.
Discussion
Understanding the biologic and cellular mechanisms involved in the transition from benign to malignant MM has become particularly important with the emergence of new diagnostic criteria29 and potential benefit for early treatment of SMM patients at higher risk of progression to symptomatic MM.19 However, whereas several studies have focused on the genomic characterization of SMM,1-4,6,7,30 no research efforts have been made to evaluate the immune system of SMM patients.10 Here, we undertook a detailed characterization of the immune status of high-risk SMM patients and noted a mild functional impairment as compared with age-matched healthy individuals; next, we demonstrated that high-risk SMM patients can be effectively immunomodulated by lenalidomide and, consequently, showed that the immunomodulatory effects of lenalidomide were not lost when combined with low-dose dexamethasone. These observations suggest that increasing numbers of functionally active immune cells after LenDex therapy in high-risk SMM patients may have partially contributed to the reduction in risk of transformation.
Extensive studies in the BM and PB samples from patients with MGUS and symptomatic MM have shown that T lymphocytes and NK cells become quantitatively and functionally altered in the latter stage of the disease,31-42 thereby suggesting a relation between an impaired immune system and the transformation of MM. Conversely, we41 and others43 have recently shown that patients in “operational cure” (ie, >10 years progression-free survival after therapy) have unique immune signatures characterized by increased numbers of effector cytotoxic CD8+ T lymphocytes, NK cells, B lymphocytes, and normal PCs. Because some of these patients had detectable residual disease, it was postulated that tumor immunosurveillance by functionally active cytotoxic cells could prevent disease progression in such patients. When considering the natural evolution of MM, it could be hypothesized that the balance between immunosurveillance and tumor escape should be particularly critical at the stage of SMM; in fact, it is well known that the transformation of SMM into symptomatic MM is characterized by a dysfunctional humoral immune response (eg, a skewed ratio of serum free light chains44 and immunoparesis11 ), but unfortunately, a detailed analysis of the immune status of SMM patients has never been performed. Here, we have demonstrated that although SMM patients at higher risk of transformation have normal absolute numbers of immune effector cells, CD4 and CD8 T lymphocytes showed downregulation of a selected number of activation-, Th1-, and proliferation-related markers. Such a modulation of T-lymphocyte iPEPs could be potentially explained by the increased frequency observed for Tregs, because several studies have shown that these are increased and functionally immunosuppressive in the PB of symptomatic MM patients.45,46 Conversely, BDCA-1–positive myeloid DCs were decreased in patients’ PB, and even though differences were not statistically significant, we have found similar patterns for plasmacytoid DCs and tissue macrophage distribution as compared with newly diagnosed symptomatic MM patients.41 By contrast, no differences were noted in the iPEPs of NK cells from high-risk SMM patients vs age-matched healthy individuals. These results may be clinically relevant, given the promising role of immunotherapeutic strategies aimed at boosting immunosurveillance and controlling disease progression (eg, monoclonal antibodies and checkpoint inhibitors).
IMiDs such as lenalidomide have been widely adopted for the treatment of MM, usually in combination with dexamethasone. The activity of IMiDs is mediated by modulating the substrate specificity of the E3 ubiquitin ligase CRL4CRBN. Thus, lenalidomide treatment results in increased ubiquitinylation of the transcription factors Ikaros and Aiolos and consequent altered expression of their target genes, including IRF4 and IL-2. Most likely due to the simultaneous targeting of different genes, a dual mechanism of action involving both a direct anti-MM activity (through reduced IRF4 expression) and immunomodulation (through boosted IL-2 production by T lymphocytes) has been attributed to lenalidomide.47,48 In addition, lenalidomide also increases NK-cell responses by lowering its activation threshold through both CD16 and NKG2D.49 Thus, significant concern exists on the simultaneous use of dexamethasone with IMiDs because it could antagonize the immunoenhancing effect of the latter. Accordingly, it has been shown that dexamethasone abrogates lenalidomide-induced T-lymphocyte production of IL-2 and NK-cell production of IFN-γ and granzyme B, NK-cell receptor expression, and in vitro NK-cell mediated cytotoxicity.21-25 However, contrasting results have also been reported, which suggested that in vitro, antigen-dependent activation of NK T cells is greater in the presence of LenDex than with dexamethasone alone.50 Although these findings have obvious clinical implications, it should also be noted that these studies have been mostly performed in vitro using high-doses of dexamethasone and in small patient series. In fact, very recent data have shown that pomalidomide/dexamethasone can induce rapid activation of innate and adaptive immunity in heavily pretreated relapsed/refractory patients,51 which further contributes to the uncertainty about the potential antagonizing effect of dexamethasone in combination with IMiDs. Here, we had the unique opportunity to study T lymphocytes and NK cells from treatment-naive high-risk SMM patients included in the QUIREDEX trial and exposed to 9 induction cycles of LenDex19 to elucidate whether or not the use of corticosteroids may have a detrimental effect on the immunomodulatory activity of lenalidomide. Our results, based on longitudinal samples collected at baseline and after cycles 3 and 9 of LenDex, show a significant increase of TCRγδ-positive T lymphocytes at cycle 3, coupled with a decrease of CD4 T lymphocytes at cycle 9. However, the most notorious differences were noted for the distribution of T-lymphocyte antigen-related maturation subsets; the fact that CD4 and CD8 T lymphocytes become enriched in central and effector memory cells after 3 and 9 cycles of LenDex identifies them as not-yet-terminally differentiated, which makes them promising candidates for antitumor response. Furthermore, it was interesting to observe that LenDex was able to restore the expression of those activation-, Th1-, and proliferation-related markers that at baseline were found to be downregulated in both CD4 and CD8 T lymphocytes of high-risk SMM patients as compared with age-matched healthy individuals. CD56dim cytotoxic and CD56bright immune regulatory NK cells were also found to be significantly activated after therapy. Accordingly, lenalidomide was able to effectively modulate the iPEP and proliferative rate of immune cells from high-risk SMM patients in the presence of dexamethasone; in fact, virtually no differences were observed in the numbers and iPEPs of T lymphocytes and NK cells during maintenance therapy with lenalidomide and without concomitant dexamethasone. However, even though immune profiling was performed at least 3 months after dexamethasone discontinuation, we cannot preclude long-lasting effects on the immune system of the 9 previous cycles with LenDex. The optimal way to address this particular question (ie, abrogation of the immunomodulation produced by lenalidomide with concomitant dexamethasone) would be in a randomized study comparing the immune profiles of patients treated with LenDex vs lenalidomide without dexamethasone. Furthermore, patients enrolled in the observation arm of the QUIREDEX trial also represent an important control group and would have allowed investigation of whether the immune status of treatment-naive high-risk SMM patients significantly varies in a period of ∼1 year without any antimyeloma therapy; it is unfortunate that such studies were not part of the original design of the QUIREDEX trial. Similarly to what has been described in patients treated with LenDex52,53 and pomalidomide/dexamethasone,51 immunomodulation of T lymphocytes and NK cells is possible despite an expansion of Tregs. It could be hypothesized that such expansion is induced by dexamethasone, but Scott et al have recently reported that dexamethasone (alone or in combination with lenalidomide) abrogated the ability of myeloma cell lines to induce Treg expansion in vitro53 ; alternately, increasing Treg numbers may reflect decreased TNF-α levels after therapy that allow for Treg proliferation.54 That notwithstanding, we have not found significant differences in Treg numbers between patients with ≥VGPR vs <VGPR (data not shown), similarly to that recently reported by Sehgal et al51 ; accordingly, further translational research in IMiD/dexamethasone-based clinical trials is warranted to fully understand the impact of each drug (separately and in combination) on Tregs.
In summary, our results provide an immunologic rationale for the treatment of high-risk SMM patients with LenDex. Furthermore, the fact that a significant delay in time to progression and consequent improvement in overall survival is being observed, even among patients with residual disease after therapy, suggests potential immunosurveillance of a reduced number of clonal PCs; accordingly, high-risk SMM patients progressing to symptomatic MM had significantly lower numbers of TCRγδ T lymphocytes. Our data, obtained from a carefully selected population of patients without previous exposure to anti-MM therapy and with available longitudinal samples after consecutive cycles of LenDex, shed new light on the synergism between lenalidomide and dexamethasone which, at low doses, does not abrogate the immunomodulatory effects of lenalidomide. However, further studies are warranted to demonstrate an intrinsic relation between baseline vs lenalidomide-based immune cell activation and reduced risk of progression in high-risk SMM, particularly by using high-throughput protein and sequencing techniques not only to quantify immune effector cells but also to determine their functionality and location within the tumor microenvironment.55
The online version of this article contains a data supplement.
The publication costs of this article were defrayed in part by page charge payment. Therefore, and solely to indicate this fact, this article is hereby marked “advertisement” in accordance with 18 USC section 1734.
Acknowledgments
This study was supported by the Cooperative Research Thematic Network grants RD12/0036/0058 and RD12/0043/0012 of the Red de Cancer (Cancer Network of Excellence); Instituto de Salud Carlos III, Spain, Instituto de Salud Carlos III/Subdirección General de Investigación Sanitaria (FIS: PI060339; 06/1354; 02/0905; 01/0089/01-02; PS09/01897/01370; G03/136; and Sara Borrell: CD13/00340); Asociación Española Contra el Cáncer (GCB120981SAN), Spain; and a European Research Council 2015 Starting Grant (B.P.).
Authorship
Contribution: B.P., M.V.M., J.J.L, J.A.P.-S., and J.F.S.M. conceived the idea and designed the study; M.V.M., L.L.-C., M.T.H., J. Bargay, F.d.A., J.d.l.R, A.-I.T., P.G., L.R., F.P., A.O., J.H., G.E., J.J.L., J. Bladé, and J.F.S.M. supplied the study material or patients; B.P., L.I.S.-A., N.P., and M.-B.V. performed the immunophenotypic studies and analyzed the flow cytometry; B.P. and L.A.C. performed the statistical analysis; B.P., M.V.M., L.I.S.-A., J.J.L., J.A.P.-S., and J.F.S.M. analyzed and interpreted the data; and B.P. and J.F.S.M wrote the manuscript. All authors reviewed and approved the manuscript.
Conflict-of-interest disclosure: B.P., M.V.M., and J.F.S.M. have served on the speaker’s bureau for Millennium, Celgene, and Janssen. J. Bladé has received honoraria for lectures and advisory boards from Janssen and Celgene and grant support from Janssen. J.J.L. has received honoraria from Janssen and Celgene. The remaining authors declare no competing financial interests.
Correspondence: Bruno Paiva, Clinica Universidad de Navarra, Centro de Investigacion Médica Aplicada, Instituto de Investigación Sanitaria de Navarra, Avenida Pio XII 36, 31008 Pamplona, Spain; e-mail: bpaiva@unav.es.
A complete list of the members of the Grupo Español de Mieloma/Programa de Estudio y Tratamiento de las Hemopatías Malignas cooperative study groups appears in “Appendix.”
Appendix: cooperative study group members
List of the Grupo Español de Mieloma/Programa de Estudio y Tratamiento de las Hemopatías Malignas cooperative study groups: In addition to the authors, the following investigators participated in the study: Luis Palomera (Hospital Lozano Blesa, Zaragoza, Spain), M. Mariz (IPO de Oporto, Oporto, Portugal), J. Parreira (IPO de Lisboa, Lisbon, Portugal), A. López de la Guía (Hospital La Paz, Madrid, Spain), A. Alegre Amor (Hospital La Princesa, Madrid, Spain), M. Luz Martino Galiana (Hospital Universitario Virgen del Rocio, Sevilla, Spain), A. I. Teruel Casasús (Hospital Clínico Universitario de Valencia, Valencia, Spain), and J. L. Guzmán Zamudio (Hospital Jerez de la Frontera, Cádiz, Spain).

