Abstract
Introduction
Various Peripheral T-cell lymphoma (PTCL) entities are recognized in the World Health Organization (WHO) classification based on clinical, histopathological, phenotypic and molecular criteria. Their diagnosis is however often challenging for pathologists, and up to 30% of cases, currently not classifiable, are recognized as not otherwise specified (NOS). Recent gene expression profiling (GEP) studies have significantly improved the molecular and ontogenic characterization of these tumors, but such high-throughput technologies are hardly feasible in the routine clinical setting. There is therefore an important need for alternative diagnostic strategies to allow for the development of specific therapies. Here, we sought to create a parsimonious and robust GEP assay to differentiate the different PTCL entities and to better characterize the heterogeneity of PTCL-NOS.
Methods
A Reverse Transcriptase-Multiplex Ligation dependant Probe Amplification (RT-MLPA) assay addressing 20 markers was applied to a cohort of 227 PTCLs biopsies enriched in PTCL-NOS (n=126). This assay determines the expression of seventeen genes routinely tested as immunohistochemical (IHC) markers or selected from high throughput GEP studies, together with the EBV infection status (EBER1 expression) and the presence of RHOAG17V and IDH2R172K/T mutations.
Results
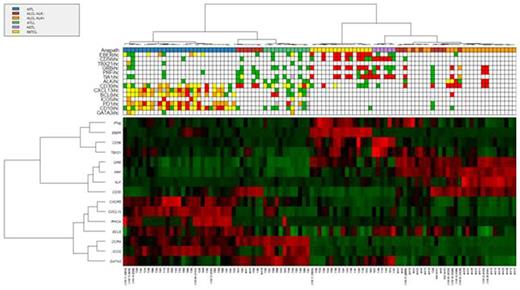
Unsupervised hierarchical clustering analysis of 101 control cases representing the main PTCL entities other than PTCL-NOS by RT-MLPA accurately classified 28/29 Angioimmunoblastic T-cell lymphomas (AITL), 21/21 Anaplastic large T-cell lymphomas (ALCL) ALK+, 16/16 NK/T-cell lymphomas (NKTCL), 6/6 Hepatosplenic T-cell lymphomas (HSTL) and 12/12 Adult T-cell Leukemia/Lymphomas (ATLL)(Figure). AITL were classified according to the expression of Tfh markers (CXCL13, CXCR5, ICOS, BCL6) and RHOA mutations (n=18); NKTCLs according to EBER1, GZMB and Th1 markers (TBX21, IFNγ); HSTLs to CD56, GATA3, TBX21 and BCL6; ALCL ALK+ according to CD30, ALK and cytotoxic markers (PRF, GZMB); ATLLs to ICOS and Th2 markers (GATA3, CCR4). Interestingly, ALCL ALK- cases (n=17) were divided into 2 subgroups: one, associated with high expression of CD30 and cytotoxic markers (PRF, GZMB), clustered with ALCL ALK+ cases (n=11), the other showed absence of PRF and GZMB, but expression of CD30 and Th2 markers (n=6).
Applied to 126 nodal PTCL-NOS, the RT-MLPA classifier identified 33 AITL-Like cases expressing Tfh markers and often presenting with RHOA mutations (15 cases). It also identified 5 NKTCL-like cases (EBV-cytoxic) and 1 ALCL-like case (cytotoxic-CD30).The CD30-Th2 signature was found in 15 cases, reinforcing the hypothesis that it may delineate a novel PTCL entity, at the frontier between ALCL ALK- and other PTCLs. In agreement with previous GEP studies, 23 cases expressed Th2 markers but no CD30 (often in association with a significant Tfh signature, probably reflecting a contribution from the microenvironment). Twenty-five other cases showed a hybrid cytotoxic-Th1 signature. The remaining 14 cases did not reveal any recognizable gene expression profile.
Finally, we observed a strong correlation between RT-MLPA and IHC for most markers evaluated by both methods (p<10-3 for CD8, CD30, GZMB, PRF, ALK, CD56, CXCL13, ICOS and GATA3), indicating that our assay is reliable and may constitute a valuable alternative to IHC.
Conclusion
This study demonstrates the applicability of a parsimonious RT-MLPA classifier for the classification of PTCLs. Its simplicity of use and its applicability on FFPE samples makes it an attractive alternative to high throughput GEP approaches and IHC. Its implementation in clinical trials, in combination with conventional pathological evaluation, may thus participate to improve the classification of PTCLs and therefore the management of PTCL patients.
Prediction of PTCL subgroups using RT-MLPA. The assay was used to differentiate AITL, ALCL, ATLL, HSTL and NKTCL within 101 biopsies. Differential gene expression is depicted according to a red (positive) to green (negative) color scale (lower panel). Concordances with histopathological diagnosis and immunohistochemisty are indicated in the upper panel.
Prediction of PTCL subgroups using RT-MLPA. The assay was used to differentiate AITL, ALCL, ATLL, HSTL and NKTCL within 101 biopsies. Differential gene expression is depicted according to a red (positive) to green (negative) color scale (lower panel). Concordances with histopathological diagnosis and immunohistochemisty are indicated in the upper panel.
No relevant conflicts of interest to declare.
Author notes
Asterisk with author names denotes non-ASH members.


