Key Points
Apilimod has broad anticancer activity in vitro and in vivo across all subtypes of B-NHL.
Apilimod induces B-NHL cytotoxicity through a unique mechanism of action that involves the disruption of lysosomal function.
Abstract
We identified apilimod as an antiproliferative compound by high-throughput screening of clinical-stage drugs. Apilimod exhibits exquisite specificity for phosphatidylinositol-3-phosphate 5-kinase (PIKfyve) lipid kinase and has selective cytotoxic activity in B-cell non-Hodgkin lymphoma (B-NHL) compared with normal cells. Apilimod displays nanomolar activity in vitro, and in vivo studies demonstrate single-agent efficacy as well as synergy with approved B-NHL drugs. Using biochemical and knockdown approaches, and discovery of a kinase domain mutation conferring resistance, we demonstrate that apilimod-mediated cytotoxicity is driven by PIKfyve inhibition. Furthermore, a critical role for lysosome dysfunction as a major factor contributing to apilimod’s cytotoxicity is supported by a genome-wide CRISPR screen. In the screen, TFEB (master transcriptional regulator of lysosomal biogenesis) and endosomal/lysosomal genes CLCN7, OSTM1, and SNX10 were identified as important determinants of apilimod sensitivity. These findings thus suggest that disruption of lysosomal homeostasis with apilimod represents a novel approach to treat B-NHL.
Introduction
Non-Hodgkin lymphoma (NHL) is a collective term for a heterogeneous group of lymphoproliferative malignancies with subtypes ranging from slow growing to aggressive with different responses to available treatment. In 2015, there were 71 850 estimated new cases of NHL and 19 790 resulting deaths.1 Current treatment modalities for B-cell NHL (B-NHL) may be effective in first-line therapy, but many patients relapse or are refractory, necessitating the development of improved therapies.2,3
We identified apilimod from our clinical-stage compound library as a potent targeted agent with robust cytotoxic activity on B-NHL. Apilimod was previously identified as an inhibitor of Toll-like receptor–induced interleukin 12 (IL-12) and IL-23 cytokine production, and was evaluated in clinical trials as an immunomodulatory agent for treatment of T helper 1 (Th1)- and Th17-mediated inflammatory diseases.4-8 These trials included normal healthy volunteers (phase 1) as well as psoriasis, rheumatoid arthritis, and Crohn disease patients (phase 2).4,6-8 Altogether, >700 subjects were treated and apilimod was well tolerated with mild to moderate side effects including headache, fatigue, dizziness, and nausea. However, apilimod did not meet the primary end points in phase 2 inflammatory disease indications and further clinical development was abandoned.4,6
Although these clinical trials were performed prior to identification of the direct target, inhibition of phosphatidylinositol-3-phosphate 5-kinase (PIKfyve) has since been shown to underlie the selective inhibition of immune cell production of IL-12/IL-23.9 PIKfyve is an endosomal lipid kinase targeted to the cytoplasmic leaflet of endosomes via protein-lipid interactions between its FYVE domain and phosphatidylinositol-3-phosphate (PI3P) within the endosomal membrane.10 At endosomes, PIKfyve phosphorylates PI3P to generate PI(3,5)P2, which in turn serves to control endolysosomal membrane traffic.11-15
A role for PIKfyve inhibition for anticancer therapy has only been minimally explored. Antiproliferative activity of apilimod to date has been limited to experiments on non-small-cell lung cancer lines16 and under nutrient starvation.17 A role for PIKfyve in controlling tumor cell invasiveness has also been described.18,19 Here, we validate PIKfyve kinase as a target for B-NHL and show that inhibition by apilimod has powerful and selective antiproliferative and cytotoxic effects. Furthermore, through a genome-wide CRISPR screen, we identified lysosome-related genes that determine the remarkable sensitivity of B-NHL cells to apilimod. These findings, along with observations that apilimod treatment robustly impairs endolysosomal membrane traffic, point to disruption of lysosomal homeostasis as an important component of the cytotoxic effects of apilimod. Collectively, these findings provide a promising new approach for treating multiple subtypes of B-NHL as a single agent, or in combination with existing therapies.
Methods
Cell-Titer Glo assays
Cells were seeded into 96-well plates at a density within log-growth phase and treated with indicated drugs for 5 days. Plates were developed with the Cell-Titer Glo assay (Promega) according to the manufacturer’s instructions. The 50% inhibitory concentration (IC50) for each cell line was determined using Graphpad Prism 6 software. Data were log transformed and subjected to nonlinear regression (curve fit) using the sigmoidal dose-response (variable slope) equation, constraining the bottom at 0 and the top at 100. Experiments were performed in duplicate and repeated a minimum of 2 independent times to obtain the average IC50 values. For caspase 3/7 activity, the same procedure was performed with the Caspase Glo assay (Promega).
Knockdown experiments
Short hairpin RNA (shRNA)-mediated knockdown was performed by cloning annealed hairpin oligos into Tet-pLKO-puro (Addgene plasmid 21915) for doxycycline-inducible repression of PIKFYVE (supplemental Methods, available on the Blood Web site). Constructs were transfected into 293T cells with pVSVG and Δ8.9 packaging plasmids and lentivirus-containing supernatant was harvested 72 hours posttransfection. B-NHL cell lines were transduced by spinoculation with 50% virus supernatant with 8 μg/mL polybrene for 1.5 hours at 800 × g and drug-selected with 2 μg/mL puromycin. Surviving Tet-pLKO-puro pools were expanded and treated with 1 to 2 μg/mL doxycycline to induce hairpin expression.
Cell line transfections and overexpression
Human PIKFYVE, CTSD, and TFEB complementary DNAs were amplified using Kapa HiFi (Kapa Biosystems) and cloned into the piggyBac transposon construct PJ[puro]20 MluI site using NEBuilder HiFi Assembly Mix (New England Biolabs). Five million cells were electroporated with a 2:1 ratio of PJ[puro] and ACT-PBase with the Neon transfection system (Thermo Fisher Scientific). Pools were selected for 1 week with 2 μg/mL puromycin.
Xenograft experiments
All animal studies were conducted under approved animal care protocols and Association for Assessment and Accreditation of Laboratory Animal Care standards. Cells were propagated as described in supplemental Methods for each specific model. Six- to 8-week-old female mice were γ-irradiated 24 hours before tumor cell inoculation and were dosed as described in supplemental Methods. Mice that had an adverse event before drug treatment completion were removed from the data set. See supplemental Methods for specific details.
Fluorescence-activated cell sorting analysis
Cells were labeled with 7-aminoactinomycin D (7-AAD; BD Biosciences), Annexin V (BD Biosciences), or LysoTracker Deep Red (ThermoFisher Scientific) according to the manufacturers’ recommendations and analyzed on a LSRII (BD Biosciences).
Global gene expression analysis
SU-DHL-10 and WSU-DLCL2 cell lines were treated with apilimod (300 nM) or vehicle for 24 hours. RNA was isolated from 3 biological replicates using the RNeasy kit (Qiagen). One hundred nanograms of RNA was amplified using the Ion AmpliSeq Transcriptome Human Gene Expression kit (ThermoFisher Scientific) prior to Proton sequencing (ThermoFisher Scientific). Reads were demultiplexed and aligned to the reference library using the AmpliSeq RNA plug-in on the Ion Torrent server. The differential expression between treated and control samples was determined using the DESeq2 library21 from R Bioconductor software22 (http://www.bioconductor.org). Statistical significance was established by calculation of the false discovery rate (FDR) and genes with FDR < 0.05 were considered differentially regulated.
Gene ontology analysis
Gene ontology (GO) analysis was performed on the commonly upregulated and downregulated genes, using the Enrichr platform,23 and “GO Cellular Component” term.
CRISPR screen
The dual vector lentiviral GeCKO V2 human library24 was used to perform a genetic screen to identify genes that are required for apilimod sensitivity in the SU-DHL-10 diffuse large B-cell lymphoma (DLBCL) cell line. Four independent pools were screened at 3 concentrations of apilimod: 0 nM, 300 nM, and 600 nM (see supplemental Methods for full details).
Data and materials availability
The murine embryonic fibroblast (MEF) Tsc2-null cell line was obtained from the Kwiatkowski laboratory (Dana-Farber/Harvard Cancer Center). All other normal and cancer cell lines used are commercially available from American Type Culture Collection (ATCC) or Deutsche Sammlung von Mikroorganismen und Zellkulturen (DSMZ) and identification was verified by these organizations through short tandem repeat profiling.
Results
High-throughput screen of clinical-stage drug library identifies apilimod as a highly potent antiproliferative drug
We compiled a unique clinical-stage compound library consisting of virtually all US Food and Drug Administration (FDA)-approved small-molecule drugs (ie, 1994 unique chemical structures) and 499 unapproved drugs that span a wide range of diseases. To systematically probe our library for drugs with antiproliferative activity, we developed a high-throughput screening assay using a Tsc2-null MEF cell line displaying constitutively elevated mammalian target of rapamycin complex 1 (mTORC1) signaling.25 Apilimod was identified among the most potent drugs screened and was subsequently shown to have an IC50 of 20 nM (supplemental Figure 1A-B).
B-NHL cells display acute sensitivity to apilimod in vitro
Given the potency of apilimod in our initial screen, we next profiled its antiproliferative activity against 146 cell lines representing 11 tumor types. Although cells from many cancer lineages responded to apilimod, we observed that B-NHL lines were the most broadly sensitive (supplemental Figure 2). We noted antiproliferative activity in all B-NHL subtypes with ∼73% of lines having an IC50 < 200 nM (Figure 1A) and defined these as sensitive. Notably, significant antiproliferative activity was observed on cell lines derived from difficult to treat double- and triple-hit B-NHL. Although we initially identified apilimod through screening of an mTORC1-hyperactivated cell line, we observed potent antiproliferative activity in B-NHL lines irrespective of mTORC1 activation (supplemental Table 1; supplemental Figure 3). Furthermore, apilimod did not affect mTORC1 signaling (supplemental Figure 3B). Overall, apilimod had selective antiproliferative activity for B-NHL compared with normal cells with IC50 of 142 nM and 12 782 nM, respectively (Figure 1B-C; see supplemental Tables 1 and 2 for cell line–specific data in lymphoma and normal cells).
B-NHL cells display acute sensitivity to apilimod in vitro. (A) Sensitivity of 48 human B-NHL lines to apilimod, with sensitivity defined as an IC50 < 200 nM in a 5-day Cell-Titer Glo assay. The number of cell lines screened is indicated in parentheses. (B) Box-and-whiskers plot of average IC50 values (geometric mean) in human B-NHL (N = 48) and normal human cell lines (N = 12) treated with apilimod for 5 days. Each cell line was tested a minimum of 2 independent times. P < .0001 by the unpaired 2-tailed Student t test. (C) Representative viability curves of lymphoma cell lines in 5-day Cell-Titer Glo assays. (D) Viability of WSU-DLCL2 lymphoma cells after the induction of either control or PIKFYVE shRNA with doxycycline for 5 days. Values normalized to uninduced cells. (E) A PIKFYVE mutation that induces a N1939K amino acid change in the kinase domain confers apilimod resistance. Ten-point dose response of WSU-DLCL2 analysis of overexpression clones (CTRL [GFP], PIKfyve WT, and N1939K) to 3-day treatment with apilimod. Data are represented as mean ± standard deviation (SD). ABC, activated B cell; CTRL, control; GCB, germinal center B cell; GFP, green fluorescent protein; WT, wild type.
B-NHL cells display acute sensitivity to apilimod in vitro. (A) Sensitivity of 48 human B-NHL lines to apilimod, with sensitivity defined as an IC50 < 200 nM in a 5-day Cell-Titer Glo assay. The number of cell lines screened is indicated in parentheses. (B) Box-and-whiskers plot of average IC50 values (geometric mean) in human B-NHL (N = 48) and normal human cell lines (N = 12) treated with apilimod for 5 days. Each cell line was tested a minimum of 2 independent times. P < .0001 by the unpaired 2-tailed Student t test. (C) Representative viability curves of lymphoma cell lines in 5-day Cell-Titer Glo assays. (D) Viability of WSU-DLCL2 lymphoma cells after the induction of either control or PIKFYVE shRNA with doxycycline for 5 days. Values normalized to uninduced cells. (E) A PIKFYVE mutation that induces a N1939K amino acid change in the kinase domain confers apilimod resistance. Ten-point dose response of WSU-DLCL2 analysis of overexpression clones (CTRL [GFP], PIKfyve WT, and N1939K) to 3-day treatment with apilimod. Data are represented as mean ± standard deviation (SD). ABC, activated B cell; CTRL, control; GCB, germinal center B cell; GFP, green fluorescent protein; WT, wild type.
Validation of PIKfyve kinase as the target responsible for antiproliferative activity of apilimod in B-NHL
In immune cells, apilimod was previously shown to target the endosomal lipid kinase PIKfyve through direct inhibition of its kinase activity.9 To determine whether PIKfyve is also the critical target of apilimod in cancer cells, we used chemical-capture mass spectrometry.26 This strategy identified 2 proteins as high-probability apilimod targets: PIKfyve and its binding partner, VAC1427 (supplemental Figure 4A). Dissociation constant (Kd) analysis with a sensitive quantitative polymerase chain reaction readout demonstrated that apilimod had high affinity for PIKfyve, with Kd of 75 pM (supplemental Figure 4B; supplemental Methods), contrasted to the previously reported Kd of 65 nM identified with a different technology.9 To perform a comprehensive analysis of selectivity, we profiled apilimod at 1 μM against a panel of 456 normal and disease-related protein and lipid kinases.28 The results from this screen showed that apilimod only bound to PIKfyve and not to any other kinase in the panel, including other structurally related lipid kinases such as type I and type II phosphatidylinositol-4-phosphate 5-kinase (PIP5K; supplemental Figure 4C). These data confirmed and extended previous analyses showing that apilimod had selectivity for PIKfyve when profiled against 41 or 276 kinases.9,29
We next confirmed that suppression of PIKFYVE levels via inducible expression of shRNAs is sufficient to inhibit the proliferation of B-NHL in vitro (Figure 1D; supplemental Figure 5). Furthermore, we identified, through in vitro selection (21 days, 500 nM apilimod), a missense mutation in PIKFYVE that conferred apilimod resistance in the WSU-DLCL2 cell line. This N1939K mutation is predicted to reside in the adenosine triphosphate–binding pocket of the PIKfyve kinase domain.29 Stable expression of the N1939K mutant conferred >150-fold drug resistance as compared with the parental WSU-DLCL2 line (Figure 1E), confirming that PIKfyve is the critical target responsible for antiproliferative activity of apilimod in B-NHL.
Apilimod displays antitumor activity in B-NHL in vivo
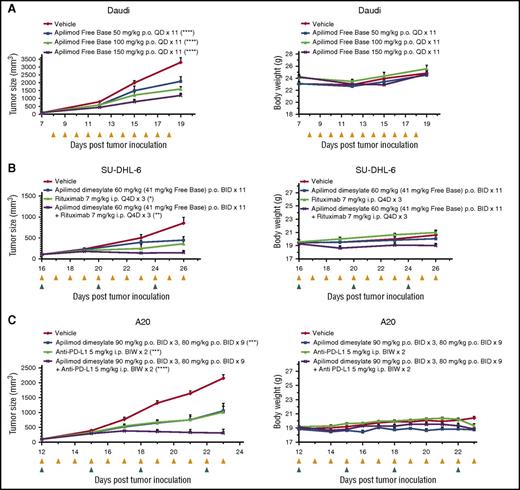
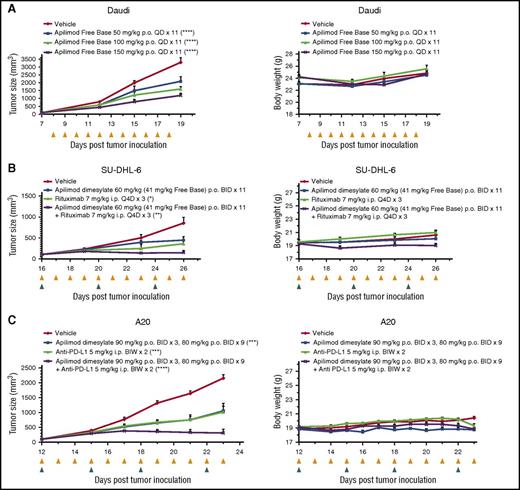
We next tested the effects of apilimod in in vivo models of lymphoma. The in vivo activity of apilimod was first validated in a subcutaneous Daudi Burkitt lymphoma xenograft model. Dose-dependent (50-150 mg/kg free base; once a day) tumor growth inhibition was noted and no significant effect on body weight was observed (Figure 2A). In order to test whether apilimod had synergistic activity in vivo when combined with an immunological treatment, we used a mouse strain capable of natural killer cell antibody-dependent cellular cytotoxicity. With oral dosing of 60 mg/kg apilimod dimesylate (∼41 mg/kg apilimod free base; twice a day), we observed 48% tumor growth inhibition in the SU-DHL-6 model. Single-agent rituximab had 58% growth inhibition and synergy was noted for the combination with 83% tumor growth inhibition (Figure 2B). Further evaluation of apilimod in an immunocompetent A20 syngeneic lymphoma model provided the opportunity to investigate apilimod in combination with the immuno-oncology therapeutic, anti-programmed death ligand 1 (PD-L1). Apilimod showed significant synergism in the A20 model, manifesting as 86% tumor growth inhibition for the combination with anti-PD-L1, compared with 51% and 53% in the apilimod and anti-PD-L1 single arms, respectively (Figure 2C). Importantly, apilimod serum concentrations achieved in xenograft studies and in completed or ongoing clinical trials exceed concentrations known to be cytotoxic in B-NHL cellular assays (unpublished clinical data from Synta Pharmaceuticals and LAM Therapeutics).
Apilimod displays antitumor activity in B-NHL in vivo. (A) Growth of Daudi Burkitt lymphoma xenograft tumors. Left, Graph of tumor size (mm3) over time (days). Right, Graph of body weight (g) over time (days). Dose is detailed in legend, ****P < .0001; compared with vehicle at last time point, 1-way analysis of variance (ANOVA), Dunnett's multiple comparisons test. Yellow triangles indicate the days which apilimod was dosed. N = 8 mice per treatment arm. Data are represented as mean ± standard error of the mean (SEM). (B) Apilimod displays growth inhibition in combination with rituximab in SU-DHL-6 DLBCL tumors in vivo. Left, Graph of tumor size (mm3) over time (days). Right, Graph of body weight (g) over time (days). *P < .05; **P < .01 compared with vehicle at last time point, 1-way ANOVA, Dunnett's multiple comparisons test. Coefficient of drug interaction (CDI), 0.8; CDI < 1 indicates synergism. Yellow and green triangles indicate the days which apilimod and rituximab were dosed. N = 6 mice per treatment arm. Data are represented as mean ± SEM. (C) Apilimod causes tumor growth inhibition in combination with anti-PD-L1 in A20 syngeneic model. Left, Graph of tumor size (mm3) over time (days). Right, Graph of body weight (g) over time (days). ***P < .001, ****P = .0001 compared with vehicle at last time point, 1-way ANOVA, Dunnett's multiple comparisons test. CDI, 0.62; CDI < 1 indicates synergism. Yellow and green triangles indicate the days which apilimod and anti-PD-L1 were dosed. N = 8 mice per treatment arm. Data are represented as mean ± SEM. BID, twice daily; BIW, twice weekly; i.p., intraperitoneal; p.o., oral gavage; Q4D, every 4 days; QD, once daily.
Apilimod displays antitumor activity in B-NHL in vivo. (A) Growth of Daudi Burkitt lymphoma xenograft tumors. Left, Graph of tumor size (mm3) over time (days). Right, Graph of body weight (g) over time (days). Dose is detailed in legend, ****P < .0001; compared with vehicle at last time point, 1-way analysis of variance (ANOVA), Dunnett's multiple comparisons test. Yellow triangles indicate the days which apilimod was dosed. N = 8 mice per treatment arm. Data are represented as mean ± standard error of the mean (SEM). (B) Apilimod displays growth inhibition in combination with rituximab in SU-DHL-6 DLBCL tumors in vivo. Left, Graph of tumor size (mm3) over time (days). Right, Graph of body weight (g) over time (days). *P < .05; **P < .01 compared with vehicle at last time point, 1-way ANOVA, Dunnett's multiple comparisons test. Coefficient of drug interaction (CDI), 0.8; CDI < 1 indicates synergism. Yellow and green triangles indicate the days which apilimod and rituximab were dosed. N = 6 mice per treatment arm. Data are represented as mean ± SEM. (C) Apilimod causes tumor growth inhibition in combination with anti-PD-L1 in A20 syngeneic model. Left, Graph of tumor size (mm3) over time (days). Right, Graph of body weight (g) over time (days). ***P < .001, ****P = .0001 compared with vehicle at last time point, 1-way ANOVA, Dunnett's multiple comparisons test. CDI, 0.62; CDI < 1 indicates synergism. Yellow and green triangles indicate the days which apilimod and anti-PD-L1 were dosed. N = 8 mice per treatment arm. Data are represented as mean ± SEM. BID, twice daily; BIW, twice weekly; i.p., intraperitoneal; p.o., oral gavage; Q4D, every 4 days; QD, once daily.
Apilimod-induced cell death in B-NHL correlates with autophagy dysfunction
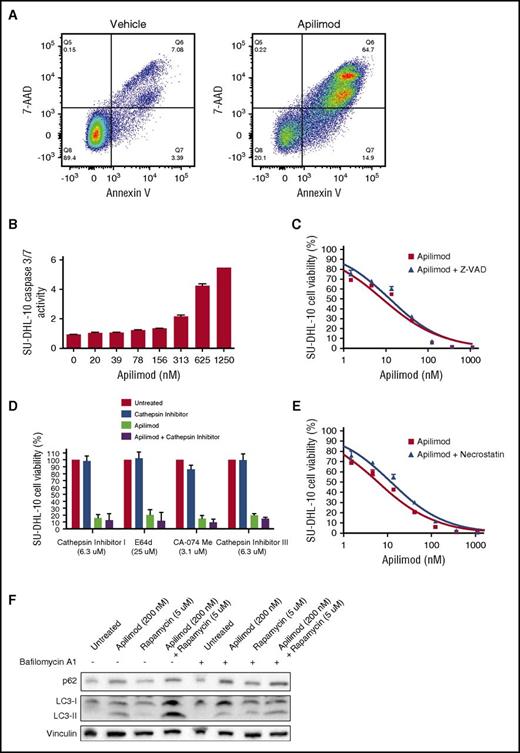
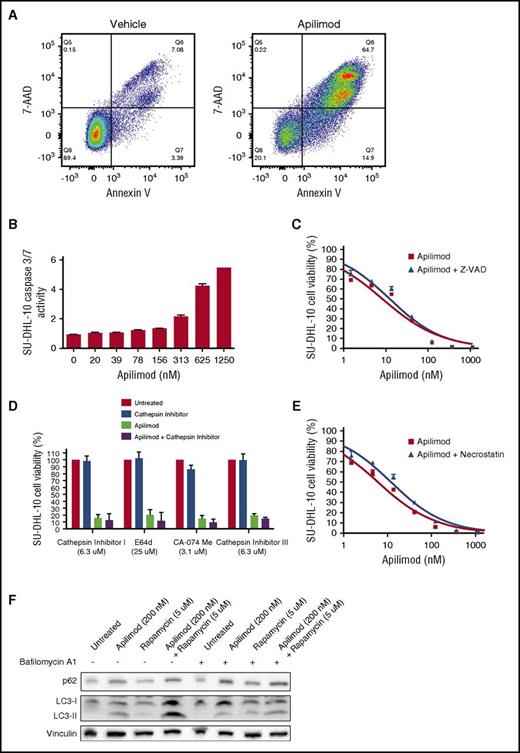
To determine whether apilimod induced cytotoxicity in cancer cells, we costained B-NHL with Annexin V, a marker for early apoptosis, and 7-AAD, a membrane-impermeant marker of nonviable cells. We observed a marked loss of membrane integrity and increased Annexin V staining in apilimod-treated B-NHL, confirming induction of cell death (Figure 3A; supplemental Figure 6A). Although Annexin V staining could be indicative of early apoptosis, the precise mechanism of apilimod-induced cell death appears to be noncanonical. We do not observe marked increases in DEVD-UltraGlo Luciferase cleavage (surrogate for caspase 3/7 activity) in apilimod-treated B-NHL cells at physiologically relevant concentrations (Figure 3B; supplemental Figure 6B), nor do we observe a significant rescue of cell viability with caspase, cathepsin, or necroptosis inhibitors across the cell lines tested (Figures 3C-3E; supplemental Figure 6C-E). Interestingly, apilimod appears to disrupt the completion of autophagy as indicated by an increase in the levels of p62 and LC3-II (Figure 3F; supplemental Figure 6F). Moreover, because cotreatment with bafilomycin does not further elevate LC3-II levels, but rapamycin does (Figure 3F; supplemental Figure 6F), apilimod most likely impairs the lysosomal degradation of autophagosomal cargo. Together, these data suggest that apilimod blocks autophagy and its effects are distinct from apoptosis, lysosomal membrane permeabilization, and necroptosis.
Apilimod induces noncanonical cytotoxicity in B-NHL. (A) Cytotoxicity of SU-DHL-10 B-NHL treated with either dimethyl sulfoxide (DMSO) or 200 nM apilimod for 3 days and stained with the viability dye 7-AAD and the apoptotic indicator Annexin V. Percentages of single- and double-positive cells are displayed. (B) DEVD-UltraGlo Luciferase cleavage activity in SU-DHL-10 B-NHL after 2-day treatment with the indicated concentration of apilimod. (C) Viability of SU-DHL-10 B-NHL measured under increasing concentrations of apilimod ± 25 μM of the caspase inhibitor Z-VAD-FMK for 3 days. (D) Viability of SU-DHL-10 B-NHL treated with apilimod and the indicated concentration of cathepsin inhibitor (cathepsin inhibitor I, E64d, CA-074 Me, or cathepsin inhibitor III) for 3 days. Apilimod was used at 156 nM in single-agent and combination experiments. (E) Viability of SU-DHL-10 B-NHL that were pretreated for 24 hours with 5 μg/mL of the necroptosis inhibitor necrostatin-1 and subsequently cotreated with 5 μg/mL necrostatin-1 and the indicated concentration of apilimod for 3 days. (F) Representative western blot of SU-DHL-10 B-NHL cells that were treated with vehicle, apilimod (200 nM), the autophagy inducer rapamycin (5 μM) or the combination of apilimod and rapamycin in the absence or presence of the autophagy inhibitor bafilomycin A1 (500 nM added for the last 8 hours) for 24 hours. Cell lysates were probed with antibodies against LC3, p62, or vinculin (loading control).
Apilimod induces noncanonical cytotoxicity in B-NHL. (A) Cytotoxicity of SU-DHL-10 B-NHL treated with either dimethyl sulfoxide (DMSO) or 200 nM apilimod for 3 days and stained with the viability dye 7-AAD and the apoptotic indicator Annexin V. Percentages of single- and double-positive cells are displayed. (B) DEVD-UltraGlo Luciferase cleavage activity in SU-DHL-10 B-NHL after 2-day treatment with the indicated concentration of apilimod. (C) Viability of SU-DHL-10 B-NHL measured under increasing concentrations of apilimod ± 25 μM of the caspase inhibitor Z-VAD-FMK for 3 days. (D) Viability of SU-DHL-10 B-NHL treated with apilimod and the indicated concentration of cathepsin inhibitor (cathepsin inhibitor I, E64d, CA-074 Me, or cathepsin inhibitor III) for 3 days. Apilimod was used at 156 nM in single-agent and combination experiments. (E) Viability of SU-DHL-10 B-NHL that were pretreated for 24 hours with 5 μg/mL of the necroptosis inhibitor necrostatin-1 and subsequently cotreated with 5 μg/mL necrostatin-1 and the indicated concentration of apilimod for 3 days. (F) Representative western blot of SU-DHL-10 B-NHL cells that were treated with vehicle, apilimod (200 nM), the autophagy inducer rapamycin (5 μM) or the combination of apilimod and rapamycin in the absence or presence of the autophagy inhibitor bafilomycin A1 (500 nM added for the last 8 hours) for 24 hours. Cell lysates were probed with antibodies against LC3, p62, or vinculin (loading control).
TFEB confers sensitivity to apilimod in B-NHL
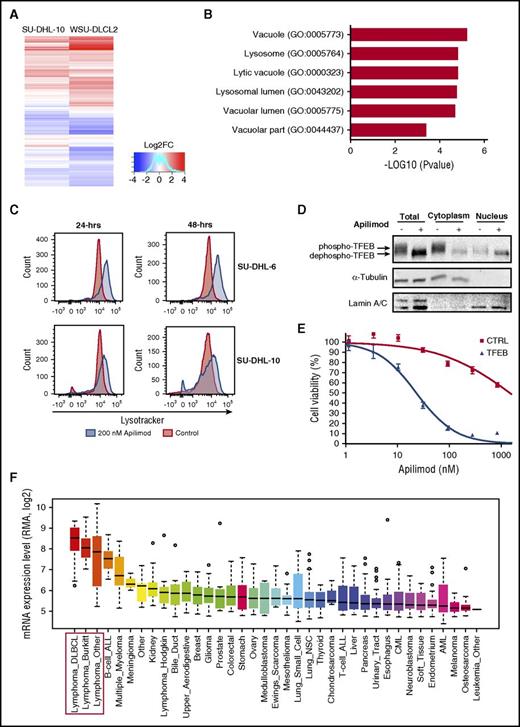
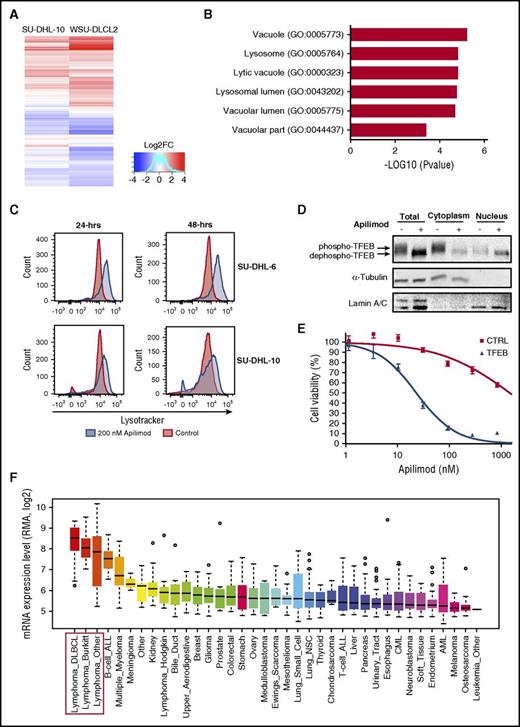
To further elucidate apilimod’s mechanism of action, we investigated global gene expression changes after treatment of B-NHL tumor lines (Figure 4A). GO analysis revealed a significant upregulation of lysosomal and autophagy-related genes, results that were further confirmed with gene set enrichment analysis over a comprehensive autophagy-lysosomal signature (Figure 4B; supplemental Figure 7). Consistent with these changes in gene expression, we observed an expansion of the acidified compartment following acute apilimod treatment of B-NHL cells (Figure 4C). This result suggested that lysosome biogenesis was upregulated by apilimod. Because transcription factor EB (TFEB) is a master transcriptional regulator of lysosomal gene expression and undergoes nuclear translocation following dephosphorylation,30-32 we explored TFEB phosphorylation status and subcellular localization upon apilimod treatment. We observed that within 2 hours of apilimod treatment, TFEB is dephosphorylated (revealed by an increase in electrophoretic mobility) and translocated into the nucleus (Figure 4D), as has been observed in other cell types treated with apilimod33 or harboring Pikfyve deletion.34
TFEB is a mediator of apilimod sensitivity in B-NHL. (A) Heat map representation of gene expression changes in SU-DHL-10 and WSU-DLCL2 B-NHL lines treated with 300 nM apilimod for 24 hours. Red color represents upregulated genes; blue color represents downregulated genes. (B) GO analysis of commonly upregulated genes from panel A reveals an enrichment for lysosomal-associated genes. (C) LysoTracker staining in SU-DHL-6 and SU-DHL-10 for 24 and 48 hours after treatment with 200 nM (blue) apilimod compared with DMSO-treated control (red). (D) Nuclear and cytoplasmic levels of TFEB protein assayed by immunoblotting in SU-DHL-6 cells treated with apilimod (63 nM) for 2 hours. A representative blot is shown from 2 independent experiments. (E) Stable CA46 (TFEB-deficient B-NHL) pools overexpressing either GFP control or TFEB were treated with 10-point apilimod dose response for 3 days. Data are represented as mean ± SD. (F) Box plots showing relative TFEB messenger RNA (mRNA) levels across tumor types, extracted from CCLE35 with gene-centric robust multiarray analysis-normalized mRNA expression data. “Lymphoma Other” includes B-cell lymphoma unspecified (8), anaplastic large-cell lymphoma (5), chronic lymphocytic leukemia–small lymphocytic lymphoma (5), mantle cell lymphoma (4), mycosis fungoides–Sezary syndrome (3), peripheral T-cell lymphoma unspecified (1), T-cell large granular lymphocytic leukemia (1), and unclassified (1). B-NHL cell lines are highlighted with a red box. ALL, acute lymphoblastic leukemia; AML, acute myeloid leukemia; CML, chronic myeloid leukemia; LOG2FC, LOG2 fold change; mRNA, messenger RNA; NSC, non-small cell; RMA, robust multiarray average.
TFEB is a mediator of apilimod sensitivity in B-NHL. (A) Heat map representation of gene expression changes in SU-DHL-10 and WSU-DLCL2 B-NHL lines treated with 300 nM apilimod for 24 hours. Red color represents upregulated genes; blue color represents downregulated genes. (B) GO analysis of commonly upregulated genes from panel A reveals an enrichment for lysosomal-associated genes. (C) LysoTracker staining in SU-DHL-6 and SU-DHL-10 for 24 and 48 hours after treatment with 200 nM (blue) apilimod compared with DMSO-treated control (red). (D) Nuclear and cytoplasmic levels of TFEB protein assayed by immunoblotting in SU-DHL-6 cells treated with apilimod (63 nM) for 2 hours. A representative blot is shown from 2 independent experiments. (E) Stable CA46 (TFEB-deficient B-NHL) pools overexpressing either GFP control or TFEB were treated with 10-point apilimod dose response for 3 days. Data are represented as mean ± SD. (F) Box plots showing relative TFEB messenger RNA (mRNA) levels across tumor types, extracted from CCLE35 with gene-centric robust multiarray analysis-normalized mRNA expression data. “Lymphoma Other” includes B-cell lymphoma unspecified (8), anaplastic large-cell lymphoma (5), chronic lymphocytic leukemia–small lymphocytic lymphoma (5), mantle cell lymphoma (4), mycosis fungoides–Sezary syndrome (3), peripheral T-cell lymphoma unspecified (1), T-cell large granular lymphocytic leukemia (1), and unclassified (1). B-NHL cell lines are highlighted with a red box. ALL, acute lymphoblastic leukemia; AML, acute myeloid leukemia; CML, chronic myeloid leukemia; LOG2FC, LOG2 fold change; mRNA, messenger RNA; NSC, non-small cell; RMA, robust multiarray average.
We next tested the potential role of TFEB for conferring sensitivity to apilimod in B-NHL. TFEB was overexpressed in the TFEB-deficient B-NHL cell line CA46 and we observed that apilimod sensitivity was enhanced by >50-fold (Figures 4E and 5B). This TFEB-mediated sensitivity also correlated with an increase in the apilimod-induced expansion of the acidified compartment, consistent with a role for lysosome dysfunction in driving apilimod-induced cell death (supplemental Figure 8). To determine whether there was a correlation between TFEB expression and apilimod sensitivity, we analyzed the expression levels of TFEB across different cancer types from the Cancer Cell Line Encyclopedia (CCLE) database.35 Strikingly, TFEB was expressed most highly in B-NHL compared with other tumor types (Figure 4F). These observations support the hypothesis that elevated TFEB expression levels are an important contributor to the selective sensitivity of B-NHL cell lines to apilimod.
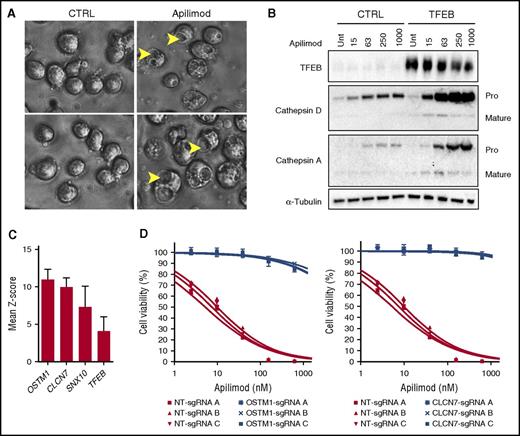
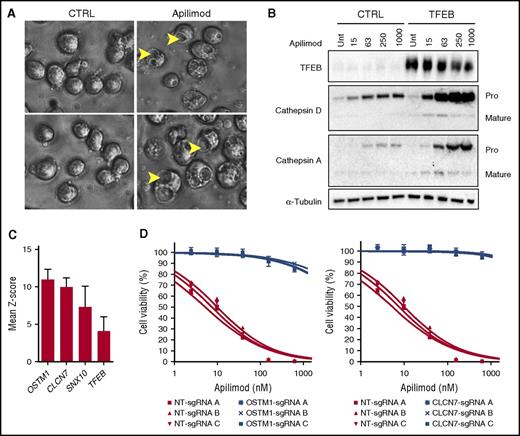
Apilimod disrupts lysosomal homeostasis and intracellular trafficking. (A) SU-DHL-6 cells were treated with DMSO or 63 nM apilimod for 24 hours and imaged at ×40 magnification. Arrows highlight vacuoles. Image sharpened evenly in order to highlight vacuoles present in floating lymphoma cells. (B) Apilimod induces procathepsin accumulation. Control (CTRL) TFEB-deficient or TFEB-overexpressing CA46 cells were dosed with increasing amounts of apilimod (15-1000 nM) for 24 hours. Lysates were probed with the indicated antibodies. The Pro and Mature forms of cathepsins A and D are indicated. Representative blot is shown from 2 independent experiments. (C) Mean Z-score for top 4 genes from CRISPR apilimod resistance screen. (D) WSU-DLCL2 B-NHL pools with the indicated OSTM1, CLCN7, or nontargeting (NT) sgRNA were treated with 10-point apilimod dose response for 3 days. Data are represented as mean ± SD. Unt, untreated.
Apilimod disrupts lysosomal homeostasis and intracellular trafficking. (A) SU-DHL-6 cells were treated with DMSO or 63 nM apilimod for 24 hours and imaged at ×40 magnification. Arrows highlight vacuoles. Image sharpened evenly in order to highlight vacuoles present in floating lymphoma cells. (B) Apilimod induces procathepsin accumulation. Control (CTRL) TFEB-deficient or TFEB-overexpressing CA46 cells were dosed with increasing amounts of apilimod (15-1000 nM) for 24 hours. Lysates were probed with the indicated antibodies. The Pro and Mature forms of cathepsins A and D are indicated. Representative blot is shown from 2 independent experiments. (C) Mean Z-score for top 4 genes from CRISPR apilimod resistance screen. (D) WSU-DLCL2 B-NHL pools with the indicated OSTM1, CLCN7, or nontargeting (NT) sgRNA were treated with 10-point apilimod dose response for 3 days. Data are represented as mean ± SD. Unt, untreated.
Disruption of lysosomal homeostasis is central to apilimod’s mechanism of action
Previous studies in cell types other than B-NHL have shown that the PI(3,5)P2 depletion following PIKfyve inhibition or deletion results in a striking swelling of endolysosomal organelles.9,12,36,37 We also noted this endolysosomal swelling phenotype (vacuolization) in apilimod-treated B-NHL cells (Figure 5A). This change in the shape and size of endosomes and lysosomes suggests a major imbalance in the membrane traffic into and out of these organelles. Lysosome function is critically dependent on the vesicular delivery and maturation of numerous enzymes that collaborate within lysosomes to degrade macromolecules. Consistent with an intracellular trafficking defect, we observed a dose-dependent increase in the pro-(inactive forms) forms of cathepsins A and D that is further enhanced by elevated TFEB expression (Figure 5B). To confirm that apilimod was indeed causing accumulation of procathepsin and not simply raising cathepsin expression, we overexpressed cathepsin D and once again observed a selective increase of procathepsin D levels upon apilimod treatment (supplemental Figure 9). These results collectively demonstrate that apilimod treatment impairs the maturation of key lysosomal proteases.
Genome-wide CRISPR screen identifies lysosomal proteins as key determinants of apilimod-mediated sensitivity
We next used CRISPR technology to perform a genome-wide loss-of-function genetic screen in the SU-DHL-10 B-NHL cell line to identify genes that are necessary for apilimod sensitivity (detailed in supplemental Figure 10). For this purpose, we used the GeCKO library that has been successfully implemented in previous CRISPR-based resistance screens.24,38 Briefly, cells were infected in parallel with the GeCKO A and B libraries and expanded in the presence of 300 nM or 600 nM apilimod. After 3 days of treatment, surviving cells were further expanded and reselected in the presence of apilimod for another 3 days. Genomic DNA from these pools was subsequently analyzed for the identification of enriched single-guide RNAs (sgRNAs).
Remarkably, the endosomal/lysosomal-associated genes OSTM1, CLCN7, SNX10, as well as TFEB were top hits arising from this analysis (Figure 5C). This identification of TFEB (in addition to data from Figure 4E) further establishes this transcription factor as an important determinant of apilimod sensitivity. Interestingly, CLCN7 is a TFEB target gene39 and together with OSTM1 encodes a Cl−/H+ exchanger40 that is important for lysosome acidification.41,42 Furthermore, sorting nexin 10 (SNX10) has previously been shown to play an important role in the control of endolysosomal membrane traffic and induces large lysosomal vacuoles when overexpressed.43 To validate these molecular candidates, we performed targeted CRISPR-mediated deletion of OSTM1 and CLCN7 in B-NHL cells, and observed that loss of each gene indeed conferred >100-fold apilimod resistance (Figure 5D).
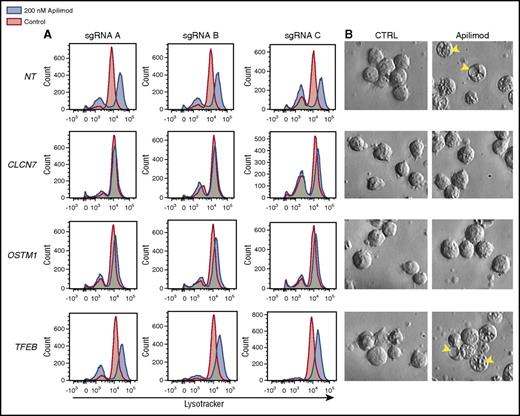
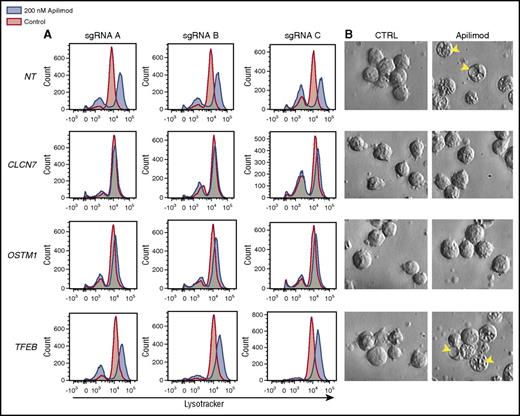
In order to elucidate the connection between TFEB and the CLCN7/OSTM1 transporter, we examined the effect of knocking out each of these components on apilimod-induced lysosomal expansion. Interestingly, loss of either chloride transporter component (CLCN7 or OSTM1), but not TFEB, blocked both apilimod-induced expansion of the acidified compartment and vacuolization (Figure 6). Importantly, apilimod sensitivity correlated with these endolysosomal phenotypes as CLCN7 and OSTM1 CRISPR knockout confer complete resistance and TFEB CRISPR knockout only provides partial resistance (Figure 5D; supplemental Figure 11). This points to TFEB activity functioning upstream or parallel to the CLCN7/OSTM1 transporter, which appears to be directly required for apilimod-induced endolysosomal disruption. Together, these results support a model where CLCN7/OSTM1 is central to the susceptibility of B-NHL to apilimod-induced killing.
Effect of CRISPR gene knockout on apilimod-induced lysosomal expansion. (A) LysoTracker staining in WSU-DLCL2 CRISPR knockout pools after 48-hour treatment with 200 nM apilimod (blue) compared with DMSO-treated control (red). Three independent sgRNA pools for each gene listed are displayed. (B) Corresponding images of vacuole formation in the cells are displayed (original magnification ×40). Arrows highlight vacuoles. Images sharpened evenly in order to highlight vacuoles present in floating lymphoma cells.
Effect of CRISPR gene knockout on apilimod-induced lysosomal expansion. (A) LysoTracker staining in WSU-DLCL2 CRISPR knockout pools after 48-hour treatment with 200 nM apilimod (blue) compared with DMSO-treated control (red). Three independent sgRNA pools for each gene listed are displayed. (B) Corresponding images of vacuole formation in the cells are displayed (original magnification ×40). Arrows highlight vacuoles. Images sharpened evenly in order to highlight vacuoles present in floating lymphoma cells.
Discussion
In this study, we identified apilimod as a drug with potent and selective anticancer activity against B-NHL. To better understand how apilimod exerts its cytotoxic effect, we first sought to unambiguously identify its relevant molecular target in B-NHL cells and found it to be the phosphoinositide kinase PIKfyve, matching what was previously observed in immune cells.9 By profiling apilimod against a human kinome library, we found a remarkable selectivity for PIKfyve over all other kinases examined. Validation that PIKfyve inhibition was directly responsible for apilimod activity was provided by PIKFYVE knockdown experiments. The central role for PIKfyve as the mediator of apilimod sensitivity was further supported by our identification of a kinase domain point mutant that confers dramatic resistance. Thus, pharmacological and genetic methodologies both converge on the conclusion that PIKfyve inhibition is sufficient to inhibit proliferation and survival of B-NHL. We thus corroborated previous studies that have identified PIKfyve as the target of apilimod9 and are the first to uncover that inhibition of PIKfyve by apilimod represents a potential therapeutic strategy for treatment of B-NHL. Although apilimod has previously been investigated in some cancer cell lines, our results pertaining to B-NHL are distinct. For example, a previous study demonstrated that apilimod had antiproliferative activity on non-small-cell lung cancer lines and posited that the in vitro effect was correlated with increased expression of the IL-23 receptor.16 We searched for a connection between expression of IL-23 receptor in sensitive vs resistant lines, but did not observe any significant correlation (data not shown). Interestingly, inhibition of PIKfyve has also been shown to inhibit cancer cell invasion18,19 and growth under nutrient deprivation,17 which may lead to enhanced antitumor activity against metastatic and nutrient-deprived tumors in vivo.
The precise mechanism through which apilimod exerts its selective killing activity on specific cancer cells is of great interest. Consistent with expectations arising from the established role for PIKfyve as an important regulator of endosome and lysosome function,11-14,36,37,44 our experiments have provided multiple pieces of evidence that point to apilimod’s disruption of late endosome/lysosome function as being a major factor driving apilimod-induced cancer cell cytotoxicity.
First, we and others have observed that loss of PIKfyve activity results in disruption of endosome and lysosome membrane trafficking,11-14,36,37,44 as revealed by the robust formation of swollen cytoplasmic vacuoles following apilimod treatment. This massive apilimod-induced trafficking defect likely disrupts multiple aspects of lysosome function. Indeed, we observed that apilimod treatment in B-NHL impairs the degradation of autophagic cargo and blocks cathepsin maturation (Figures 3F and 5B) as has been reported for other PIKfyve inhibitors44-46 and genetic deletion.37 Furthermore, cathepsin inhibition does not block apilimod activity (Figure 3D), suggesting a mechanism distinct from classical lysosomal membrane permeabilization.47
Second, we observe that apilimod increases the nuclear abundance of TFEB and induces the upregulation of numerous lysosome and autophagy-related genes as observed for TFEB activation in other cell types.39,48,49 Interestingly, as previously reported,33 apilimod-induced TFEB nuclear translocation is independent of mTOR inhibition (supplemental Figure 3B). We were also unable to detect a role for calcineurin which was recently shown to regulate TFEB dephosphorylation and nuclear translocation,50 suggesting that a novel phosphatase acts downstream of PIKfyve to dephosphorylate TFEB in apilimod-treated cells (data not shown). Typically, TFEB-dependent upregulation of genes encoding lysosomal proteins represents a powerful homeostatic mechanism for restoring lysosome function. However, we predict that enhancing lysosomal protein expression under conditions where endolysosomal membrane traffic is impaired may actually further stress tumor cells and contribute to their death.
Third, we have identified lysosomal proteins that are critical for apilimod cytotoxicity in B-NHL. B-NHL cells express high levels of TFEB compared with other tumor types and increasing TFEB in the TFEB-deficient CA46 B-NHL cell line conferred a dramatic increase in apilimod sensitivity. This important role for TFEB in apilimod-induced B-NHL cytotoxicity was also independently confirmed in our genome-wide CRISPR screen. In addition to TFEB, the lysosomal proteins CLCN7, OSTM1, and SNX10 were all required for maximal apilimod sensitivity. The fact that each of these proteins functions at late endosomes and lysosomes further supports a central role for the lysosome in the cytotoxic activity of apilimod.
CLCN7 and OSTM1 form an Cl−/H+ transporter that supports the acidification of late endosomes and lysosomes.41,42 The dramatic apilimod resistance that arises from disrupting either of these genes points to an essential role for this ion transporter in apilimod-induced cytotoxicity. Interestingly, deletion of these genes also blocked the ability of apilimod to induce vacuole formation and expand the endolysosomal compartment. Such an observation is consistent with the recent report that endolysosome acidification is critical for vacuole formation downstream of PI(3,5)P2 depletion.51 Although our new observations suggest that the CLCN7/OSTM1 transporter is required for endolysosomal trafficking defects that contribute to apilimod cytotoxicity, further studies will be required to define specific mechanisms that couple CLCN7/OSTM1 function to PI(3,5)P2 availability.
Collectively, these new findings identify apilimod-mediated inhibition of PIKfyve as a promising new therapeutic strategy, and have more broadly elucidated disruption of lysosomal homeostasis as a novel anticancer mechanism for the killing of B-NHL tumor cells. Our experiments have revealed that apilimod disrupts multiple lysosome activities ranging from TFEB-dependent regulation of lysosomal gene expression, maturation of lysosomal proteases, endolysosomal membrane trafficking, and autophagic cargo clearance. Although the relative contributions of each of these factors to the sensitivity of B-NHL cells to apilimod remain to be determined, our results parallel an increasing appreciation for the diverse roles played by lysosomes as signaling and degradative organelles with major relevance to the control of cell growth.52,53
From a clinical perspective, apilimod meets prerequisite requirements for evaluation as a novel first-in-class kinase inhibitor to treat B-NHL. The drug has potent activity against its biochemical target leading to cytotoxicity in B-NHL, and is active in xenograft models both as single agent, as well as in combination with rituximab and anti-PD-L1. Prior to entry in human clinical trials, apilimod had been extensively tested in long-term Good Laboratory Practice toxicology studies in mice, rats, dogs, and monkeys. Furthermore, the ubiquitous expression of PIKfyve does not appear to pose toxicity issues as the pharmacokinetic and safety profiles of apilimod in >700 human subjects (normal healthy volunteers and inflammatory disease patients) have been assessed. Apilimod is therefore suitable for clinical evaluation in cancer patients. To this end, in our ongoing clinical trial (NCT02594384), we are formally defining a maximal tolerated dose for apilimod in B-NHL patients and monitoring safety, pharmacokinetics, pharmacodynamics, and preliminary efficacy.
The online version of this article contains a data supplement.
The publication costs of this article were defrayed in part by page charge payment. Therefore, and solely to indicate this fact, this article is hereby marked “advertisement” in accordance with 18 USC section 1734.
Acknowledgments
The authors thank D. Kwiatkowski for providing the MEF Tsc2-null cell line used in this study and Southern Research Institute for performing the high-throughput screen. The authors thank P. De Camilli, B. Manning, J. Bader, and M. Dyer for their helpful scientific discussions and review of this manuscript. The authors also thank L. Melvin and J. Abramson for their insight and review of this manuscript.
This work was supported by LAM Therapeutics.
Authorship
Contribution: H.L. and J.R. conceived and directed the project; S.G., N.B., S.L., and C.C. designed and conducted the experiments; P.B. curated the compound library and directed library screening; M.H. performed the bioinformatics analyses; T.M. conducted the expression analysis experiments; M.Z. conducted the xenograft model experiments; H.L., T.X., S.M.F., and J.R. provided major intellectual input for the project design; S.G., S.L., N.B., and H.L. wrote the manuscript; and C.C., S.M.F., M.H., and P.B. contributed to the writing of the manuscript.
Conflict-of-interest disclosure: S.G., N.B., S.L., C.C., P.B., M.H., T.M., and H.L. are employees at LAM Therapeutics. T.X. is on the LAM Therapeutics advisory board. S.M.F. is a consultant to LAM Therapeutics. M.Z. works for Crown Biosciences, a contract research organization used by LAM Therapeutics. J.R. is a Director of LAM Therapeutics. LAM Therapeutics is the owner of apilimod patents.
Correspondence: Henri Lichenstein, LAM Therapeutics, 530 Whitfield St, Guilford, CT 06437; e-mail: hlichens@lamthera.com.
References
Author notes
S.G., S.L., and N.B. contributed equally to this work.

![Figure 1. B-NHL cells display acute sensitivity to apilimod in vitro. (A) Sensitivity of 48 human B-NHL lines to apilimod, with sensitivity defined as an IC50 < 200 nM in a 5-day Cell-Titer Glo assay. The number of cell lines screened is indicated in parentheses. (B) Box-and-whiskers plot of average IC50 values (geometric mean) in human B-NHL (N = 48) and normal human cell lines (N = 12) treated with apilimod for 5 days. Each cell line was tested a minimum of 2 independent times. P < .0001 by the unpaired 2-tailed Student t test. (C) Representative viability curves of lymphoma cell lines in 5-day Cell-Titer Glo assays. (D) Viability of WSU-DLCL2 lymphoma cells after the induction of either control or PIKFYVE shRNA with doxycycline for 5 days. Values normalized to uninduced cells. (E) A PIKFYVE mutation that induces a N1939K amino acid change in the kinase domain confers apilimod resistance. Ten-point dose response of WSU-DLCL2 analysis of overexpression clones (CTRL [GFP], PIKfyve WT, and N1939K) to 3-day treatment with apilimod. Data are represented as mean ± standard deviation (SD). ABC, activated B cell; CTRL, control; GCB, germinal center B cell; GFP, green fluorescent protein; WT, wild type.](https://ash.silverchair-cdn.com/ash/content_public/journal/blood/129/13/10.1182_blood-2016-09-736892/4/m_blood736892f1.jpeg?Expires=1765932170&Signature=2KYONNj63Q3dBXrIyBmd4SVUfqGoXxvtYAMcjL0ASQPUJnlnglOGx2K-SBMY3gJ9mtl9G-l7TB9T~6E2IlRMlmdtNI2lTcS6H1qxiQXcaB8ZcROlFDV8dMX9HNpBMkelK4uQxwBL-Z2l73YaQBwd1wFQfcjYDAHF5~Xqhc0fopk2Pss2sbW9i4NhxImfKog8~R~rIOa-cSH-X3975KtLYU5LNgvgB7PZglK~lQ-7VoxUm5LeSdjxRVCeDgaAclhlkEOwXMvRzCTu4q8SSgE2sjWguVmnE-JsBZbsM3PZDMBkFtNdV3oiVnhjlk5x21WNMrtirZ1u1EgHWvabk4wVYQ__&Key-Pair-Id=APKAIE5G5CRDK6RD3PGA)

![Figure 1. B-NHL cells display acute sensitivity to apilimod in vitro. (A) Sensitivity of 48 human B-NHL lines to apilimod, with sensitivity defined as an IC50 < 200 nM in a 5-day Cell-Titer Glo assay. The number of cell lines screened is indicated in parentheses. (B) Box-and-whiskers plot of average IC50 values (geometric mean) in human B-NHL (N = 48) and normal human cell lines (N = 12) treated with apilimod for 5 days. Each cell line was tested a minimum of 2 independent times. P < .0001 by the unpaired 2-tailed Student t test. (C) Representative viability curves of lymphoma cell lines in 5-day Cell-Titer Glo assays. (D) Viability of WSU-DLCL2 lymphoma cells after the induction of either control or PIKFYVE shRNA with doxycycline for 5 days. Values normalized to uninduced cells. (E) A PIKFYVE mutation that induces a N1939K amino acid change in the kinase domain confers apilimod resistance. Ten-point dose response of WSU-DLCL2 analysis of overexpression clones (CTRL [GFP], PIKfyve WT, and N1939K) to 3-day treatment with apilimod. Data are represented as mean ± standard deviation (SD). ABC, activated B cell; CTRL, control; GCB, germinal center B cell; GFP, green fluorescent protein; WT, wild type.](https://ash.silverchair-cdn.com/ash/content_public/journal/blood/129/13/10.1182_blood-2016-09-736892/4/m_blood736892f1.jpeg?Expires=1765964478&Signature=X9ak8uh8xr5dQRnIjvGx9ibmrHAZQu~BZePr0eSlwIsrl9xljikq1Xt5GrcpKWqDJVVMo3rXtmd3tGZOET5tgPFKKa~0s836zjVk5LwqzSyxQWStiATl3s4KB0Ajw7HUTwA5M4mTbaWtrEnVwxbV6rRdZ4tlkjLEUNm7CLvlFYnDhF5Kc8LrMWHKFD-9O~sEuPRVyqvc1GaZaXY3twJixxa7CzZqeBWmTaeeyqWEeNmtT2zzqAw5YiIzJ9h6TapZL6qat8u0qbg8l5nm4xoXl6ZSZrPCNdT57HxjVmAikQHbCvvj5Aqs00oTLm2s16l00qBzWL7P7K9LBs0ZTHqRGw__&Key-Pair-Id=APKAIE5G5CRDK6RD3PGA)
