Key Points
TET3 knockdown impairs terminal erythroid differentiation, whereas TET2 knockdown leads to accumulation of erythroid progenitors.
Global levels of 5mC are not altered by knockdown of either TET2 or TET3.
Abstract
The ten-eleven translocation (TET) family of proteins plays important roles in a wide range of biological processes by oxidizing 5-methylcytosine (5mC) to 5-hydroxy-methylcytosine. However, their function in erythropoiesis has remained unclear. We show here that TET2 and TET3 but not TET1 are expressed in human erythroid cells, and we explore the role of these proteins in erythropoiesis. Knockdown experiments revealed that TET2 and TET3 have different functions. Suppression of TET3 expression in human CD34+ cells markedly impaired terminal erythroid differentiation, as reflected by increased apoptosis, the generation of bi/multinucleated polychromatic/orthochromatic erythroblasts, and impaired enucleation, although without effect on erythroid progenitors. In marked contrast, TET2 knockdown led to hyper-proliferation and impaired differentiation of erythroid progenitors. Surprisingly, knockdown of neither TET2 nor TET3 affected global levels of 5mC. Thus, our findings have identified distinct roles for TET2 and TET3 in human erythropoiesis, and provide new insights into their role in regulating human erythroid differentiation at distinct stages of development. Moreover, because knockdown of TET2 recapitulates certain features of erythroid development defects characteristic of myelodysplastic syndromes (MDSs), and the TET2 gene mutation is one of the most common mutations in MDS, our findings may be relevant for improved understanding of dyserythropoiesis of MDS.
Introduction
Erythropoiesis is a process by which multipotent hematopoietic stem cells (HSCs) proliferate, differentiate, and eventually form mature erythrocytes. This process contains 8 distinct identifiable differentiation stages, including erythroid burst-forming unit (BFU-E), erythroid colony-forming unit (CFU-E), proerythroblast, basophilic erythroblast, polychromatic erythroblast, orthochromatic erythroblast, reticulocyte, and mature erythrocyte. Unlike most cell types, an important feature of erythropoiesis is that following each of the 4 or 5 mitoses that occur during terminal erythroid differentiation, the daughter cells are distinctly different from the parent cell from which they are derived. Thus, erythropoiesis is a complex process that requires tight regulation. The most extensively studied regulators of erythroid differentiation include the erythropoietin (EPO)/EPO receptor system1-5 and 2 major transcription factors, GATA1 and KLF1.6,7 In contrast to the well-established roles of growth factors, cytokines, and transcription factors in regulating erythropoiesis, the regulation of erythropoiesis by other mechanisms is much less understood.
DNA methylation at the 5′ position of cytosine (5-methylcytosine [5mC]) in the mammalian genome is a key epigenetic event critical for various cellular processes. Although 5mC has long been regarded as a stable, highly heritable mark, recent studies demonstrated that DNA methylation patterns undergo genome-wide reprogramming during early embryonic and germ cell development. It has been documented that genome-wide DNA demethylation occurs twice, during the establishment of the primordial germ cells and after fertilization.8-11 Although it has been well established that DNA methylation is mediated by DNA methyltransferases,12-14 the molecular mechanisms that are involved in active demethylation are only beginning to be defined. In this regard, studies during the last few years have documented the involvement of ten-eleven translocation proteins (TETs) in this process. The TET family consists of 3 members, ie, TET1, TET2, and TET3, all of which have been shown to oxidize 5mC to 5-hydroxy-methylcytosine (5hmC) in vitro and in vivo.15,16 5hmC can be further modified to 5-formylcytosine (5fC) and 5-carboxylcytosine (5caC), which can then be repaired to unmethylated cytosine through the base-excision repair pathway.17
The existence of 3 mammalian TET enzymes raises the possibility that each has a distinct panel of genomic targets, such that their cell/tissue-specific expression may lead to specific physiological effects. Indeed, Tet1 is highly expressed in murine embryonic stem cells, and its depletion leads to a skewed embryonic stem cell differentiation.18,19 TET2 is abundantly expressed in hematopoietic cells and tissues, and loss-of-function mutations in TET2 are frequently found in hematologic diseases including myelodysplastic syndromes (MDS).20 Indeed, TET2 mutation is the most common mutation in MDS21 and TET2 mutation has been implicated in altered erythropoiesis in MDS.22,23 The role of TET2 in erythropoiesis of zebrafish has also been reported.24 Similarly, expression of Tet3 is by far highest in oocytes, where deletion of Tet3 led to compromised embryonic development.25
Since the discovery of the role of TET1 (the founding member of the TET family of proteins) in the conversion of 5mC to 5hmC and active DNA demethylation,15 the studies on TET proteins have garnered a great deal of attention in the epigenetic field. It has been recently documented that global DNA demethylation occurs during both murine and human erythropoiesis,26,27 suggesting the potential function of the TET family in erythropoiesis. Yet, very little is known about their expression and function in the erythroid lineage. In this present study, we explored their roles in human erythropoiesis. Our findings demonstrate distinct roles of TET2 and TET3 during human erythropoiesis.
Materials and methods
The descriptions of antibodies used, flow cytometry analysis, preparation of the lentivirus particles for knockdown, short hairpin RNA (shRNA)-mediated knockdown in human CD34+ cells, quantitative real-time polymerase chain reaction (RT-PCR), cytospin preparation, CD34+ cell culture, fluorescence-activated cell sorting of erythroblasts, vector construction, site-specific DNA methylation analysis, methylated DNA immunoprecipitation (MeDIP), assay for transposase-accessible chromatin sequencing (ATAC-seq), mass spectrometry, RNA sequencing (RNA-seq) and bioinformatics analysis, and statistical analysis of data are outlined in supplemental Materials and methods, available on the Blood Web site.
Results
Expression of TETs during human erythroid differentiation
As the first step to explore the role of TETs in human erythropoiesis, we analyzed the expression of TET family members during human erythropoiesis using our RNA-seq data set of highly purified erythroid cells at each distinct developmental stage derived from cultured cord blood CD34+ cells.28,29 Supplemental Figure 1A shows that of the 3 TET family members, TET2 and TET3 but not TET1 are expressed in erythroid cells. Moreover, TET3 is the most abundantly expressed and its expression is significantly upregulated at late stages of differentiation. Compared with TET3, TET2 is expressed at a lower but constant level throughout erythropoiesis. RT-PCR analysis revealed similar expression patterns of TET family members (supplemental Figure 1B).
Effect of TET3 deficiency on human erythroid differentiation
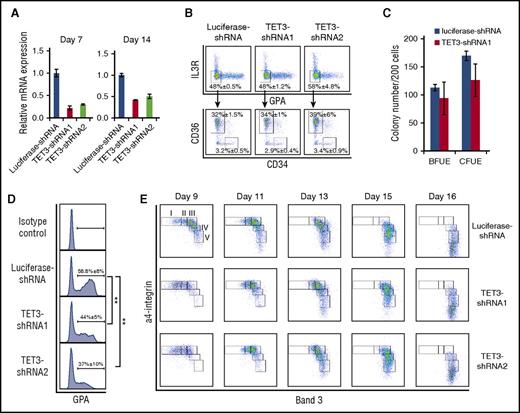
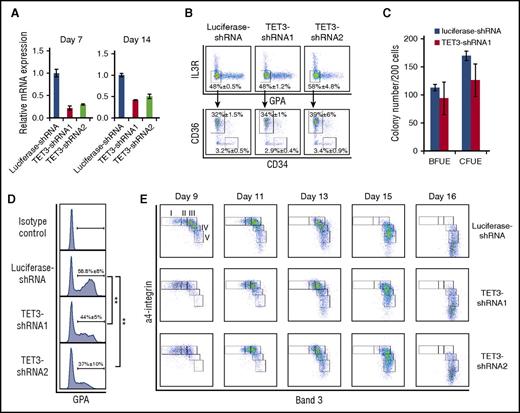
Having shown that TET3 is the most abundantly expressed TET family member in erythroid cells, we attempted to explore its role in erythropoiesis employing the shRNA-mediated knockdown approach. The knockdown efficiency was examined through all phases of differentiation, and Figure 1A showed a 50% to 70% knockdown efficiency by 2 independent shRNAs on both days 7 and 14 of culture. Although erythropoiesis is a continuous process, it can be functionally divided into 2 steps: early stage erythropoiesis and terminal erythroid differentiation. Early stage erythropoiesis refers to the process during which HSC cells are committed to erythroid progenitors. The earliest committed erythroid progenitors are BFU-E cells, which differentiate to generate CFU-E cells. We recently developed a flow cytometry-based strategy for isolating human BFU-E and CFU-E cells based on the expression pattern of specific cell surface markers.29 Using this method, we compared the BFU-E and CFU-E populations between control and TET3 knockdown groups. Figure 1B shows BFU-E and CFU-E populations based on the surface expression levels of interleukin-3 receptor (IL-3R), glycophorin A (GPA), CD34, and CD36. No differences were seen in either BFU-E or CFU-E populations following TET3 knockdown with percentages of BFU-E population (IL-3R−GPA−CD34+CD36− population): ∼3.2% in luciferase-shRNA–transduced cells, and ∼2.9% and ∼3.4% in TET3-shRNA–transduced cells; and CFU-E cells (IL3R−GPA−CD34−CD36+ population): ∼32% in luciferase-shRNA–transduced cells, and ∼34% and ∼39% in TET3-shRNA–transduced cells, respectively. To further examine whether TET3 affects the colony forming ability of BFU-E and CFU-E cells, we performed colony assay using sorted BFU-E and CFU-E cells. Figure 1C shows that TET3 knockdown did not affect the colony forming ability of sorted BFU-E and CFU-E cells. These findings demonstrate that knockdown of TET3 did not affect the commitment of HSC to erythroid lineage or the colony forming ability of BFU-E and CFU-E cells.
Effect of TET3 knockdown on human erythroid differentiation. (A) Expression of TET3 as assessed by quantitative RT-PCR, with β-actin as internal calibrator. Error bars indicate SEM (n = 3). (B) Flow cytometric analysis of erythroid progenitor populations. Cells cultured for 6 days were stained with antibodies against IL-3R, GPA, CD34, and CD36. The IL-3R and GPA double-negative population was further separated by CD34 and CD36. The IL-3R−GPA−CD34+CD36− population was identified as BFU-E and the IL-3R−GPA−CD34−CD36+ population was identified as CFU-E. The data are shown as mean ± SEM of 3 independent biological replicates. (C) The colony forming ability of sorted progenitor cells was assessed by colony forming assay. Error bars indicate SEM (n = 3). (D) The expression of GPA on day 7 of culture: the GPA+ cells were gated and the percentages of GPA+ cells are shown as mean ± SEM of 3 independent biological replicates. **P < .01. (E) Terminal erythroid differentiation was monitored on indicated days by flow cytometric analysis based on the expression of band 3 and α4 integrin. Representative plots of α4-integrin vs band 3 of GPA+ cells are shown and the erythroblasts are separated into 5 populations: proerythroblasts (I), early basophilic erythroblasts (II), late basophilic erythroblasts (III), polychromatic erythroblasts (IV), and orthochromatic erythroblasts (V). mRNA, messenger RNA; SEM, standard error of the mean.
Effect of TET3 knockdown on human erythroid differentiation. (A) Expression of TET3 as assessed by quantitative RT-PCR, with β-actin as internal calibrator. Error bars indicate SEM (n = 3). (B) Flow cytometric analysis of erythroid progenitor populations. Cells cultured for 6 days were stained with antibodies against IL-3R, GPA, CD34, and CD36. The IL-3R and GPA double-negative population was further separated by CD34 and CD36. The IL-3R−GPA−CD34+CD36− population was identified as BFU-E and the IL-3R−GPA−CD34−CD36+ population was identified as CFU-E. The data are shown as mean ± SEM of 3 independent biological replicates. (C) The colony forming ability of sorted progenitor cells was assessed by colony forming assay. Error bars indicate SEM (n = 3). (D) The expression of GPA on day 7 of culture: the GPA+ cells were gated and the percentages of GPA+ cells are shown as mean ± SEM of 3 independent biological replicates. **P < .01. (E) Terminal erythroid differentiation was monitored on indicated days by flow cytometric analysis based on the expression of band 3 and α4 integrin. Representative plots of α4-integrin vs band 3 of GPA+ cells are shown and the erythroblasts are separated into 5 populations: proerythroblasts (I), early basophilic erythroblasts (II), late basophilic erythroblasts (III), polychromatic erythroblasts (IV), and orthochromatic erythroblasts (V). mRNA, messenger RNA; SEM, standard error of the mean.
Next we examined the effects of TET3 knockdown on terminal erythroid differentiation. Terminal erythroid differentiation refers to the process by which erythroid progenitor CFU-E cells differentiate into morphologically recognizable proerythroblasts, which further undergo 3 to 4 mitoses to sequentially become basophilic erythroblasts, polychromatic erythroblasts, and orthochromatic erythroblasts. It has been documented that transition of CFU-E to proerythroblasts is characterized by the expression of GPA.30 Figure 1D shows that on day 7 of culture, whereas ∼60% of luciferase-shRNA–transduced cells became GPA positive, only ∼40% of TET3-shRNA–transduced cells became GPA positive, demonstrating the delayed differentiation of CFU-E to proerythroblasts. Furthermore, the monitoring of surface expression levels of α4 integrin and band 3 to assess erythroid differentiation showed that TET3 knockdown delayed terminal erythroid differentiation on day 9 to day 11, as manifested by impaired downregulation of α4 integrin and upregulation of band 3 (Figure 1E). As described previously, the erythroblasts can be separated into 5 distinct populations: proerythroblasts, early basophilic erythroblasts, late basophilic erythroblasts, polychromatic erythroblasts, and orthochromatic erythroblasts.31 The quantification of percentages of each differentiating stage clearly showed that there are more proerythroblasts and early basophilic erythroblasts in TET3 knockdown cells on day 9 and day 11 than that in luciferase control (supplemental Figure 3A). However, the differences in expression of α4 integrin and band 3 were less apparent on day 13 and similar extents of differentiation were noted on day 16.
Impaired enucleation and generation of bi/multinucleated polychromatic and orthochromatic erythroblasts following TET3 knockdown
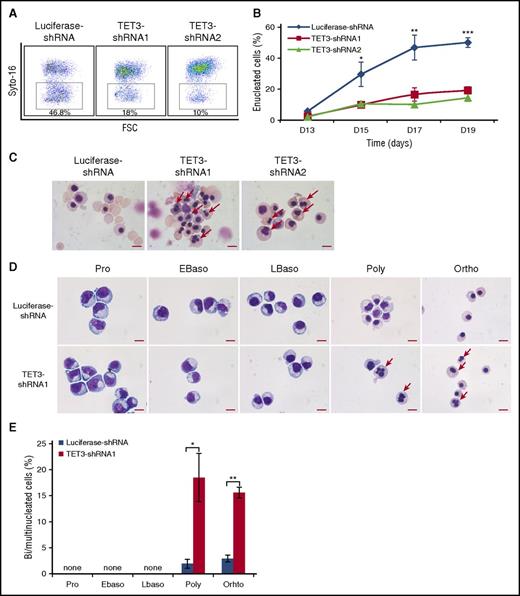
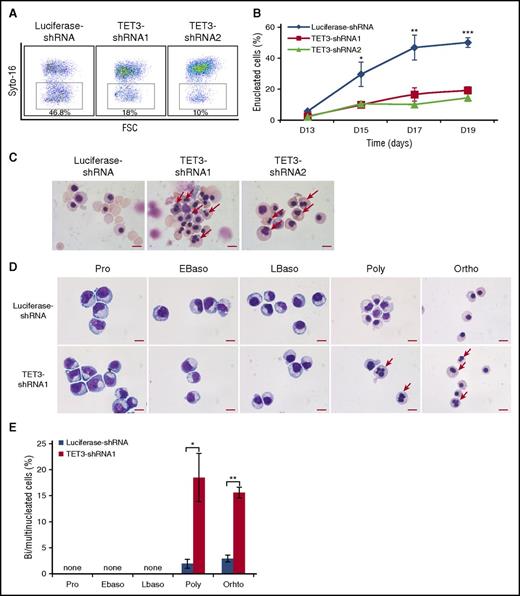
The effect of TET3 knockdown on enucleation, the last step of terminal erythroid differentiation was assessed by Syto-16 staining and Figure 2A shows the representative enucleation profiles. Quantitative analysis shows that under our culture conditions, control cells started to enucleate on day 13 and ∼50% of the cells enucleated by day 19. In contrast, although TET3 knockdown cells also started to enucleate on day 13, the enucleation rate was <20% on day 19 (Figure 2B). The impaired enucleation was confirmed by cytospin analysis, which also revealed many erythroblasts with bi/multinuclei following TET3 knockdown (Figure 2C). To determine at which stage of terminal differentiation bi/multinucleated erythroblasts are generated, we sorted erythroblasts at each distinct developmental stage. Figure 2D shows that bi/multinuclei are only observed in the polychromatic and orthochromatic erythroblasts but not in earlier stage erythroblasts. Quantitative analysis reveals that under our experimental condition, ∼3% of control polychromatic or orthochromatic erythroblasts have a bi/multinucleus. In contrast, knockdown of TET3 increased the percentage of cells with a bi/multinucleus to >15% (Figure 2E).
TET3 knockdown led to bi/multinucleated polychromatic/orthochromatic erythroblasts and impaired enucleation. (A) Representative profiles of enucleation as assessed by Syto-16 staining on day 17 of culture. Enucleation percentage was calculated as Syto-16–negative population in total population. (B) Quantitative analysis of enucleation on indicated days from 3 independent experiments. (C) Representative cytospin images of erythroblasts on day 17 stained with May-Grünwald Giemsa. Red arrows indicate bi/multinucleated erythroblasts. Scale bar = 10 μm. (D) Representative cytospin images of sorted erythroblasts at distinct developmental stages. The bi/multinucleated erythroblasts were observed specifically in TET3 knockdown polychromatic/orthochromatic erythroblasts. Red arrows indicate bi/multinucleated erythroblasts. Scale bar = 10 μm. (E) Quantification of bi/multinucleated erythroblasts in sorted erythroblasts at distinct developmental stages. *P < .05; **P < .01; ***P < .001. FSC, forward scatter.
TET3 knockdown led to bi/multinucleated polychromatic/orthochromatic erythroblasts and impaired enucleation. (A) Representative profiles of enucleation as assessed by Syto-16 staining on day 17 of culture. Enucleation percentage was calculated as Syto-16–negative population in total population. (B) Quantitative analysis of enucleation on indicated days from 3 independent experiments. (C) Representative cytospin images of erythroblasts on day 17 stained with May-Grünwald Giemsa. Red arrows indicate bi/multinucleated erythroblasts. Scale bar = 10 μm. (D) Representative cytospin images of sorted erythroblasts at distinct developmental stages. The bi/multinucleated erythroblasts were observed specifically in TET3 knockdown polychromatic/orthochromatic erythroblasts. Red arrows indicate bi/multinucleated erythroblasts. Scale bar = 10 μm. (E) Quantification of bi/multinucleated erythroblasts in sorted erythroblasts at distinct developmental stages. *P < .05; **P < .01; ***P < .001. FSC, forward scatter.
Knockdown of TET3 led to reduced cell growth, accompanied by increased apoptosis of late-stage erythroblasts
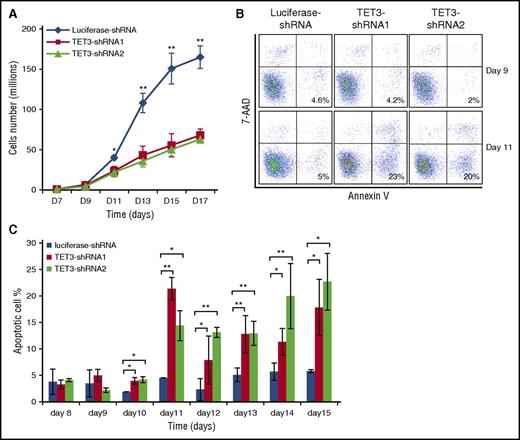
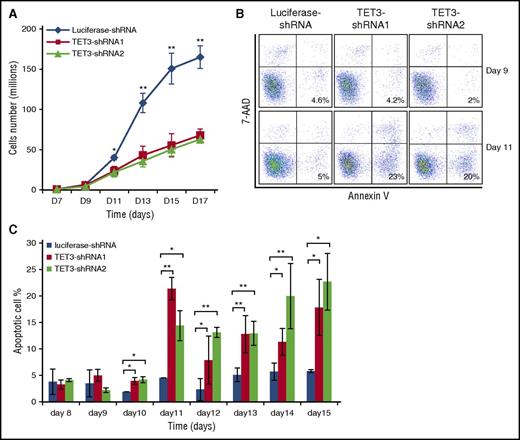
We also examined the effect of TET3 knockdown on cell growth. The growth curves shown in Figure 3A demonstrate no differences in cell numbers between control and TET3 knockdown groups until day 9. A slight decrease in cell number for TET3 knockdown groups was noted on day 11 and more significant decreases were observed from day 13 and onward. To establish the cause for the decreased cell numbers at later stages, we measured apoptosis by flow cytometry. Figure 3B shows the representative profiles of 7-aminoactinomycin D and Annexin V staining on day 9 and day 11. Although <5% Annexin V-positive cells were detected for both control and TET3 knockdown cells on day 9, by day 11, a significantly increased apoptosis was noted in TET3 knockdown cells (∼5% for control and >20% for TET3 knockdown). Quantitative analysis of data from 3 independent experiments showed significantly increased apoptosis upon TET3 knockdown from day 10 and onward (Figure 3C), implying that knockdown of TET3 induces apoptosis of late-stage erythroblasts, accounting for decreased cell numbers.
TET3 knockdown led to reduced cell growth accompanied by increased apoptosis of late-stage erythroblasts. (A) Growth curves of luciferase-shRNA and TET3-shRNA–transduced cells. (B) Representative plots of 7-AAD and Annexin V staining. (C) Quantification of Annexin V-positive cells at indicated days. The results are from 3 independent experiments. *P < .05; **P < .01. 7-AAD, 7-aminoactinomycin D.
TET3 knockdown led to reduced cell growth accompanied by increased apoptosis of late-stage erythroblasts. (A) Growth curves of luciferase-shRNA and TET3-shRNA–transduced cells. (B) Representative plots of 7-AAD and Annexin V staining. (C) Quantification of Annexin V-positive cells at indicated days. The results are from 3 independent experiments. *P < .05; **P < .01. 7-AAD, 7-aminoactinomycin D.
TET3 knockdown predominantly affects gene expression of late-stage erythroblasts
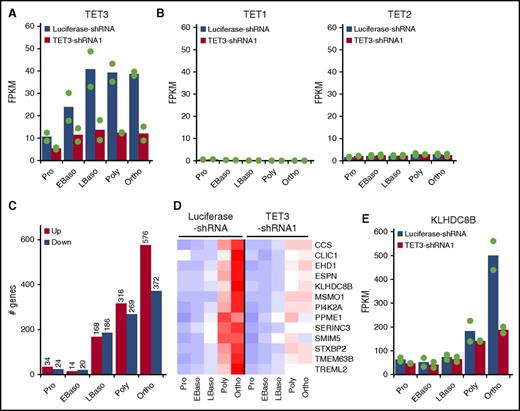
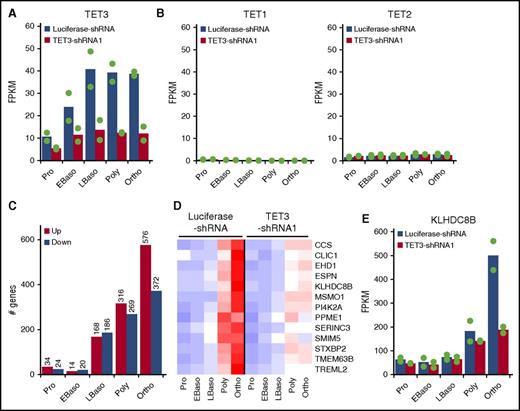
To explore the molecular mechanisms for the observed phenotypic changes, we performed RNA-seq analysis on purified erythroblasts at each distinct developmental stage of both luciferase-shRNA and TET3-shRNA–transduced cells. Figure 4A shows that in accordance with results shown in Figure 1A, 50% to 70% knockdown of TET3 was noted. It is interesting to note that TET3 knockdown did not induce TET1 expression (Figure 4B, left) or result in changes in expression of TET2 (Figure 4B, right). Figure 4C shows the effect of TET3 knockdown on gene expression at each distinct stage of terminal erythroid differentiation. It revealed that 58, 34, 354, 585, and 948 genes are differentially expressed between control and TET3 knockdown proerythroblasts, early basophilic erythroblasts, late basophilic, polychromatic, and orthochromatic erythroblasts, respectively. TET3 knockdown thus predominantly affected gene expression of late-stage erythroblasts. The lists of differentially expressed genes are shown in supplemental Table 1. These results are consistent with our observations that expression of TET3 is significantly upregulated in late-stage erythroblasts and that the phenotypic changes upon TET3 knockdown mainly occur at late-stage erythroblasts.
Effect of TET3 knockdown on gene expression. Control and TET3 knockdown erythroblasts at each distinct developmental stage were sorted and subjected to RNA-seq analysis and bioinformatics analysis. (A) mRNA expression of TET3. (B) mRNA expression of TET1 (left) and TET2 (right). (C) Numbers of differentially expressed genes. The cutoffs for differentially expressed genes are log-fold change >1 and change in FPKM >10. (D) Heatmap of 13 genes, which are highly upregulated at very late stage of normal erythropoiesis and downregulated by TET3 knockdown. The red, white, and blue colors represent the expression level from high to low. (E) mRNA expression of KLHDC8B. FPKM, fragments per kilobase per million fragments mapped.
Effect of TET3 knockdown on gene expression. Control and TET3 knockdown erythroblasts at each distinct developmental stage were sorted and subjected to RNA-seq analysis and bioinformatics analysis. (A) mRNA expression of TET3. (B) mRNA expression of TET1 (left) and TET2 (right). (C) Numbers of differentially expressed genes. The cutoffs for differentially expressed genes are log-fold change >1 and change in FPKM >10. (D) Heatmap of 13 genes, which are highly upregulated at very late stage of normal erythropoiesis and downregulated by TET3 knockdown. The red, white, and blue colors represent the expression level from high to low. (E) mRNA expression of KLHDC8B. FPKM, fragments per kilobase per million fragments mapped.
Knockdown of KLHDC8B mimics TET3 knockdown-induced defects in enucleation and nuclear abnormalities, and overexpression of KLHDC8B partially rescued bi/multinucleation defect
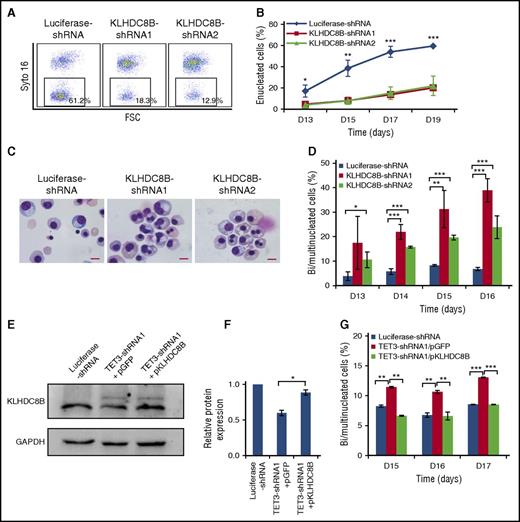
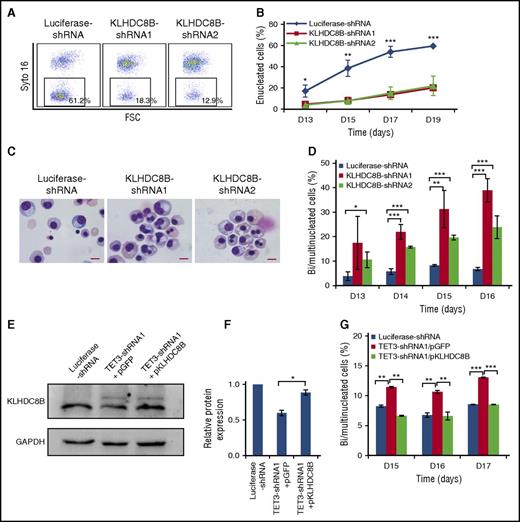
Because enucleation is the last step of terminal erythroid differentiation, we hypothesized that genes selectively upregulated at the very late stage may play important roles in enucleation. To explore the molecular mechanisms for the impaired enucleation due to TET3 knockdown, we focused on genes that are selectively upregulated in the very late-stage erythroblasts during normal erythropoiesis and downregulated by TET3 knockdown. We found 13 genes, which met these 2 criteria (Figure 4D) and this gene set included a mitosis/cytokinesis-associated gene, KLHDC8B (Figure 4E). It has been previously documented that mutation of KLHDC8B is responsible for binucleated Reed-Sternberg cells in Hodgkin lymphoma patients32,33 and that KLHDC8B knockdown in cell lines led to the generation of bi/multinucleated cells.34,35 Based on these findings, we reasoned that KLHDC8B may contribute to the generation of bi/multinucleated polychromatic and orthochromatic erythroblasts. To test this thesis, we examined the effects of KLHDC8B knockdown on erythropoiesis. The reduced expression levels of KLHDC8B mRNA and protein are shown in supplemental Figure 2A and Figure 2B, respectively. Interestingly, knockdown of KLHDC8B had no effects on cell proliferation (supplemental Figure 2C). Importantly, as shown in Figure 5A, knockdown of KLHDC8B resulted in significantly impaired enucleation. Quantitative analysis of data from 3 independent experiments showed that although ∼60% of luciferase-shRNA–transduced cells enucleated by day 19, only ∼15% of KLHDC8B shRNA-transduced cells enucleated (Figure 5B). Moreover, cytospin analysis revealed that KLHDC8B knockdown also led to increased generation of bi/multinucleated late-stage erythroblasts (Figure 5C). Quantitative analysis reveals that although <5% of control erythroblasts have bi/multinuclei, KLHDC8B knockdown increased the percentage of cells with a bi/multinucleus to 20% to 30% on day 16 (Figure 5D). To determine whether downregulation of KLHDC8B directly contributes to the bi/multinucleation enucleation defects of TET3-knockdown cells, we ectopically expressed KLHDC8B in TET3-knockdown erythroblasts. The successful ectopic expression of KLHDC8B protein was confirmed (Figure 5E-F). Importantly, the ectopic expression of KLHDC8B partially rescued the nuclear abnormality (Figure 5G), although it failed to rescue the impaired enucleation (data not shown).
KLHDC8B knockdown mimics TET3 knockdown-induced defects in enucleation, and nuclear abnormalities and ectopic expression of KLHDC8B partially rescued bi/multinucleation defect. (A) Representative profiles of enucleation as assessed by Syto-16 staining on day 17 of culture. Enucleation percentage was calculated as a Syto-16–negative population in the total population. (B) Quantitative analysis of enucleation on indicated days from 3 independent experiments. (C) Representative cytospin images of erythroblasts on day 17 stained with May-Grünwald Giemsa. Scale bar = 10 μm. (D) Quantification of bi/multinucleated erythroblasts in KLHDC8B shRNA-transduced cells. (E) Western blot analysis of KLHDC8B expression. (F) Quantification of KLHDC8B ectopic expression, with GAPDH as control. (G) Quantification of bi/multinucleated erythroblasts following the ectopic expression of KLHDC8B, with empty vector pGFP as control. *P < .05; **P < .01; ***P < .001. D, days; FSC, forward scatter; GAPDH, glyceraldehyde-3-phosphate dehydrogenase; pGFP, plasmid encodes green fluorescent protein; pKLHDC8B, plasmid encodes KLHDC8B and green fluorescent protein.
KLHDC8B knockdown mimics TET3 knockdown-induced defects in enucleation, and nuclear abnormalities and ectopic expression of KLHDC8B partially rescued bi/multinucleation defect. (A) Representative profiles of enucleation as assessed by Syto-16 staining on day 17 of culture. Enucleation percentage was calculated as a Syto-16–negative population in the total population. (B) Quantitative analysis of enucleation on indicated days from 3 independent experiments. (C) Representative cytospin images of erythroblasts on day 17 stained with May-Grünwald Giemsa. Scale bar = 10 μm. (D) Quantification of bi/multinucleated erythroblasts in KLHDC8B shRNA-transduced cells. (E) Western blot analysis of KLHDC8B expression. (F) Quantification of KLHDC8B ectopic expression, with GAPDH as control. (G) Quantification of bi/multinucleated erythroblasts following the ectopic expression of KLHDC8B, with empty vector pGFP as control. *P < .05; **P < .01; ***P < .001. D, days; FSC, forward scatter; GAPDH, glyceraldehyde-3-phosphate dehydrogenase; pGFP, plasmid encodes green fluorescent protein; pKLHDC8B, plasmid encodes KLHDC8B and green fluorescent protein.
TET2 knockdown led to increased growth and delayed differentiation of erythroid progenitors
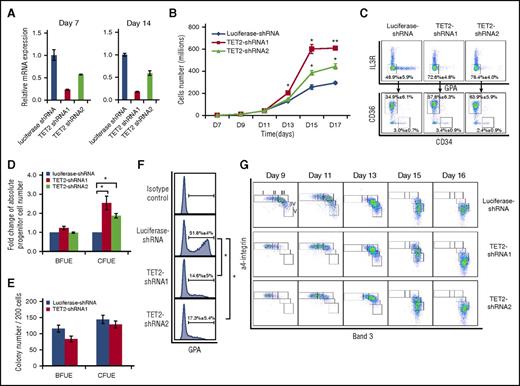
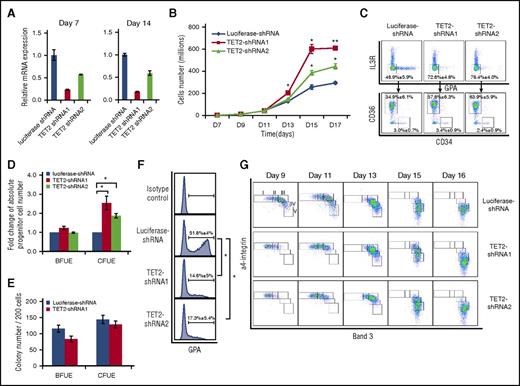
In addition to TET3, TET2 is also expressed in erythroid cells; we used similar approaches to explore the role of TET2 during human erythropoiesis. As shown in Figure 6A, ∼75% and ∼50% knockdown of TET2 was achieved by TET2-shRNA1 and TET2-shRNA2, respectively. Interestingly, in contrast to TET3 knockdown, TET2 knockdown led to enhanced cell growth (Figure 6B). Knockdown by TET2-shRNA1 and TET2-shRNA2 led to a two and threefold increase in cell number, respectively. Analysis of early stage erythropoiesis by flow cytometry showed an increased percentage of erythroid progenitors upon TET2 knockdown. Figure 6C (upper panel) shows that the erythroid progenitor population (IL-3R−GPA−) increased from ∼50% for control to 70% to 80% following TET2 knockdown. Further separation of BFU-E and CFU-E population by monitoring surface expression of CD34 and CD36 revealed that although there is no difference in the percentage of BFU-E population (CD34+CD36−), the percentage of CFU-E (CD34−CD36+) increased from ∼35% to ∼60% following TET2 knockdown (Figure 6C, lower panel). Calculation of absolute numbers of BFU-E and CFU-E cells revealed a 1.5 to twofold increase in CFU-E cells upon TET2 knockdown (Figure 6D). Colony assays of sorted BFU-E and CFU-E cells showed that knockdown of TET2 does not affect their colony forming ability (Figure 6E). These findings demonstrate that TET2 knockdown leads to accumulation of CFU-E cells. To examine the effect of TET2 on differentiation of erythroid progenitors, we measured the expression of GPA expression on day 7 of culture. Although ∼50% of luciferase-shRNA–transduced cells became GPA positive, only ∼15% of TET2 shRNA-transduced cells became GPA positive, demonstrating significantly delayed differentiation from CFU-E to proerythroblasts (Figure 6F). Furthermore, monitoring the surface expression of α4 integrin and band 3 in terminally differentiating erythroblasts showed a delayed differentiation of TET2-shRNA-transduced cells from day 9 to day 13, but the delayed differentiation caught up by day 16 (Figure 6G). Quantification of percentages of erythroblasts at distinct developmental stages is shown in supplemental Figure 3B.
TET2 knockdown led to accumulation and delayed differentiation of erythroid progenitors. (A) Expression of TET2 as assessed by RT-PCR, with β-actin as internal calibrator. (B) Growth curves of luciferase-shRNA and TET2-shRNA–transduced cells. (C) Flow cytometric analysis of erythroid progenitor populations of cells cultured for 6 days. (D) Fold change of absolute progenitor cell numbers in total culture. Error bars indicate SEM (n = 3). (E) Colony forming ability of sorted progenitor cells. (F) Expression of GPA on day 7 of culture. *P < .05; **P < .01. (G) Representative expression profiles of α4 integrin and band 3. The erythroblasts are separated into 5 populations: proerythroblasts (I), early basophilic erythroblasts (II), late basophilic erythroblasts (III), polychromatic erythroblasts (IV), and orthochromatic erythroblasts (V).
TET2 knockdown led to accumulation and delayed differentiation of erythroid progenitors. (A) Expression of TET2 as assessed by RT-PCR, with β-actin as internal calibrator. (B) Growth curves of luciferase-shRNA and TET2-shRNA–transduced cells. (C) Flow cytometric analysis of erythroid progenitor populations of cells cultured for 6 days. (D) Fold change of absolute progenitor cell numbers in total culture. Error bars indicate SEM (n = 3). (E) Colony forming ability of sorted progenitor cells. (F) Expression of GPA on day 7 of culture. *P < .05; **P < .01. (G) Representative expression profiles of α4 integrin and band 3. The erythroblasts are separated into 5 populations: proerythroblasts (I), early basophilic erythroblasts (II), late basophilic erythroblasts (III), polychromatic erythroblasts (IV), and orthochromatic erythroblasts (V).
Effect of TET2 or TET3 knockdown on global levels of 5mC and 5hmC
The primary function of TET family members is to convert 5mC to 5hmC. To examine the effects of TETs on 5mC and 5hmC in erythroid cells, we measured the levels of 5mC of sorted control, TET2 knockdown, and TET3 knockdown erythroid cells at each distinct developmental stage by mass spectrometry. Consistent with previous results using erythroid cells cultured for different days,27 there is a progressive decrease of 5mC levels as erythropoiesis proceeds. Surprisingly, except for the increased 5mC level in TET2 knockdown orthochromatic erythroblasts, neither TET2 nor TET3 knockdown led to a significant increase in 5mC levels at any other developmental stage (Figure 7A). We also measured the levels of 5hmC by mass spectrometry. As shown in Figure 7B, there is an 80% drop in 5hmC levels from CD34+ cells (0.1%) to BFU-E and CFU-E cells (0.02%). Furthermore, from CFU-E to proerythroblasts, the 5hmC levels dropped to almost undetectable levels and remained at this low level. We attempted to examine the effects of TET2 or TET3 knockdown on global levels of 5hmC; however, due to the very low basal levels of 5hmC in erythroid cells, the data were very noisy and no definitive conclusions could be drawn.
Changes of global levels of 5mC and 5hmC during erythropoiesis, and effects of TET2 or TET3 knockdown on global levels of 5mC. (A) 5mC levels of control, TET2, and TET3 knockdown erythroid cells at distinct developmental stages as measured by LC-MS. (B) 5hmC levels of CD34+ cells and erythroid cells at distinct developmental stages as measured by LC-MS. Results are from 3 independent replicates. *P < .05. LC-MS, liquid chromatography-tandem mass spectrometry.
Changes of global levels of 5mC and 5hmC during erythropoiesis, and effects of TET2 or TET3 knockdown on global levels of 5mC. (A) 5mC levels of control, TET2, and TET3 knockdown erythroid cells at distinct developmental stages as measured by LC-MS. (B) 5hmC levels of CD34+ cells and erythroid cells at distinct developmental stages as measured by LC-MS. Results are from 3 independent replicates. *P < .05. LC-MS, liquid chromatography-tandem mass spectrometry.
TET3 knockdown did not affect DNA methylation of the KLHDC8B promoter
Although knockdown of TET2 or TET3 did not significantly affect the global levels of 5mC, this does not exclude the possibility that they may affect the methylation status of individual genes. To understand how TET3 regulates KLHDC8B expression, we examined the methylation status of the KLHDC8B promoter region using methylation-sensitive restriction enzyme analysis, as well as MeDIP followed by quantitative PCR. Among the 5 CCGG sites (−383, −332, −11, +1, +95) in the KLHDC8B promoter region, 3 CCGG sites (−383, −332, +95) could be examined by methylation-sensitive restriction enzyme analysis. Supplemental Figure 4 shows that no cytosine modifications were detected at these 3 sites. Due to the limitation of this method on a single CCGG site in each amplicon, the methylation of the −11 and +1 CCGG sites could not be measured by this assay. To address this problem, MeDIP followed by quantitative PCR was employed to detect the DNA methylation level of KLHDC8B transcription start site (−76 to +55), which contains the −11 and +1 CCGG sites. No cytosine methylation was detected at these 2 sites either (data not shown). These findings suggest that expression of KLHDC8B is not regulated directly via DNA methylation.
Effect of TET3 knockdown on chromatin accessibility
To assess whether TET3 knockdown influenced chromatin accessibility on a genome-wide scale, ATAC was performed on orthochromatic erythroblasts from 3 replicates each of control and TET3 knockdown cells. Principal component analysis performed on called peaks revealed that control and TET3 knockdown samples clustered together, respectively (supplemental Figure 5A). Comparison of differentially called peaks in the 3 replicates of control vs TET3 knockdown data identified by the DiffBind package with DEseq normalization, revealed only 329 differentially expressed peaks from the 30 259 merged regions (supplemental Figure 5B; supplemental Table 3). The Genomic Regions Enrichment Annotations Tool was used to analyze the potential functional significance of differentially expressed peaks identified by ATAC. These analyses revealed that the small number of differentially expressed peaks were at or near loci, representing a heterogeneous, unrelated mix of genes. There was no enrichment in Gene Ontology groups of molecular function, biological processes, cellular components, or mouse phenotype with the exception of the biological process term “response to extracellular stimulus” (KLHDC8B Q-value 7.5e-3; 17 of 18 041 genes) in the downregulated TET3 knockdown set. Analysis of the KLHDC8B locus revealed no differences in chromatin accessibility between control and TET3 knockdown cells (supplemental Figure 5C).
Discussion
The TET family has recently emerged as important epigenetic modifiers and has been documented to play many important roles in a variety of biological processes, including normal and malignant hematopoietic development.36 However, their roles in erythropoiesis have not been well studied. In the present study, we systematically characterized their expression patterns and their potential functions during human erythropoiesis. Our findings uncovered previously unknown roles of TET family members in human erythropoiesis.
A previous study showed that of the 3 TET family members, only TET2 but not TET1 and TET3 are expressed in erythroid cells.22 Consistent with this previous finding, our data also show that TET1 is not expressed in human erythroid cells. However, our data clearly show that in addition to TET2, TET3 is also expressed in human erythroid cells, and that it is expressed at a much higher level than TET2. Moreover, the finding that knockdown of TET3 significantly impaired erythropoiesis further supports the functional relevance of TET3 function in erythroid cells.
TET family members, particularly TET1 and TET2, are often co-expressed in cells and have overlapping or synergistic functions.37-40 Interestingly, knockdown of TET2 or TET3, the 2 TET family members expressed in erythroid cells, led to distinct defects in erythropoiesis. Notably, TET2 knockdown predominantly affected early stage erythropoiesis, whereas TET3 knockdown impaired terminal erythroid differentiation. Moreover, the expression of TET1 or TET2 is not induced or upregulated in TET3 knockdown cells. Our findings imply nonredundant roles of TET family members in human erythropoiesis.
Using our recently developed methods to isolate and characterize all of the distinct stages in human erythropoiesis, we documented that knockdown of TET3 had no effects on erythroid progenitors BFU-E and CFU-Es, but led to increased apoptosis of late-stage erythroblasts and the generation of bi/multinucleated polychromatic/orthochromatic erythroblasts. In contrast, knockdown of TET2 led to the accumulation of erythroid-progenitor CFU-E cells. The identification of stage-specific defects is clinically important because some disease-modifying agents are known to be stage-specific. For example, EPO stimulates proliferation of erythroid progenitors, and patients whose anemia is characterized by defects in late-stage erythropoiesis are resistant to this therapy. On the other hand, the ligand-trapping fusion protein (ACE-536) containing the extracellular domain of human activin receptor type IIB produced rapid and robust increases in erythrocyte numbers by promoting the maturation of late-stage erythroid precursors in vivo.41 Combining the 2 agents produced a synergistic erythropoietic response.42
RNA-seq analysis is now widely used as an approach to explore the molecular basis for the phenotypic changes due to gene manipulation. We would like to note that because dramatic changes in gene expression occur during erythroid differentiation27,28,43-45 and gene manipulation usually affects erythroid differentiation, RNA-seq analysis should be performed using cells at the same developmental stage. In this regard, in contrast to previous studies where comparisons of gene expression were performed using cells cultured for the same period of time,44,45 our RNA-seq analysis following TET3 knockdown was performed using sorted erythroid populations at each distinct developmental stage. RNA-seq analysis on stage-matched erythroid cells enabled us to more accurately identify differentially expressed genes between control and knockdown groups.
In contrast to TET3 knockdown, TET2 knockdown led to hyper-proliferation and impaired differentiation of erythroid progenitors. Because the TET2 gene mutation is one of the most common mutations in MDS21 and dyserythropoiesis is a hallmark of this disorder,46,47 our findings suggest that TET2 gene mutations may account for dyserythropoiesis of MDS. Future studies will focus on defining the molecular mechanisms by which deficiency of TET2 leads to defective erythropoiesis. Such studies should provide novel insights into the mechanistic understanding of normal and disordered erythropoiesis.
The global levels of 5mC and 5hmC have been previously measured on human erythroid cells cultured for different periods of time.22 Our measurements of 5mC levels of sorted erythroid cells at each developmental stage are basically in agreement with previous reports in that there is a trend of progressive decrease as erythropoiesis proceeds. Surprisingly, except for an increase in the 5mC level at orthochromatic erythroblast stage upon TET2 knockdown, neither TET2 nor TET3 knockdown caused significant changes in 5mC levels at any of the other stages. A recent study demonstrated that global 5mC levels of erythroid cells cultured for 10 days from CD34+ cells derived from patients with TET2 mutations were higher than that of control.22 Because TET2 mutation delays erythroid differentiation and 5mC level is high in early stage erythroid cells compared with late-stage erythroid cells, it is very likely that the observed increase in 5mC levels of TET2-mutant erythroid cells is due to delayed erythroid differentiation. Because erythropoiesis is a multistep process and many dynamic changes such as gene expression, protein expression, and epigenetic markers occur during this process, our results underscore the importance of using a pure cell population for the study of erythropoiesis.
In the case of 5hmC, use of highly purified erythroid cells at each distinct developmental stage in conjunction with mass spectrometry analysis, allowed us to clearly demonstrate the dramatic changes of this epigenetic marker during human erythropoiesis: a sharp decline from CD34+ HSCs to erythroid progenitors BFU-E and CFU-E cells, and another sharp decline from erythroid progenitors to terminally differentiating erythroblasts. Because BFU-E cells are the first cell population committed to erythroid lineage, the sharp decline from CD34+ cells to BFU-E cells suggests the requirement of 5hmC downregulation for erythroid commitment. It is interesting to note that despite the upregulation of TET3 during erythropoiesis, its product 5hmC, is not increased during this process. Because TETs can not only convert 5mC to 5hmC, but can also catalyze 5hmC further to 5caC and 5fC,17 one possible explanation is that TET3 actively converts 5hmC to 5caC and 5fC in erythroid cells. Future studies are needed to test this possibility.
To understand how TET3 regulates KLHDC8B expression, we attempted to examine the methylation status of KLHDC8B. However, we did not detect cytosine methylation at the CCGG sites in the promoter region of KLHDC8B, implying that the expression of KLHDC8B is not regulated via the role of TET3 in regulating DNA methylation. Furthermore, ATAC-seq analysis did not reveal differences in chromatin accessibility at the KLHDC8B locus either. We would like to note that the ATAC-seq was performed on orthochromatic erythroblasts. Thus, we could not exclude the possibility that TET3 knockdown may affect the chromatin configure of basophilic or polychromatic erythroblasts. Indeed, TET2 knockdown led to increased chromatin accessibility of proerythroblasts (X.A., N.M., P.G.G., V.P.S., H.Y., Y.W. and X.Q., unpublished data, 2 November 2016).
In conclusion, we documented previously unknown roles of TET family members in human erythropoiesis. Interestingly, TET2 and TET3 exert distinct and nonoverlapping roles. We further identified genes affected by TET3 through RNA-seq analysis on highly pure, stage-matched erythroid cells. In addition, we demonstrated distinct changes of 5mC and 5hmC levels during human erythropoiesis. Although 5mC levels decrease progressively, 5hmC levels decline sharply from HSC to the erythroid progenitor, and then from erythroid progenitor to terminally differentially erythroblasts, suggesting potentially different roles of these 2 epigenetic markers in erythrocyte development. Furthermore, in contrast to expectation, downregulation of either TET2 or TET3 did not affect global levels of 5mC. Our findings provide new and novel insights into the regulation of human erythropoiesis. Our findings also have clinical implications because the phenotypic changes upon TET2 or TET3 knockdown are often observed in diseases associated with disordered erythropoiesis, such as MDS.
The online version of this article contains a data supplement.
The publication costs of this article were defrayed in part by page charge payment. Therefore, and solely to indicate this fact, this article is hereby marked “advertisement” in accordance with 18 USC section 1734.
Acknowledgments
This study was supported in part by grants from the National Institutes of Health, National Institute of Diabetes and Digestive and Kidney Diseases (DK100810 [X.A.] and DK26263 [N.M.]), and the Natural Science Foundation of China (81530005 [X.A.]).
Authorship
Contribution: H.Y., Y.W., X.Q., J.L., Y.H., C.A., J.P., X.G., L.C., Q.K., and W.L. performed research and analyzed the data; J.H. performed bioinformatics analysis of RNA-seq data; P.G.G. and V.P.S. performed ATAC-seq analysis; C.D.H. and N.M. analyzed the data and edited the paper; and X.A. designed experiments, analyzed the data, and wrote the paper.
Conflict-of-interest disclosure: The authors declare no competing financial interests.
Correspondence: Xiuli An, Laboratory of Membrane Biology, New York Blood Center, 310 East 67th St, New York, NY 10021; e-mail: xan@nybc.org.
References
Author notes
H.Y., Y.W., and X.Q. contributed equally to this study.

