Key Points
ILT3 is ectopically expressed on mature CLL cells and CLL progenitors in the bone marrow.
ILT3 controls the activation of Akt kinase in CLL and contributes to a regulatory network defined by a SHIP-1/Deltex1 axis.
Abstract
The high proportion of long-term nonprogressors among chronic lymphocytic leukemia (CLL) patients suggests the existence of a regulatory network that restrains the proliferation of tumor B cells. The identification of molecular determinants composing such network is hence fundamental for our understanding of CLL pathogenesis. Based on our previous finding establishing a deficiency in the signaling adaptor p66Shc in CLL cells, we undertook to identify unique phenotypic traits caused by this defect. Here we show that a lack of p66Shc shapes the transcriptional profile of CLL cells and leads to an upregulation of the surface receptor ILT3, the immunoglobulin-like transcript 3 that is normally found on myeloid cells. The ectopic expression of ILT3 in CLL was a distinctive feature of neoplastic B cells and hematopoietic stem cells, thus identifying ILT3 as a selective marker of malignancy in CLL and the first example of phenotypic continuity between mature CLL cells and their progenitors in the bone marrow. ILT3 expression in CLL was found to be driven by Deltex1, a suppressor of antigen receptor signaling in lymphocytes. Triggering of ILT3 inhibited the activation of Akt kinase upon B-cell receptor (BCR) stimulation. This effect was achieved through the dynamic coalescence of ILT3, BCRs, and phosphatidylinositol-3,4,5-trisphosphate 5-phosphatase 1 into inhibitory clusters at the cell surface. Collectively, our findings identify ILT3 as a signature molecule of p66Shc deficiency in CLL and indicate that ILT3 may functionally contribute to a regulatory network controlling tumor progression by suppressing the Akt pathway.
Introduction
Chronic lymphocytic leukemia (CLL) is characterized by a highly variable clinical course and outcome. In roughly one-third of patients, CLL presents as a stable disease that can last for decades and does not require any therapy.1 The rest of patients, however, exhibit an aggressive disease at the onset of CLL, or develop it after an initial indolent phase, and require treatment.2 The molecular mechanisms behind this dichotomy are as yet unclear. The principal hypothesis proposed to explain the benign disease presentation in CLL stems from the biology of the cells giving rise to this tumor. CLL cells express B-cell receptors (BCRs) that can recognize various self-antigens.3-5 In health, autoreactive B cells are typically silenced by the induction of anergy, a condition of unresponsiveness to BCR triggering that promotes cell quiescence.6 Accordingly, it has been hypothesized that autoreactivity of CLL cells may promote their anergy, resulting in a milder disease course. In support of this notion, it has been shown that the most reliable molecular marker of favorable prognosis in CLL, the mutated status of immunoglobulin heavy chain (IGHV) genes, identifies patients in which malignant B cells are largely anergic.7,8 Anergy, therefore, has been proposed as one of the mechanisms contributing to a regulatory network that allows CLL patients to control tumor progression.
One of the intriguing particularities of CLL arises from the fact that in health anergic autoreactive B cells are typically susceptible to apoptosis, whereas in CLL they are notably resistant to it.9 Imbalance in the expression of antiapoptotic and proapoptotic proteins (eg, Bcl-2 and DAPK-1) has been identified among the intrinsic factors underlying such resistance.10,11 Our research provided further mechanistic insight into this question by establishing that CLL cells have an impaired expression of p66Shc, an adaptor protein with a dual function.12 p66Shc acts as a signaling adaptor attenuating mitogenic and chemotactic signaling in lymphocytes.13-15 Additionally, p66Shc mediates the production of reactive oxygen species, which are potent inducers of apoptosis.16,17 Consistently, we found that a deficiency in p66Shc was responsible for CLL cell resistance to apoptosis and a skewing toward the expression of antiapoptotic Bcl-2 family members.12 Interestingly, we also found that p66Shc deficiency in CLL indirectly prolongs neoplastic cell survival by influencing the expression of sphingosine-1-phosphate 1 receptor (S1PR1) and C-C chemokine receptor type 7 (CCR7), which regulate B-cell trafficking and whose modulation could be responsible for the accumulation of CLL cells in the prosurvival stromal niche.18
The ability of p66Shc to modulate genes implicated in apoptosis and chemotaxis suggests that it may play a wider role in the regulation of gene expression in B cells and may also determine some of characteristic phenotypic traits of CLL cells. Here we show that an impaired expression of p66Shc indeed had a significant impact on the transcriptional profile of CLL cells. Among the genes downregulated by p66Shc, we identified surface receptor immunoglobulin-like transcript 3 (ILT3) as a selective marker of CLL malignancy. Here, we have investigated the mechanism of ILT3 expression and its function in CLL cells. The results implicate the suppressor of antigen receptor signaling in lymphocytes, Deltex1 (DTX1), in promoting ILT3 expression in CLL and identify ILT3 as an inhibitor of BCR-dependent Akt activation through the recruitment of phosphatidylinositol-3,4,5-trisphosphate 5-phosphatase 1 (SHIP-1).
Materials and methods
Lymphocyte isolation from donors
Samples of peripheral blood and bone marrow of CLL patients, patients with non-Hodgkin B-cell lymphoma, healthy donors, and patients with nonlymphoproliferative diseases were analyzed after receiving signed informed consent according to institutional guidelines. Use of human samples was approved by the Ethical Committee Regione Toscana at the University Hospital of Siena for the use of blood samples of CLL patients and healthy donors. B cells were purified by negative selection using RosetteSep cocktails (StemCell) to purity >85% for healthy donors (>97% for CLL patients). Mononuclear cells from bone marrow were isolated by Ficoll gradient centrifugation. Lymphocytes were either used fresh or frozen till stimulation.
Cell lines, culture conditions, flow cytometry, and immunoblotting conditions are indicated in the supplemental Methods (available on the Blood Web site).
Gene expression analysis
Two independent messenger RNA (mRNA) extractions were profiled using Affymetrix HuGene 2.0-st-v1 array. An analysis of variance was applied to identify transcripts with a fold-change >2 and a statistically significant P value (P < .05).19 Transcripts were further classified according to the Gene Ontology for Biological Processes (Fisher’s exact test) using the online Enrichr software.20 Conditions for quantitative reverse transcription polymerase chain reaction (qRT-PCR) analysis are indicated in the supplemental Methods.
DTX1 knockout and overexpression
DTX1 knockout was performed by clustered regularly interspaced short palindromic repeats (CRISPR) technology as indicated in the supplemental Methods. For overexpression, full-length DTX1 was amplified using as template pCMV-HDX-mycx3 (a gift from Hideyuki Okano) and cloned into pEXPR-IBA103 (IBA-GmBH).
Cell stimulation, immunoblotting, and apoptosis assay
CLL cells (1.5 × 10⁶ cells per sample) isolated from immunoglobulin M (IgM)–positive patients were incubated on ice with 10 µg/mL mouse IgG1 isotype control or anti-ILT3 ZM4.1 antibody (Biolegend), washed, and stimulated at 37°C with 10 µg/mL of goat F(ab)2 anti-mouse IgG Fcgamma-specific antibody alone or with goat anti-human IgG F(ab)2-specific antibody (Jackson Immuneresearch). For experiments of apoptosis induction, 1.5 × 10⁵ cells per sample were incubated with primary antibodies on ice, washed, and cultured with stimulatory secondary antibodies in complete RPMI for 24 hours. For experiments with SHIP-1 inhibition, 3 α-aminocholestane (3AC)21 was added to cells 30 minutes prior to cell stimulation and to all reagents used. Immunoblots were quantified on scanned images with ImageJ1.48.
Confocal microscopy
A total of 0.3 × 10⁶ cells per sample were incubated with anti-ILT3 antibody on ice, washed, and stimulated with goat anti-mouse-Alexa555 (Invitrogen) alone or with biotinylated goat anti-human IgG F(ab)2 at 37°C. Cells were fixed, stained with Streptavidin-Alexa488 (Invitrogen), and adhered onto polylysine-coated slides. For phospho-SHIP-1 analysis, cells were further permeabilized in 0.2% saponin and stained with anti-phospho-SHIP-1 Tyr1020 (CellSignaling) followed by anti-rabbit-Alexa488/555. Confocal images were acquired on LSM700 (CarlZeiss) using a ×63 objective with Zen-2009 software and processed with ImageJ. Colocalization was assessed by calculating the Manders coefficient with JACoP plugin (ImageJ).
Statistics
Mean values, standard deviation (SD), standard error of the mean (SEM), and P values associated with 2-tailed Student t test were calculated using the GraphPad software.
Data deposit
RNA-sequencing data have been deposited in the ArrayExpress database at European Bioinformatics Institute (http://www.ebi.ac.uk/arrayexpress) under accession number E-MTAB-6082.
Results
p66Shc deficiency modulates the transcriptome in CLL cells and upregulates the expression of ILT3
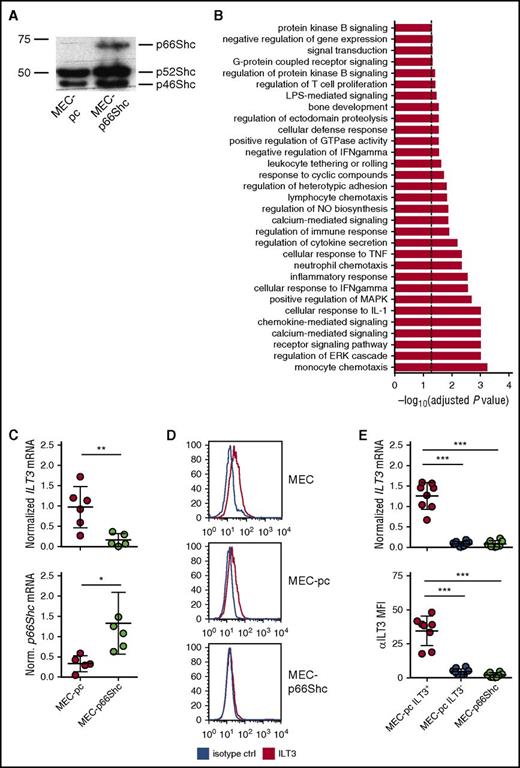
To investigate whether p66Shc influences gene expression in CLL cells, we compared the transcriptional profiles of the CLL-derived B-cell line MEC-1,22 which lacks p66Shc expression,19 transfected with either control empty vector (MEC-pc) or the same vector encoding p66Shc (MEC-p66Shc) (Figure 1A). Microarray gene expression analysis revealed that p66Shc expression had a profound impact on the transcriptional profile of MEC cells, influencing the expression of 303 genes (supplemental Table 2). Gene ontology profiling, performed on transcripts with a significant change in expression, showed that p66Shc controls various cellular processes (Figure 1B; supplemental Table 3).
p66Shc deficiency results in an upregulation of ILT3 in the CLL-derived MEC-1 cell line. (A) Immunoblot analysis of p66Shc expression in MEC-pc and MEC-p66Shc cells. (B) Gene categories significantly enriched for genes differentially expressed in MEC-p66Shc vs MEC-pc cells (Fisher’s exact test, adjusted P < .05, dashed line). (C) qRT-PCR analysis of ILT3 expression (upper panel) and p66Shc expression (lower panel) in MEC-pc and MEC-p66Shc cells. Each dot represents an independent measurement. (D) Flow cytometric analysis of ILT3 surface expression on wild-type MEC, MEC-pc, and MEC-p66Shc cells. (E) qRT-PCR analysis of ILT3 gene expression (upper panel) and flow cytometric analysis of ILT3 surface expression (lower panel) on individual MEC-pc and MEC-p66Shc clones (n = 18 and 8, respectively). Shown are mean values ± SD. *P < .05; **P < .01; ***P < .001. MFI, mean fluorescence intensity.
p66Shc deficiency results in an upregulation of ILT3 in the CLL-derived MEC-1 cell line. (A) Immunoblot analysis of p66Shc expression in MEC-pc and MEC-p66Shc cells. (B) Gene categories significantly enriched for genes differentially expressed in MEC-p66Shc vs MEC-pc cells (Fisher’s exact test, adjusted P < .05, dashed line). (C) qRT-PCR analysis of ILT3 expression (upper panel) and p66Shc expression (lower panel) in MEC-pc and MEC-p66Shc cells. Each dot represents an independent measurement. (D) Flow cytometric analysis of ILT3 surface expression on wild-type MEC, MEC-pc, and MEC-p66Shc cells. (E) qRT-PCR analysis of ILT3 gene expression (upper panel) and flow cytometric analysis of ILT3 surface expression (lower panel) on individual MEC-pc and MEC-p66Shc clones (n = 18 and 8, respectively). Shown are mean values ± SD. *P < .05; **P < .01; ***P < .001. MFI, mean fluorescence intensity.
We reasoned that genes upregulated in MEC-pc cells might be also expressed at higher levels in B cells with an intrinsic p66Shc deficiency, such as CLL B cells,12 and focused on the genes with immune function the expression of which was significantly higher in MEC-pc cells (Table 1). Intriguingly, among those, we identified LILRB4 (ILT3), a gene that encodes a myeloid linage-specific surface receptor and member of the immunoglobulin-like transcript family with immunomodulatory function.23-25
In order to validate the microarray data, we evaluated the expression of ILT3 in MEC-pc and MEC-p66Shc cells. The inverse correlation between ILT3 and p66Shc expression was confirmed by qRT-PCR (Figure 1C) and flow cytometry (Figure 1D), showing that MEC-pc cells, similarly to the parental MEC cells, but not MEC-p66Shc cells, had detectable levels of surface ILT3. Of note, we observed that at the clonal level ILT3 expression was not homogenous because only a proportion of MEC-pc-derived individual clones were positive for ILT3, whereas the remaining clones of MEC-pc were negative for it, similar to all MEC-p66Shc-derived clones (Figure 1E; supplemental Figure 1). Hence, p66Shc deficiency in MEC cells is a required, yet not sufficient, condition to drive an ectopic expression of ILT3.
ILT3 is a selective marker of mature and progenitor tumor cells in CLL
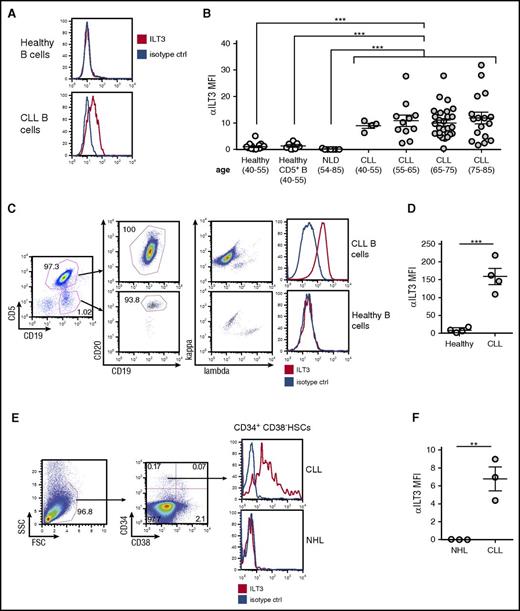
To assess the association between an impaired p66Shc expression and ectopic ILT3 in primary cells, we measured ILT3 levels on freshly isolated CLL B cells, which have a documented p66Shc deficiency,12 and on B cells freshly isolated from healthy donors. We found that the surface expression of ILT3 was a specific signature of B cells from CLL patients that did not correlate with age (n = 56; mean age, 70 ± 9.3) and distinguished them from B cells of healthy donors (n = 17; mean age, 50 ± 5.9) and patients with nonlymphoproliferative diseases (n = 7; mean age, 71 ± 10.6), which were representative of the senior age group (Figure 2A-B; supplemental Table 4 with patient characteristics). We asked whether ILT3 expression may be a selective marker of B cells expressing CD5, a conventional surface marker of CLL cells.26 However, CD5+ B cells of healthy donors were negative for ILT3 expression (n = 7) (Figure 2B), suggesting that ectopic ILT3 on B cells was associated with CLL status. Also, although unmutated IGHV status is characterized by lower p66Shc levels,12 no differences in ILT3 levels were observed in CLL patients with mutated and unmutated IGHV (supplemental Figure 2). This suggests that a decrease in p66Shc levels below a certain threshold may be a sufficient condition to upregulate ILT3.
Ectopic expression of ILT3 is specific for peripheral blood CLL cells and CLL progenitors in the bone marrow. (A) Flow cytometric analysis of surface ILT3 expression on representative samples of CD19+ healthy and CLL B cells. (B) Flow cytometric analysis of surface ILT3 expression on B cells from healthy donors, patients with nonlymphoproliferative diseases (NLD), and CLL patients grouped by age. (C) Gating strategy of multicolor flow cytometric analysis to distinguish neoplastic and normal B cells in the same representative CLL patient. (D) Quantification of ILT3 surface expression in healthy and malignant B cells from 4 CLL patients. (E) Gating strategy for flow cytometric analysis to identify HSCs among mononuclear cells isolated from the bone marrow of representative patients. (F) Quantification of surface ILT3 expression on bone marrow HSCs isolated from 3 CLL patients and 3 patients with NHL. Shown are mean values ± SEM. **P < .01; ***P < .001.
Ectopic expression of ILT3 is specific for peripheral blood CLL cells and CLL progenitors in the bone marrow. (A) Flow cytometric analysis of surface ILT3 expression on representative samples of CD19+ healthy and CLL B cells. (B) Flow cytometric analysis of surface ILT3 expression on B cells from healthy donors, patients with nonlymphoproliferative diseases (NLD), and CLL patients grouped by age. (C) Gating strategy of multicolor flow cytometric analysis to distinguish neoplastic and normal B cells in the same representative CLL patient. (D) Quantification of ILT3 surface expression in healthy and malignant B cells from 4 CLL patients. (E) Gating strategy for flow cytometric analysis to identify HSCs among mononuclear cells isolated from the bone marrow of representative patients. (F) Quantification of surface ILT3 expression on bone marrow HSCs isolated from 3 CLL patients and 3 patients with NHL. Shown are mean values ± SEM. **P < .01; ***P < .001.
We next asked whether ILT3 expression could distinguish neoplastic and normal B cells in the same CLL patient. In 4 CLL patients analyzed, the nonneoplastic B-cell population, which was identified as CD19+CD5−CD20high immunoglobulin light-chain κ/λ mixed, was negative for ILT3 expression, whereas malignant CD19+CD5+CD20low/mid κ/λ light-chain monoclonal CLL cells were positive for it (Figure 2C-D). Hence, surface ILT3 was strictly indicative of the malignancy status, further validating ILT3 as a potential marker for CLL cells.
Recently, it has been shown that hematopoietic stem cells (HSCs) isolated from bone marrow of CLL patients are primed for the development of CLL-like malignant clones and therefore might represent progenitor CLL cells endowed with cancer stem cell properties.27 We asked whether an ectopic expression of ILT3 is programmed already at the level of CLL progenitors and analyzed the surface expression of ILT3 on CD34+CD38- HSCs isolated from the bone marrow of 3 CLL donors and 3 patients with non-Hodgkin B-cell lymphoma (NHL) (Figure 2E-F). We chose NHL as non-CLL disease control because we did not detect ILT3 expression on CD19+ B cells isolated from peripheral blood of NHL patients with a detectable circulating tumor population (n = 10; supplemental Figure 2; supplemental Table 5 with patient characteristics). We observed that bone marrow HSCs were positive for ILT3 expression only in CLL patients, but not NHL donors (Figure 2E-F). This finding suggests that ILT3 represents a unique marker of CLL cells already at the level of progenitor cancer cells.
Ectopic ILT3 expression in CLL is driven by DTX1
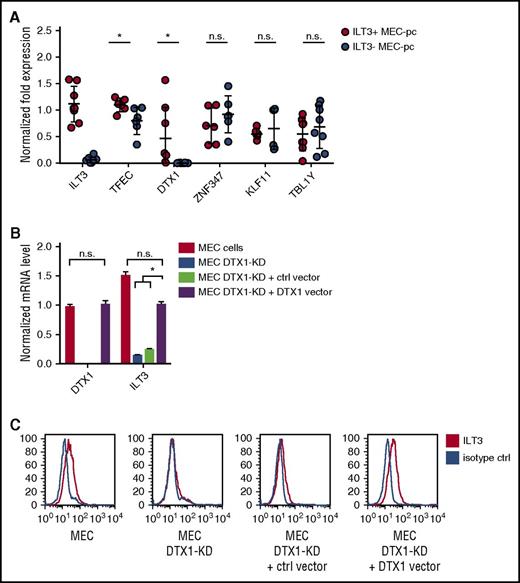
ILT3 is normally expressed by myeloid cells such monocytes, macrophages, and dendritic cells.23 We therefore sought to establish the molecular mechanism driving its ectopic upregulation on CLL cells. We noted that, along with an enhanced expression of genes with immunomodulatory function, p66Shc deficiency also upregulated transcripts of genes implicated in the regulation of gene expression (Table 1). We analyzed their levels in MEC-pc clones with differential ILT3 expression and observed that, out of 6 candidates, only TFEC and DTX1 were significantly upregulated in ILT3-positive MEC-pc clones compared with ILT3-negative clones (Figure 3A). TFEC mRNA, however, was found at substantially high levels in ILT3-negative cells, suggesting that its expression was dispensable for ILT3 induction. Conversely, DTX1 mRNA in ILT3-negative clones was virtually absent, whereas it was detected in ILT3-positive clones (Figure 3A). We concluded that, out of 2 candidates, DTX1 might be implicated in the regulation of ILT3 expression.
DTX1 drives ILT3 expression in CLL cells. (A) qRT-PCR analysis of transcription regulator expression in ILT3-positive and ILT3-negative MEC-pc clones (n = 6-8 clones). qRT-PCR analysis of DTX1/ILT3 expression (B) and flow cytometric analysis of surface ILT3 in control MEC cells, MEC cells with DTX1 CRISPR-mediated knockdown (MEC DTX1-KD), and MEC DTX1-KD cells transfected with either control vector or the same vector encoding DTX1 (C). Shown are mean values ± SEM. *P < .05. n.s., not significant.
DTX1 drives ILT3 expression in CLL cells. (A) qRT-PCR analysis of transcription regulator expression in ILT3-positive and ILT3-negative MEC-pc clones (n = 6-8 clones). qRT-PCR analysis of DTX1/ILT3 expression (B) and flow cytometric analysis of surface ILT3 in control MEC cells, MEC cells with DTX1 CRISPR-mediated knockdown (MEC DTX1-KD), and MEC DTX1-KD cells transfected with either control vector or the same vector encoding DTX1 (C). Shown are mean values ± SEM. *P < .05. n.s., not significant.
To verify our hypothesis, we knocked out DTX1 in MEC cells by CRISPR technology. DTX1 knockout led to an impairment of ILT3 expression, which was rescued by forced DTX1 (Figure 3B-C), thus implicating it in ILT3 transcription in B cells. Of note, this property was found to be restricted to CLL B cells, based on 2 observations. First, B cells isolated from CLL patients and healthy donors had comparable levels of DTX1 mRNA (supplemental Figure 3A). Because only CLL cells were positive for ILT3, this suggested that DTX1 mediates ILT3 upregulation specifically in the setting of CLL. This finding was further confirmed by the fact that DTX1 overexpression in a B cell line of non-CLL origin did not lead to an upregulation of ILT3 protein, despite an increase of ILT3 mRNA levels (supplemental Figure 3B-C). Hence, our findings collectively suggest that DTX1 acts in synergy with other CLL-specific factors to promote an ectopic expression of ILT3 in CLL cells.
ILT3 regulates BCR signaling by inhibiting the activation of Akt
Both DTX1 and ILT3 exert a regulatory function in immune cells.23,24,28-30 DTX1 is induced in T-cell anergy and contributes to the maintenance of a suppressed T-cell status by diminishing the levels of the activatory kinase MEKK1 and by promoting the expression of anergy-associated molecules, including Gadd45b and Cbl-b.28,31 ILT3 bears 3 inhibitory immunoreceptor tyrosine-based inhibition motifs in its cytoplasmic tail and has been implicated in the negative regulation of integrin, major histocompatibility complex class II and Fc receptor signaling in monocytes.23 Based on these reports, we hypothesized that ILT3 could have a regulatory function in CLL cells. Given the importance of BCR signaling in CLL pathogenesis,32 we decided to investigate the influence of ILT3 triggering on the activation of the BCR pathway in CLL cells (Table 2).
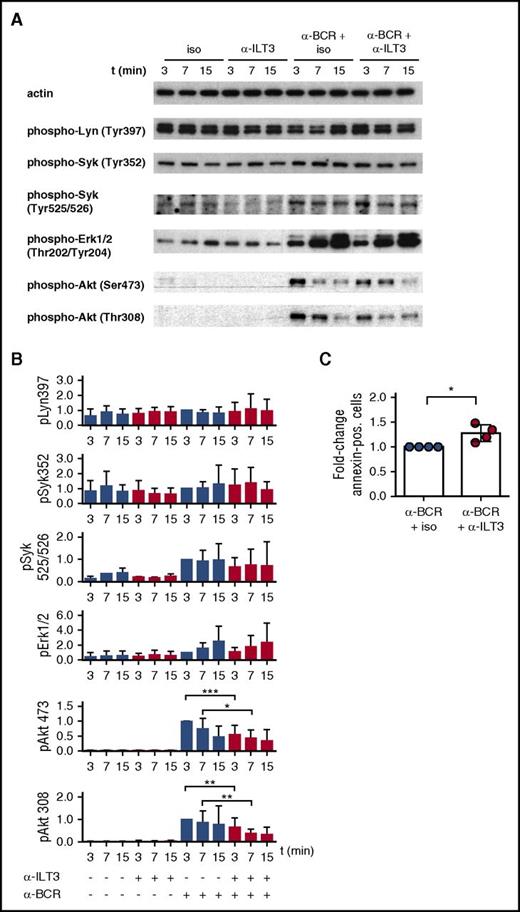
Signaling experiments on CLL cells were performed using a combination of ILT3-specific antibody and secondary antibodies to cross-link ILT3 in the presence or absence of BCR stimulation. The overall status of the BCR signaling pathway was assessed by analyzing the activation of proximal kinases Lyn and Syk and of downstream effector kinases Erk and Akt. In line with the reported heterogeneity in BCR responsiveness characterizing CLL cells,8 we observed that immunoblot analysis on freshly isolated CLL B cells showed variable basal levels of phosphorylation for Lyn Tyr397 and Syk Tyr352, which was not further increased following BCR stimulation (Figure 4A-B). In contrast, Syk Tyr525/526, Erk, and Akt responded to BCR stimulation, according to what has been reported33,34 (Figure 4A-B).
ILT3 triggering inhibits BCR-dependent activation of Akt in CLL cells. Representative immunoblots (A) and relative quantitative analysis (B) of CLL cells stimulated for 3, 7, and 15 minutes with isotype control or ILT3-specific antibody in the presence or absence of BCR stimulation. Cells were isolated from the patients indicated in Table 2. Quantification analysis of phospho-Lyn (pLyn), pSyk, and pErk was performed for n = 12 patients; pAkt Thr308/Ser473 was analyzed for n = 17 patients. (C) Quantitative analysis of apoptotic annexin V–positive cells isolated from 4 CLL patients and stimulated for 24 hours as indicated. Shown are mean values ± SD. *P < .05; **P < .01; ***P < .001.
ILT3 triggering inhibits BCR-dependent activation of Akt in CLL cells. Representative immunoblots (A) and relative quantitative analysis (B) of CLL cells stimulated for 3, 7, and 15 minutes with isotype control or ILT3-specific antibody in the presence or absence of BCR stimulation. Cells were isolated from the patients indicated in Table 2. Quantification analysis of phospho-Lyn (pLyn), pSyk, and pErk was performed for n = 12 patients; pAkt Thr308/Ser473 was analyzed for n = 17 patients. (C) Quantitative analysis of apoptotic annexin V–positive cells isolated from 4 CLL patients and stimulated for 24 hours as indicated. Shown are mean values ± SD. *P < .05; **P < .01; ***P < .001.
Intriguingly, although ILT3 triggering alone did not have any effect on the phosphorylation of the molecules analyzed, a simultaneous triggering of ILT3 and BCR selectively inhibited the activation of Akt Thr308 and Ser473 (Figure 4A-B). Interestingly, the inhibitory effect of ILT3 was stronger for Thr308, and it had more variability for Ser473, when considering individual patients (supplemental Figure 4). As a functional consequence of inhibitory signaling, ILT3 engagement enhanced the apoptotic response in CLL cells stimulated through the BCR (Figure 4C). Hence, considering the critical role of Akt in promoting prosurvival and mitogenic signaling in CLL cells,35-38 our findings suggest that ILT3 has an important regulatory function in these cells.
Inhibition of BCR-mediated Akt activation by ILT3 is achieved through the coalescence of surface BCR and ILT3
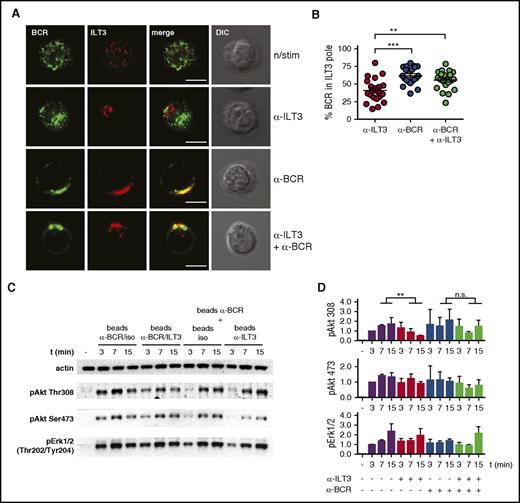
To elucidate the molecular mechanism behind the inhibitory potential of ILT3 we imaged CLL cells, either resting or stimulated. We observed that on resting cells ILT3 and BCR were present as microclusters uniformly distributed over the cell surface, whereas on stimulated cells these receptors concentrated in a confined membrane region, likely because of a capping induced by stimulatory antibodies (Figure 5A). Interestingly, BCR and ILT3 differed in the patterning behavior. BCR capped only when it was stimulated, and ILT3 triggering did not have an influence on it (Figure 5A). However, ILT3 capping could be induced by 2 conditions: either by stimulating ILT3 or by stimulating BCR alone (Figure 5A-B). Moreover, we observed that stimulated BCR polarized to the same membrane region as ILT3 (Figure 5A-B). Because the reagents used for stimulation did not induce physical cross-linking between receptors (supplemental Figure 5), we concluded that because of the intrinsic signaling properties of CLL cells, BCR activation promoted the recruitment of ILT3 to the same membrane region.
Stimulated ILT3 and BCR cocluster in a confined membrane region where ILT3 inhibits BCR-dependent activation of Akt. (A) Representative immunofluorescence images of CLL cells, either resting or stimulated for 15 minutes as indicated. Staining represents surface ILT3 and BCR. (B) Quantitative analysis of surface BCR polarization toward the ILT3 pole in CLL cells stimulated for 15 minutes as indicated. Dots represents single cells. The analysis is representative of experiments with CLL cells from 5 donors. (C) Representative immunoblot of CLL cells stimulated with beads coated individually with isotype control, ILT3- and BCR-specific antibodies, or with their combination, as indicated. (D) Quantitative immunoblot analysis (n = 3 experiments). Scale bars represent 5 μm. Shown are mean values ± SD. **P < .01; ***P < .001. DIC, differential interference contrast image.
Stimulated ILT3 and BCR cocluster in a confined membrane region where ILT3 inhibits BCR-dependent activation of Akt. (A) Representative immunofluorescence images of CLL cells, either resting or stimulated for 15 minutes as indicated. Staining represents surface ILT3 and BCR. (B) Quantitative analysis of surface BCR polarization toward the ILT3 pole in CLL cells stimulated for 15 minutes as indicated. Dots represents single cells. The analysis is representative of experiments with CLL cells from 5 donors. (C) Representative immunoblot of CLL cells stimulated with beads coated individually with isotype control, ILT3- and BCR-specific antibodies, or with their combination, as indicated. (D) Quantitative immunoblot analysis (n = 3 experiments). Scale bars represent 5 μm. Shown are mean values ± SD. **P < .01; ***P < .001. DIC, differential interference contrast image.
To understand whether such particular receptor patterning was at the basis of ILT3-dependent inhibition of Akt, we carried out an immunoblot analysis of Akt activation on CLL cells stimulated by magnetic beads coated with anti-BCR and anti-ILT3 antibodies in different combinations. When beads were coated with a mixture of BCR-specific and ILT3-specific antibodies, ILT3 inhibited BCR-induced activation of Akt, as expected (Figure 5C, left half of the blot; and Figure 5D). However, when these antibodies were present on separate beads, we did not observe ILT3-mediated inhibition of Akt phosphorylation (Figure 5C, right half of the blot; and Figure 5D). Thus, an essential condition for ILT3 to accomplish its inhibitory function is the vicinity to the BCR, which is achieved through stimulation-driven coalescence of these receptors.
ILT3 regulates Akt activity through the recruitment of activated SHIP-1
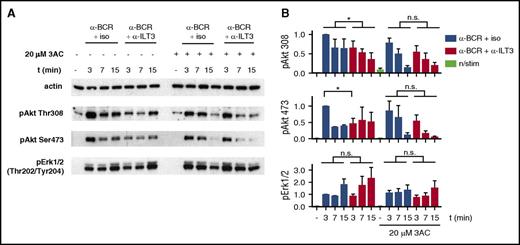
The evidence for cosegregation of ILT3 and BCR led us to hypothesize that the inhibitory potential of ILT3 could depend on the recruitment of a molecule affecting the BCR-dependent activation of Akt. Considering the more pronounced inhibitory effect of ILT3 triggering on the Akt phospho-residue Thr308, which is activated through phosphatidylinositol triphosphate/phosphoinositide-dependent kinase-1 axis,39 an interesting candidate for ILT3 partner was the Src homology-2 domain-containing (SHIP-1), which hydrolyzes phosphatidylinositol triphosphate produced in response to BCR triggering.40 Hence, we assessed ILT3 function in CLL cells treated with 3AC, a selective SHIP-1 inhibitor.21 Remarkably, the inhibitory effect of ILT3 triggering on Akt activation was lost upon treatment with 3AC (Figure 6A-B), suggesting that the inhibitory function of ILT3 requires SHIP-1 activity.
Inhibition of BCR-dependent Akt activation by ILT3 requires SHIP-1. (A) Representative immunoblot of CLL cells, treated with the SHIP-1 inhibitor 3AC or mock treated, and stimulated as indicated for 3, 7, and 15 minutes. (B) Quantitative immunoblot analysis (n = 4 patients). Shown are mean values ± SD. *P < .05.
Inhibition of BCR-dependent Akt activation by ILT3 requires SHIP-1. (A) Representative immunoblot of CLL cells, treated with the SHIP-1 inhibitor 3AC or mock treated, and stimulated as indicated for 3, 7, and 15 minutes. (B) Quantitative immunoblot analysis (n = 4 patients). Shown are mean values ± SD. *P < .05.
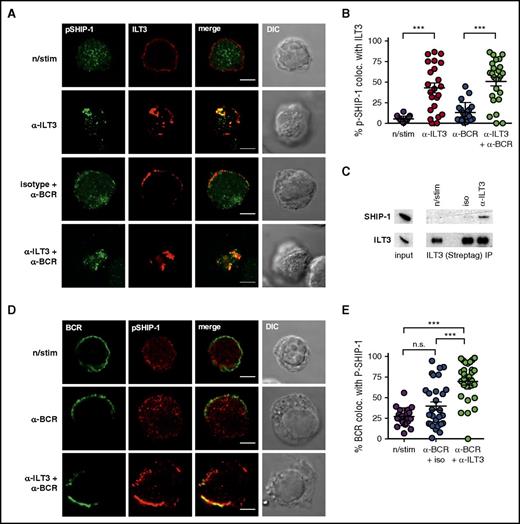
To establish whether active SHIP-1 was recruited to ILT3, we assessed the colocalization of stimulated ILT3 and an active form of SHIP-1 (phospho-SHIP1 Tyr1020). We were unable to detect phospho-SHIP-1 by immunofluorescence in primary CLL cells, likely owing to its relatively low levels, even though detectable by immunoblotting (supplemental Figure 6). We therefore performed imaging experiments with a non-CLL B-cell line, BJAB, overexpressing ILT3 (BJAB-ILT3) (supplemental Figure 7A). BJAB cells are commonly used to study BCR signaling41,42 and have substantial levels of phospho-SHIP-1 detectable by immunofluorescence. We were unable to assess the potential of ILT3 to inhibit BCR-dependent Akt activation in these cells because of high basal levels of Akt phosphorylation (supplemental Figure 7B). However, similar to endogenous ILT3 in CLL cells, overexpressed ILT3 accumulated with the BCR in the same membrane region upon stimulation (supplemental Figure 7C-D). Moreover, we observed that stimulation-induced ILT3 clusters colocalized with active SHIP-1 in BJAB-ILT3 cells (Figure 7A-B), which was further corroborated by ILT3 immunoprecipitation, indicating an interaction between ILT3 and SHIP-1 (Figure 7C). This led us to hypothesize that activated ILT3 could mediate the recruitment of phospho-SHIP-1 to the BCR and thus inhibit BCR-induced activation of Akt. Accordingly, the colocalization of phospho-SHIP-1 with BCR increased when ILT3 and BCR were triggered simultaneously compared with when BCR was stimulated alone (Figure 7D-E). Altogether, our findings suggest that ILT3 stimulation causes the recruitment of phosphorylated SHIP-1 to the BCR, hence providing a mechanistic basis to ILT3-mediated inhibition of Akt.
ILT3 inhibits Akt activation by recruiting active SHIP-1 to the BCR. (A) Representative immunofluorescence images and (B) colocalization analysis of phospho-SHIP-1 (Tyr1020) and surface ILT3 in BJAB-ILT3 cells stimulated as indicated for 15 minutes. (C) ILT3 immunoprecipitation (IP) from BJAB-ILT3-Streptag cells stimulated as indicated for 3 minutes. Left panel of immunoblots shows expression levels in the input lysates, and isolated protein complexes are shown on the right. (D) Representative immunofluorescence images and (E) colocalization analysis of phospho-SHIP-1 (Tyr1020) and surface BCR in BJAB-ILT3 cells stimulated as indicated for 15 minutes. Scale bars represent 5 μm. Shown are mean values ± SD. ***P < .001.
ILT3 inhibits Akt activation by recruiting active SHIP-1 to the BCR. (A) Representative immunofluorescence images and (B) colocalization analysis of phospho-SHIP-1 (Tyr1020) and surface ILT3 in BJAB-ILT3 cells stimulated as indicated for 15 minutes. (C) ILT3 immunoprecipitation (IP) from BJAB-ILT3-Streptag cells stimulated as indicated for 3 minutes. Left panel of immunoblots shows expression levels in the input lysates, and isolated protein complexes are shown on the right. (D) Representative immunofluorescence images and (E) colocalization analysis of phospho-SHIP-1 (Tyr1020) and surface BCR in BJAB-ILT3 cells stimulated as indicated for 15 minutes. Scale bars represent 5 μm. Shown are mean values ± SD. ***P < .001.
Discussion
Here, we identify a regulatory ILT3-DTX1-SHIP-1 axis that is implemented in CLL because of the intrinsic deficiency of the molecular adaptor p66Shc in neoplastic cells.12 At variance with its widespread expression in myeloid cells,23 ILT3 is not expressed in peripheral B cells, with the exception of plasmablasts representing <3% of the peripheral B-cell pool.43,44 However, ILT3 is ectopically expressed on circulating neoplastic B cells in CLL, as initially reported by Colovai et al.45 Here we independently reproduced and further extended their finding by identifying ILT3 also as the first marker for progenitor CLL cells (HSCs).
In myeloid cells, ILT3 functions as a negative regulator of immunity through 2 mechanisms.23,24 First, ILT3 plays a cell-intrinsic function by suppressing monocyte activation via SH2-containing protein tyrosine phosphatase 1.23 Moreover, when expressed on allogeneic antigen-presenting cells ILT3 has a cell-extrinsic function involving the ability to promote the differentiation of suppressor CD8+ T cells.24,30 In the context of CLL, we found that ILT3 has a cell-intrinsic inhibitory function in neoplastic cells involving the ability to recruit SHIP-1, bring it in the proximity of the activated BCR and inhibit BCR-dependent activation of Akt. Akt signaling provides a powerful mitogenic and prosurvival signal to B cells.46 Consistent with this function, an increased basal activation of the Akt pathway is a hallmark of CLL cells with high proliferative index both in patients and in Eµ-TCL1 mice, a murine model of CLL.37,38 Akt cooperates with Erk and JNK to promote CLL cell proliferation36 and drives the expression of antiapoptotic proteins, including Mcl-1.34,35,41 It has also recently emerged that CLL cells overexpress the autoimmunity-associated phosphatase PTPN22 that enhances Akt signaling upon BCR stimulation.47 Our identification of ILT3 as a CLL-specific receptor with an opposing function suggests that its expression may balance PTPN22 activity. ILT3-mediated negative regulation of Akt through SHIP-1, which has emerged as a key phosphatase repressing B-cell tumorigenesis,48 may compromise survival and proliferation of CLL cells.
The regulatory function of ILT3 is also interesting to consider in the context of its relationship with the inhibitory signaling adaptor and proapoptotic determinant p66Shc, which we elucidate in this work. CLL cells have an intrinsic deficiency in p66Shc, which results in enhanced BCR signaling and resistance to apoptosis.12 ILT3 upregulation has an opposing effect, thus potentially representing a regulatory feedback mechanism that would paradoxically neutralize or at least counteract the loss of p66Shc in CLL cells. A consideration raised by our results is that p66Shc deficiency is required but not sufficient to upregulate ILT3 expression. Moreover, the degree of p66Shc deficiency, which is more severe in leukemic cells from patients with unmutated IGHV12 and correlates positively or negatively with the levels of S1PR1, CCR7, or Bcl-2 family members Bcl-2 and Bak,18 does not affect the levels of ILT3 in these cells. ILT3 expression is indeed comparable between CLL cells with mutated and unmutated IGHV, similar to what previously shown for other 2 Bcl-2 family members, Bax and Bcl-xL, the expression of which is modulated by p66Shc deficiency but does not correlate with the mutational status of IGHV.12 Overall, this suggests that p66Shc may regulate expression of some genes following the “threshold” rule. In the case of ILT3, a decrease in p66Shc levels below certain levels could create a condition sufficient to allow for ILT3 upregulation by other factors. Namely, ectopic ILT3 upregulation requires the presence of DTX-1 acting in synergy with other CLL-specific factors, yet to be identified. Thus, ILT3 expression on CLL cells is the result of a multifactor regulatory network, the elucidation of which may potentially provide the basis for a therapy aiming to upregulate the inhibitory ILT3 on neoplastic B cells.
Although ILT3 expression is clearly a marker of CLL cells, its functional significance remains to be understood. We propose that the ILT3-DTX-1-SHIP-1 axis may be implicated in a regulatory network limiting the proliferative and survival ability of CLL cells. The existence of such network has been indirectly suggested by the high incidence of treatment-free stable disease among CLL patients.1 Another most probable candidate contributing to the inhibitory CLL network is anergy. Anergy renders B cells unresponsive to BCR ligation and is more frequently observed in CLL cells from patients with better prognosis, which are defined by mutated IGHV.7,8,49,50 We did not observe any dependence of ILT3 levels or signaling features on the mutational status of IGHV; thus at this stage we do not know whether ILT3 functioning and anergy induction are interconnected. However, it is noteworthy that SHIP-1 is one of the central molecules involved in the maintenance of B-cell anergy.40,51 Hence, both anergy and ILT3 functionally rely on SHIP-1 and may operate in parallel, reinforcing each other to control CLL progression.
Another important factor to consider in assessing the function of ILT3 in CLL is the identity and pattern of expression of its ligand(s), which is as yet elusive. The ability of ILT3 to suppress BCR signaling is likely to depend to a major extent on ligand availability, which may vary among patients with different prognosis. Interestingly, an unidentified ILT3 ligand is expressed by activated T cells,30 which in CLL contribute to the formation of tumor proliferation centers in peripheral lymphoid organs and bone marrow.52,53 Thus, it is plausible to propose that the ILT3 ligand(s) may be expressed by cells present in the CLL microenvironment. Its identification is expected to improve our understanding of the molecular players orchestrating the tumor-suppressing regulatory network in CLL.
The RNA-sequencing data have been deposited in the ArrayExpress database at the European Bioinformatics Institute (accession number E-MTAB-6082).
The online version of this article contains a data supplement.
The publication costs of this article were defrayed in part by page charge payment. Therefore, and solely to indicate this fact, this article is hereby marked “advertisement” in accordance with 18 USC section 1734.
Acknowledgments
The authors thank Stefania Gobessi and Dimitar G. Efremov (International Centre for Genetic Engineering and Biotechnology, Trieste, Italy) for reagent sharing and technical advice, and Simona Tavarini (GSK Vaccines, Siena, Italy) for cell sorting. The authors also thank Michiko Kitajima and Hideyuki Okano (Keio University School of Medicine) for reagent sharing, and Facundo Batista and Shweta Aggarwal (Ragon Institute of Massachusetts General Hospital, Massachusetts Institute of Technology, and Harvard University) for helpful discussion and technical advice.
This work was supported by an Associazione Italiana per la Ricerca sul Cancro (AIRC) TRIDEO (transforming ideas in oncological research) Award (grant 17015) (A.K.), an AIRC grant (IG 2014-15220) (C.T.B.), and an Istituto Toscano Tumori–Regione Toscana grant (C.T.B.). V.Z. holds an AIRC postdoctoral fellowship.
Authorship
Contribution: V.Z. performed research, analyzed the data, and wrote the manuscript; G.W., F.C., F.S., and D.R. performed research and analyzed data; V.C., E.C., A.G., and G.C. provided patient material; M.B. and C.T.B. supervised the study and provided critical suggestions; and A.K. designed the study, performed and supervised the research, analyzed data, and wrote the manuscript.
Conflict-of-interest disclosure: The authors declare no competing financial interests.
Correspondence: Anna Kabanova, Department of Life Sciences, University of Siena, via Aldo Moro 2, 53100 Siena, Italy; e-mail: anna.kabanova@unisi.it; and Cosima Tatiana Baldari, Department of Life Sciences, University of Siena, via Aldo Moro 2, 53100 Siena, Italy; e-mail: baldari@unisi.it.

