Key Points
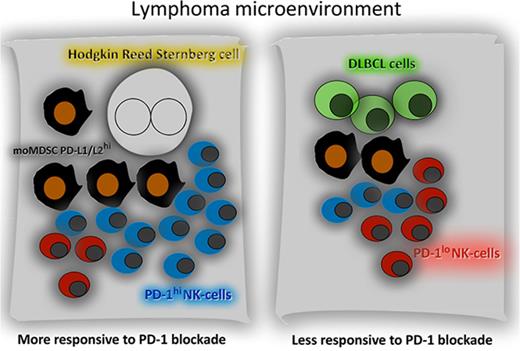
Expansion of PD-1+ CD3−CD56hiCD16-ve NK cells and PD-L1+ monocytes/macrophages is more prominent in cHL than DLBCL.
PD-1 blockade reverses the immune evasion mediated by the interaction of PD-1+ NK cells and PD-L1+ monocytes/macrophages.
Abstract
Much focus has been on the interaction of programmed cell death ligand 1 (PD-L1) on malignant B cells with programmed cell death 1 (PD-1) on effector T cells in inhibiting antilymphoma immunity. We sought to establish the contribution of natural killer (NK) cells and inhibitory CD163+ monocytes/macrophages in Hodgkin lymphoma (cHL) and diffuse large B-cell lymphoma (DLBCL). Levels of PD-1 on NK cells were elevated in cHL relative to DLBCL. Notably, CD3−CD56hiCD16-ve NK cells had substantially higher PD-1 expression relative to CD3−CD56dimCD16+ cells and were expanded in blood and tissue, more marked in patients with cHL than patients with DLBCL. There was also a raised population of PD-L1-expressing CD163+ monocytes that was more marked in patients with cHL compared with patients with DLBCL. The phenotype of NK cells and monocytes reverted back to normal once therapy (ABVD [doxorubicin 25 mg/m2, bleomycin 10 000 IU/m2, vinblastine 6 mg/m2, dacarbazine 375 mg/m2, all given days 1 and 15, repeated every 28 days] or R-CHOP [rituximab 375 mg/m2, cyclophosphamide 750 mg/m2 IV, doxorubicin 50 mg/m2 IV, vincristine 1.4 mg/m2 (2 mg maximum) IV, prednisone 100 mg/day by mouth days 1-5, pegfilgrastim 6 mg subcutaneously day 4, on a 14-day cycle]) had commenced. Tumor-associated macrophages (TAMs) expressed high levels of PD-L1/PD-L2 within diseased lymph nodes. Consistent with this, CD163/PD-L1/PD-L2 gene expression was also elevated in cHL relative to DLBCL tissues. An in vitro functional model of TAM-like monocytes suppressed activation of PD-1hi NK cells, which was reversed by PD-1 blockade. In line with these findings, depletion of circulating monocytes from the blood of pretherapy patients with cHL and patients with DLBCL enhanced CD3−CD56hiCD16-ve NK-cell activation. We describe a hitherto unrecognized immune evasion strategy mediated via skewing toward an exhausted PD-1-enriched CD3−CD56hiCD16-ve NK-cell phenotype. In addition to direct inhibition of NK cells by the malignant B cell, suppression of NK cells can occur indirectly by PD-L1/PD-L2-expressing TAMs. The mechanism is more prominent in cHL than DLBCL, which may contribute to the clinical sensitivity of cHL to PD-1 blockade.
Introduction
PD-L1/PD-L2 are immunomodulatory molecules that engage with the PD-1 receptor on immune effector cells to inhibit antitumoral immunity in a variety of cancers including B-cell lymphomas. Importantly, blockade of the axis is associated with particularly potent clinical responses in patients with classical Hodgkin lymphoma (cHL) who have relapsed or are refractory to chemotherapy, brentuximab-vedotin, and/or autologous stem cell transplantation.1-4 Although response rates to blockade of the PD-1/PD-L1 axis in relapsed/refractory diffuse large B-cell lymphoma (DLBCL) are not of the same magnitude, they are nonetheless very encouraging.5,6
PD-1 is a major inhibitory receptor on effector T cells, and T cells with high PD-1 expression have a reduced ability to eliminate tumor cells.7 Understandably, research has predominantly focused on the effect of PD-1 blockade on T cells.8,9 However, the frequent deficiencies in major histocompatibility complex class I/II-associated antigen presentation resulting from mutations in β2M and other antigen-presenting molecules on Hodgkin-Reed-Sternberg (HRS) and DLBCL cells suggests PD-1 blockade also works by additional mechanisms of action to that of cytotoxic T-cell-mediated killing in these lymphomas.10,11 Paradoxically, deficiency in major histocompatibility complex class I might not only make malignant B cells less sensitive to direct lysis by CD8+ T cells but also potentially enhance their sensitivity to human NK cells (CD3−CD56+ cells, a subtype of innate lymphoid class 1 immune effector cells that represent approximately 10% of peripheral blood lymphocytes).12
Research into NK cells in B-cell lymphomas has been relatively neglected, despite considerable evidence that they have a critical role in malignancy.13 Not only do NK cells exert direct cytotoxicity against tumor cells, but in NHL, this effect is indirectly enhanced through therapeutic monoclonal antibodies.14 Conventionally, circulating NK cells are phenotypically divided into 2 functional subsets on the basis of their surface expression of CD16 (FcγRIII) and CD56 (neural cell adhesion molecule 1) surface markers.15 CD3−CD56dimCD16+ (“CD16+”) typically form up to 95% of the total NK-cell population and are cytotoxic and mediate antibody dependant cellular cytotoxicity (ADCC). In contrast, the CD3−CD56hiCD16-ve (“CD16-ve”) subset produces abundant cytokines but is only weakly cytotoxic before activation.16 It is known that there is plasticity within circulating NK-cell subsets in response to cytokine signals; however, there is a paucity of data on NK-cell phenotype in B-cell lymphomas.
For HRS cells, augmented PD-1 signaling is partly attributable to the frequent presence of copy number alterations of 9p24.1, a region that includes CD274 (PD-L1) and PDCD1LG2 (PD-L2).10 In contrast, in DLBCL, gene amplification of 9p24.1 is infrequent. However, PD-L1/PD-L2 molecules are not restricted to malignant B cells and are also expressed by immunosuppressive tumor-associated macrophages (TAMs).17 Within both cHL and DLBCL biopsies, TAMs (also termed M2 macrophages) are frequent.10,18-21 It has been shown that circulating monocyte subsets such as monocytoid-myeloid-derived suppressor cells (moMDSC, defined as CD14+HLA-DRlo), CD14+CD163+ monocytes, and immunosuppressive TAMs have active roles in B-cell lymphoma control, acting to dampen host antilymphoma immune effector responses.22,23
Although there are increasing data to indicate a critical role for the tumor microenvironment (TME) in pathogenesis,24,25 the precise contribution of specific immune effector and immune suppressor components of the TME to lymphoma pathogenesis remains poorly understood. Notably, the cellular composition and spatial characteristics of the microenvironment demonstrate marked heterogeneity between lymphoma subtypes, as exemplified by cHL and DLBCL.25 In the former, malignant HRS cells make up only 2% of the diseased node, with the rest making up a mixed inflammatory/immune cell infiltrate, whereas with DLBCL, the diseased node contains large numbers of malignant B cells interspersed with relatively far fewer nonneoplastic cells. These differences likely influence the susceptibility of these different histological lymphoid subtypes to TME targeting agents. Thus, although increased PD-L1/PD-1 expression confers an adverse prognosis in cHL and DLBCL,26-28 it is likely that biological behavior and prognosis are determined not only by overall expression of PD-1 and PD-L1 but also by their expression within various cellular subsets.
Identification of cell-type-specific expression patterns of PD-1 and PD-L1 will help elucidate the clinical importance of individual immune pathways in different lymphoma subtypes. In turn, this will contribute to identifying patient groups that might benefit most from blocking PD-1/PD-L1 interactions. However, it remains unclear how these cellular immune pathways differ between lymphoma entities. Comparative information will assist the understanding of the differential effect of immunomodulatory agents between different B-cell lymphomas. Here, we seek to establish the contribution of the PD-1/PD-L1 axis between NK cells and inhibitory CD163+-expressing monocytes/macrophages in the setting of cHL and DLBCL.
Methods
Study populations
The cHL blood and tissue cohort comprised a population-based series of 66 adult patients with histologically confirmed cHL, prospectively collected from a tertiary referral center (Princess Alexandra Hospital, Brisbane), as previously reported (supplemental Table 1, available on the Blood Web site).29,30 Patients who were positive for HIV or who had active hepatitis B or C infection or had cHL secondary to immunosuppression were excluded. Blood was taken before the first (pretherapy) and immediately before the fourth (during) cycles of therapy. Therapy was ABVD (doxorubicin 25 mg/m2, bleomycin 10 000 IU/m2, vinblastine 6 mg/m2, dacarbazine 375 mg/m2, all given days 1 and 15, repeated every 28 days).
For DLBCL tissues, only de novo cases of a population-based series of 176 adult patients with DLBCL (supplemental Table 2), retrospectively obtained from 2 adult tertiary referral centers (Princess Alexandra Hospital, Brisbane, and Canberra Hospital, Canberra, Australia), were included. Grade IIIB or transformed follicular lymphoma, HIV-positive, and posttransplant patients were excluded, and cases were otherwise selected on the basis of availability of formalin-fixed, paraffin-embedded tissue. Sixteen fresh lymph nodes were available for testing by flow cytometry (6 DLBCL, 7 cHL, 3 healthy nodes). Blood collections for DLBCL were taken prospectively from patients enrolled into the ALLGNHL21 DLBCL trial (supplemental Table 3).26,31 Blood was taken pretherapy, and the during-therapy sample was taken after cycle 4 of therapy. All patients received 4 cycles of R-CHOP-14 (rituximab 375 mg/m2, cyclophosphamide 750 mg/m2 IV, doxorubicin 50 mg/m2 IV, vincristine 1.4 mg/m2 [2 mg maximum] IV, prednisone 100 mg/day by mouth days 1-5, pegfilgrastim 6 mg subcutaneously day 4, on a 14-day cycle) between blood samples.28 Although the ALLGNHL21 clinical trial cohort is slightly younger (57 vs 64 years), fitter (Eastern Cooperative Oncology Group <1 87% vs 73%), and has more aggressive features (International Prognostic Index 3-5 53% vs 43%) than the tissue cohort, they were broadly comparable.
Blood was also taken from healthy participant controls without malignancy, immunosuppression, or autoimmunity. All participants gave written informed consent. Peripheral blood mononuclear cells (PBMC) were cryopreserved, thawed, and tested in batches, as previously outlined.32 This study conformed to the Declaration of Helsinki, and written informed consent was provided by all blood donors in accordance with participating hospitals/research institute Human Research Ethics Committee guidelines.
Immune assays
The flow cytometry data were acquired using a BD Fortessa flow cytometer controlled by FACSDiva software (BD). Data analysis was performed on compensated data using FlowJo 10 software (Tree Star). Immune subsets were initially defined by forward and side-scatter characteristics and then staining with the appropriate marker. For example, moMDSC were CD14+ monocytes that were DRlo (ie, with DR expression lower than the median DR expression of B cells in the PBMC population).
Interferon-γ release, CD107a degranulation, and CD137 activation NK-cell assays were performed as previously described.26,33 These, and the methodology for primary NK-cell (pNK-cell) expansion, target cell killing, and PD-1 blockade are outlined in the supplemental Methods.34,35 PD-1 blockade used anti-PD-1 monoclonal antibody pembrolizumab (or an immunoglobulin G4 isotype control). Target cell lines used were the PD-L1-expressing lines HDLM2 (cHL), K562 (HLA-deficient erythroleukemia), and TK (DLBCL)17,36,37 and the PD-L1 nonexpressing line SU-DHL-4 (DLBCL), and for the effector cell line, we used the NK cell leukemia line KHYG-1.38
For the M6 TAM model, we adapted an in vitro model that has previously been shown to generate functionally immunosuppressive MDSC.39 CD14+ monocytes were isolated from PBMC of healthy participants by negative selection (NK-cell isolation kit, Miltenyi Biotec) and cultured in 24-well round-bottom plates at 1.0 × 10⁶ cells/mL in RPMI 1640 (Gibco Life Technologies) with 10% fetal bovine serum (Gibco Life Technologies) and 100 U/mL penicillin/streptomycin (Bristol-Myers Squibb) for 7 to 10 days at 37°C in a 5% CO2 incubator. On day 1 and then every 3 days, cultures were supplemented with macrophage colony-stimulating factor (M-CSF; 10 ng/mL; Miltenyi) and interleukin 6 (10 ng/mL; Miltenyi).
Multispectral quantitative fluorescent immunohistochemistry
Four-micrometer-thick sections were prepared and stained using the Opal (Perkin Elmer) Tyramine Signal Amplification System with selected primary antibodies. Slides were scanned using the Perkin Elmer Vectra multispectral fluorescence microscope, as previously described.40,41 Appropriate regions for analysis were chosen by a pathologist, and images analyzed using the inForm software. Antibodies used were the mouse anti-human CD163 monoclonal antibody (MRQ-26, Cell Marque), the mouse anti-human CD30 monoclonal antibody (Ber-H2, Cell Marque), the rabbit anti-human PD-L1 monoclonal antibody (Ventana, SP263, Roche), and the mouse anti-human CD20 monoclonal antibody (L26, Dako).
Multiplex gene expression quantification
Regions for RNA extraction were selected by a hematopathologist (S.B. and/or C.G.). Hybridizations were carried out according to the nanoString gene expression assay manual with a custom-designed reporter probe (marked with biotin at the 3′ end), as previously outlined.26,30,42 An automated platform processed samples and recorded expression levels. Raw data were imported and analyzed in the nanoString data analysis tool nSolver. For normalization, gene expression data were internally controlled to the mean of the positive control probes to account for interassay variability. Gene normalization was then performed using the geometric mean of housekeeper genes that had low variability across samples to account for factors that affect RNA quality and quantity. Housekeeping genes were selected as previously described and as per manufacturer recommendations.
Statistics
Wilcoxon signed rank tests were used to compare all paired data between different points. Otherwise, the nonpaired Mann-Whitney test and the Student t test were used for nonparametric or parametric data sets, respectively. Tests were 2-sided at P = .05, with a correction for multiple testing performed using the Bonferroni method. Statistical analysis was performed using Graphpad Prism (version 6; La Jolla, CA) and Statistical Package for the Social Sciences version 24 (International Business Machines Corporation).
Results
The proportion of CD3−CD56hiCD16-ve NK cells is expanded in patients with B-cell lymphomas
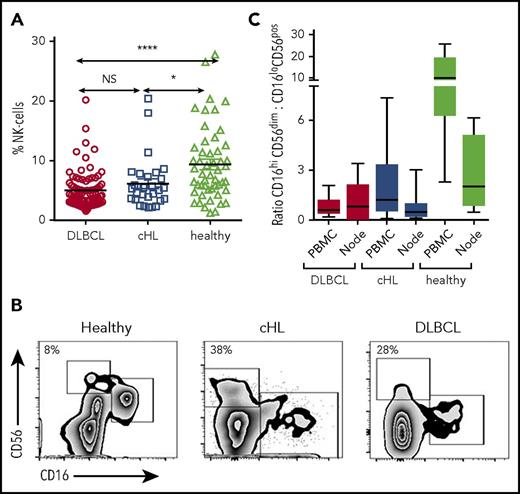
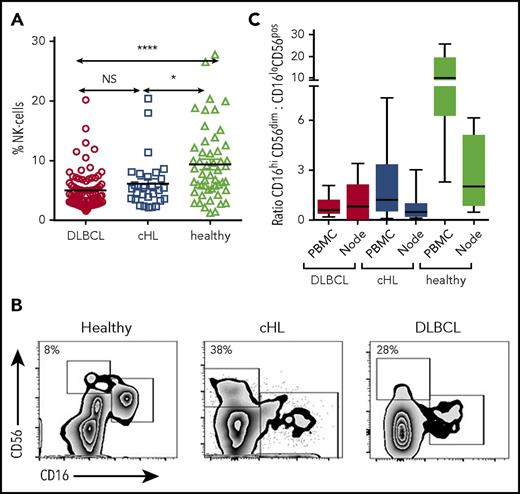
Flow cytometry was performed on pretherapy blood in patients with cHL and DLBCL, and in healthy participants. CD3−CD56+ NK cells were significantly reduced in the circulation in both patients with cHL and patients with DLBCL B-cell lymphoma relative to healthy participants and were equivalent between lymphoma subtypes. Proportions shown in Fig 1A: DLBCL, mean, 5% (standard deviation [SD], 3.13%); cHL, mean, 6.16% (SD, 4.34%); healthy participants, mean, 9.39% (SD, 6.16%; absolute values shown in supplemental Figure 1).
Circulating and intratumoral NK-cell subsets in patients with cHL and DLBCL and in the blood of healthy participants. (A) Pretherapy circulating CD3−CD56+ NK cells in patients with cHL and DLBCL and healthy participants. (B) Representative fluorescence-activated cell sorter plots of CD3−CD56dimCD16+ and CD3−CD56hiCD16-ve subsets of circulating NK cells in healthy participants and patients with cHL and DLBCL. Percentage of CD3−CD56hiCD16-ve as a proportion of CD3−CD56+ NK cells is shown. (C) Ratios of CD3−CD56dimCD16+ and CD3−CD56hiCD16-ve subsets in circulating and intratumoral NK cells in patients with cHL and DLBCL, and from the circulation and nodes in healthy participants. Asterisks denote significance: *P < .05; **P < .01; ***P < .001; ****P < .0001. NS, not significant.
Circulating and intratumoral NK-cell subsets in patients with cHL and DLBCL and in the blood of healthy participants. (A) Pretherapy circulating CD3−CD56+ NK cells in patients with cHL and DLBCL and healthy participants. (B) Representative fluorescence-activated cell sorter plots of CD3−CD56dimCD16+ and CD3−CD56hiCD16-ve subsets of circulating NK cells in healthy participants and patients with cHL and DLBCL. Percentage of CD3−CD56hiCD16-ve as a proportion of CD3−CD56+ NK cells is shown. (C) Ratios of CD3−CD56dimCD16+ and CD3−CD56hiCD16-ve subsets in circulating and intratumoral NK cells in patients with cHL and DLBCL, and from the circulation and nodes in healthy participants. Asterisks denote significance: *P < .05; **P < .01; ***P < .001; ****P < .0001. NS, not significant.
NK cells are conventionally subdivided into CD16+’ and CD16-ve subsets.43 In health, the proportion of CD56+ NK cells that are CD16-ve is typically less than 10%. However, the proportions appeared distorted in the patient samples, with the CD16-ve relatively expanded and the CD16+ relatively contracted (Figure 1B). To test this formally, we calculated the ratios of CD16+ to CD16-ve NK cells in both groups of patients with B-cell lymphoma. Both blood and diseased lymph nodes were tested. For blood, the ratios were markedly reduced in patients with both cHL and DLBCL relative to healthy participants (Figure 1C), whereas ratios between cHL and DLBCL were similar (P = NS). For lymphomatous nodes, the ratios were equivalent to healthy participants (but a limitation here is that the DLBCL tissue and blood samples were not paired patient samples), in line with the known finding that CD16-ve NK cells constitute the majority of NK cells in secondary lymphoid tissues.44,45 Gene transcripts were quantified by nanoString nCounter in 66 cHL, 176 DLBCL, and 16 healthy nodes. Appropriate tissue regions for RNA extraction were selected by a hematopathologist. Transcripts were quantified in all cells within these tissue regions, and not in isolated NK and T cells. This showed that levels of the NK cell marker CD56 were highest in healthy nodes (P < .001), and then higher in cHL nodes compared with DLBCL (P < .0001). In contrast, CD8 levels were higher in cHL than DLBCL, and even healthy nodes (both P < .01). Put together, these data show how immune effector-related gene expression is distinct between different histological entities.
PD-1+ CD3−CD56hiCD16-ve NK cells are elevated in patients with DLBCL, and particularly cHL
Phenotypic profiling was performed on circulating NK cells to establish whether the expanded CD16-ve subset observed in patient NK cells was different from this subset in healthy participants. A broad panel of surface markers that have been shown to have functional relevance to human NK cells was used.46,47 This included the chemokine receptors CCR5 and CCR7, the activating/inhibitory receptor complex CD94, the HLA-class II receptor HLA-DR, the activation marker CD69, the integrin α X protein CD11c, natural cytotoxicity receptors NKP30 and NKP46, and the cell adhesion/trafficking markers ICAM-1 and CD62L. Results showed that between healthy participants, patients with DLBCL, and patients with cHL, the phenotype of CD16-ve NK cells was similar for all markers (Bonferroni corrected P = NS) except for CCR7, which was reduced in patients compared with healthy participants (Bonferroni corrected P = .018 for cHL with a trend for DLBCL P = .058). CCR7 values were similar between the B-cell lymphoma subtypes (P = NS). The same analysis was also performed for the CD16+ NK-cell compartment. Again, phenotypic expression was similar for all markers with the exception of CCR7, which was reduced in patients with cHL relative to healthy participants (P < .001) and vs DLBCL (P = .01), but similar between healthy participants and DLBCL (P = NS).
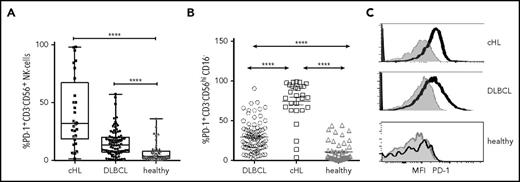
We then tested PD-1 on NK cells. Relative to healthy participants, PD-1hiCD3−CD56+ NK cells were elevated for both cHL and DLBCL (proportions shown in Figure 2A: percentage DLBCL median, range; cHL median, range; healthy median, range; and absolute values supplemental Figure 2A). This showed that circulating PD-1+ NK cells were elevated in both subtypes of B-cell lymphomas vs healthy participants, with median levels approximately 2-fold higher in cHL than DLBCL. We then tested for the proportion of cells that expressed PD-1 within NK-cell subsets and found that for each of the CD16-ve and CD16+ subsets, the proportion of PD-1+ NK cells was higher in patients with cHL and DLBCL compared with the same subsets in healthy participants (all P < .0001). Notably, the proportion of circulating PD-1hiCD3−CD56hiCD16-ve NK cells was more pronounced in cHL than DLBCL (Figure 2B; P < .0001). Findings for absolute values of patients with B-cell lymphomas compared with healthy participants were consistent with proportions (supplemental Figure 2B); however, the absolute numbers of PD-1hiCD3−CD56hiCD16− cells between DLBCL and cHL were statistically equivalent. The median fluorescent intensity (MFI) of PD-1 was then quantified within NK-cell subsets. This showed that for both lymphoma subtypes, CD16-ve NK cells had substantially higher PD-1 expression relative to CD16+ cells. For DLBCL, CD3−CD56hiCD16-ve compared with CD3−CD56dimCD16+ NK cells, PD-1 MFI was mean, 2744 (SD, 1880) vs mean, 827 (SD, 534), respectively (P < .0001); and for cHL, CD3−CD56hiCD16-ve compared with CD3−CD56dimCD16+ NK cells, PD-1 MFI was mean, 1330 (SD, 543) vs mean, 372 (SD, 270; P < .0001). As different fluorophores were used between peripheral blood DLBCL and cHL samples, no comparison of MFI between the B-cell lymphoma subtypes can be made. NK cells were also PD-1hi within cHL and DLBCL nodes (Figure 2C). Here, the same fluorophores were used, enabling comparison between lymphoma subtypes and healthy participants.
PD-1 expression on circulating and intratumoral NK cells. (A) Proportion of PD-1+ CD3−CD56+ NK cells in pretherapy blood in patients with cHL and DLBCL and in healthy participants. (B) Proportion of PD-1+ on NK-cell subsets in pretherapy blood in patients with cHL and DLBCL and in healthy participants. (C) Representative mean fluorescent intensity of PD-1 on intratumoral NK cells in patients with cHL and DLBCL (black line) and a healthy participant. Gray represents isotype control.
PD-1 expression on circulating and intratumoral NK cells. (A) Proportion of PD-1+ CD3−CD56+ NK cells in pretherapy blood in patients with cHL and DLBCL and in healthy participants. (B) Proportion of PD-1+ on NK-cell subsets in pretherapy blood in patients with cHL and DLBCL and in healthy participants. (C) Representative mean fluorescent intensity of PD-1 on intratumoral NK cells in patients with cHL and DLBCL (black line) and a healthy participant. Gray represents isotype control.
PD-L1 expression on monocyte/macrophages is higher in cHL than DLBCL
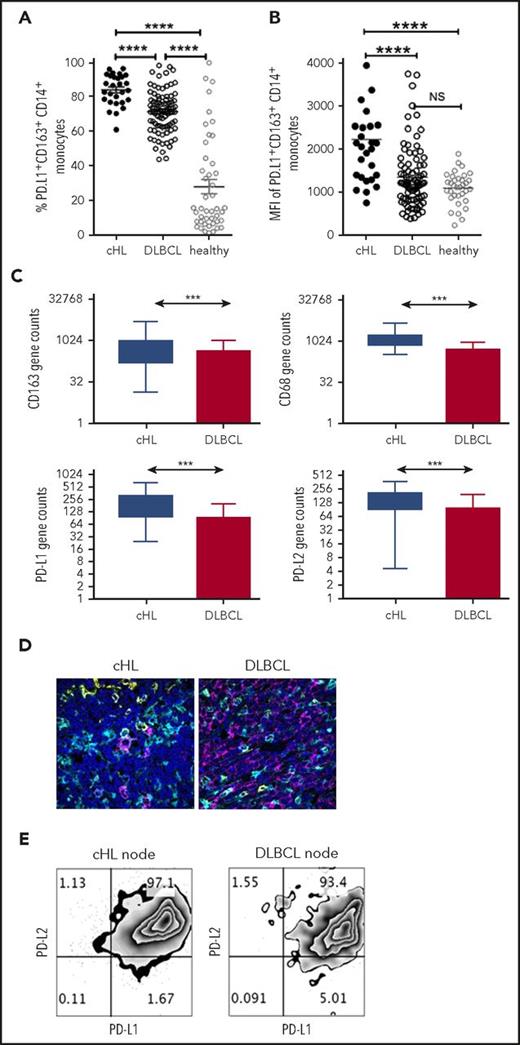
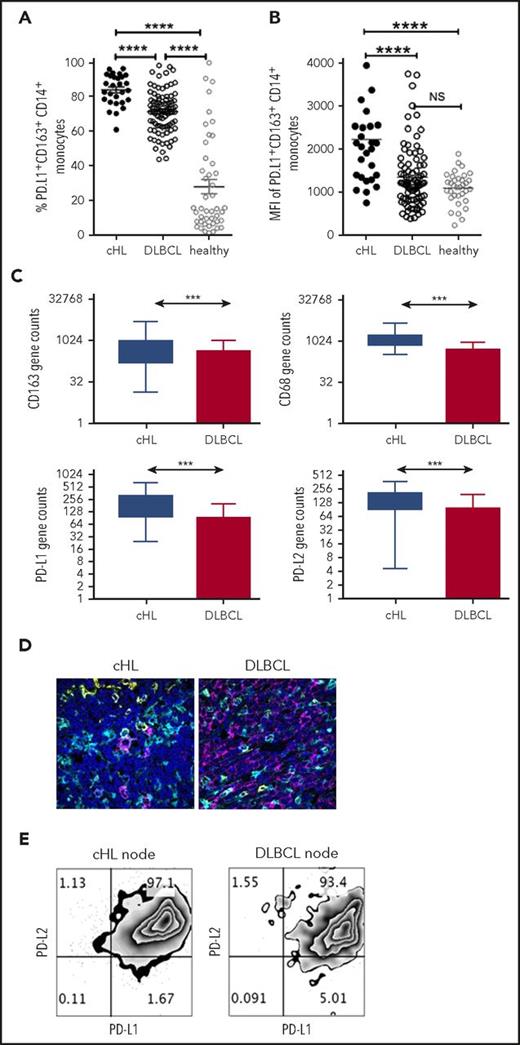
To compare PD-L1 expression on monocyte/macrophage subsets across lymphoma subtypes, we first quantified PD-L1+ monocyte subsets in the pretherapy blood of patients with cHL and patients with DLBCL. Notably, there was a marked increase in PD-L1+CD14+ monocytes, PD-L1+CD163+CD14+ (Figure 3A), and PD-L1+moMDSC monocytes in patients with cHL compared with patients with DLBCL (all P < .001). Absolute values are provided in supplemental Figure 3 and are consistent with proportional values. The same fluorophores were used in these experiments, enabling comparison between lymphoma subtypes. The MFI of PD-L1 on CD163+CD14+ monocytes was also higher in cHL relative to DLBCL (Figure 3B). PD-L1+CD163+CD14+ and MFI of PD-L1 in healthy participants were lower than cHL but equivalent to DLBCL.
PD-L1 expression on monocyte/macrophages in cHL and DLBCL. (A) Proportion of circulating PD-L1+CD163+CD14+ monocytes in the pretherapy blood of cHL and DLBCL patients and healthy participants. (B) Mean fluorescent intensity of PD-L1 on CD163+CD14+ monocytes in the pretherapy blood of cHL relative to DLBCL and healthy participants. (C) Gene expression by nanoString nCounter in cHL and DLBCL patient lymph nodes. (D) Representative images of multispectral microscopic visualization of PD-L1 (cyan), CD163 (yellow), CD20, or CD30 (magenta) from cHL and DLBCL diseased lymph nodes, with 4′,6-diamidino-2-phenylindole (dark blue) as the nuclear marker. (E) Representative fluorescence-activated cell sorter plots from cHL and DLBCL lymphomatous nodes of PD-L1/PD-L2 on CD163+CD14+ monocytes/macrophages.
PD-L1 expression on monocyte/macrophages in cHL and DLBCL. (A) Proportion of circulating PD-L1+CD163+CD14+ monocytes in the pretherapy blood of cHL and DLBCL patients and healthy participants. (B) Mean fluorescent intensity of PD-L1 on CD163+CD14+ monocytes in the pretherapy blood of cHL relative to DLBCL and healthy participants. (C) Gene expression by nanoString nCounter in cHL and DLBCL patient lymph nodes. (D) Representative images of multispectral microscopic visualization of PD-L1 (cyan), CD163 (yellow), CD20, or CD30 (magenta) from cHL and DLBCL diseased lymph nodes, with 4′,6-diamidino-2-phenylindole (dark blue) as the nuclear marker. (E) Representative fluorescence-activated cell sorter plots from cHL and DLBCL lymphomatous nodes of PD-L1/PD-L2 on CD163+CD14+ monocytes/macrophages.
In keeping with these findings, within the diseased tissues, levels of PD-L1, PD-L2, CD163, and CD68 gene expression were elevated in cHL relative to DLBCL (Figure 3C). The other genes known to be expressed on TAMs that were tested were CSF-1, CCL3, STAT3, and interleukin 10. PD-1 expression by TAMs is known to inhibit phagocytosis and tumor immunity, and was also quantified.48 All these genes were significantly higher in cHL vs DLBCL (all P < .0005). As gene expression does not permit visualization of molecules within cell types, we tested lymphoma nodes by multispectral immunofluorescent imaging. This found that for cHL, there was widespread staining of PD-L1 on non-HRS as well as CD30+ HRS cells (Figure 3D), including frequent expression of PD-L1 on CD163+ cells. For DLBCL, expression of PD-L1 on malignant cells was observed to a lesser extent than in cHL, whereas as with cHL, there was frequent expression of PD-L1 on nontumor cells including CD163+ cells. To determine whether PD-L1-expressing TAMs had dual expression with PD-L2, we tested for both ligands by flow cytometry on TAMs within fresh diseased lymph nodes. This showed that CD14+CD68hiCD163hi intratumoral monocyte/macrophages had pronounced dual-protein expression of PD-L1/PD-L2 in both cHL and DLBCL (Figure 3E).
The action of immunosuppressive monocytes on NK cells is overcome by PD-1 blockade
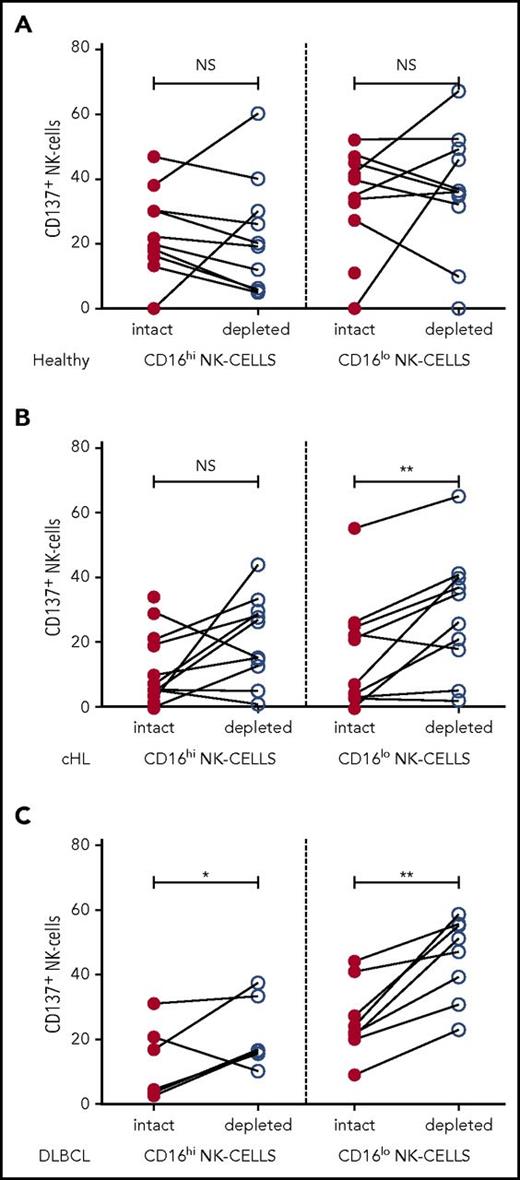
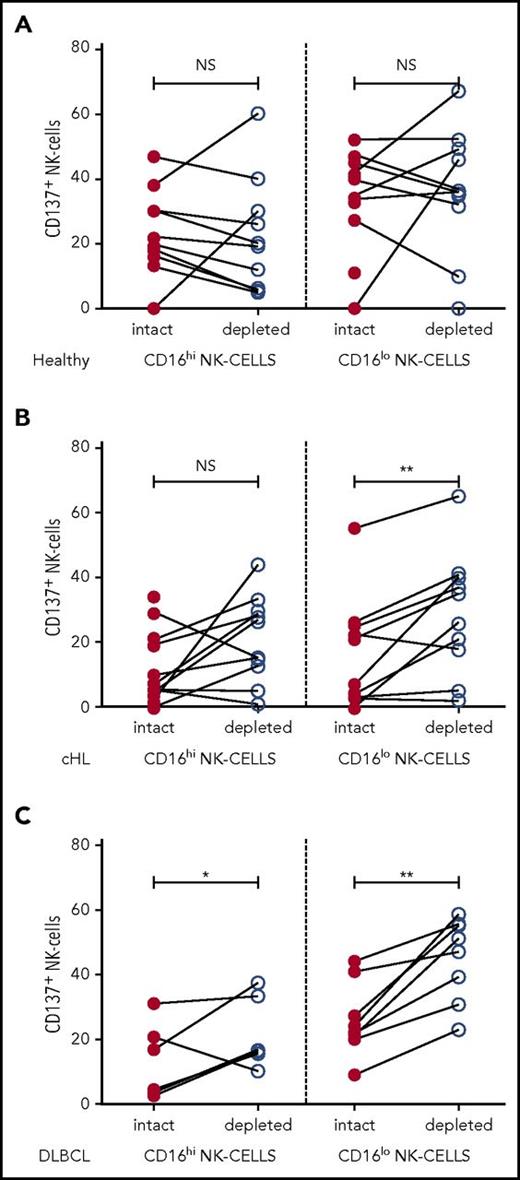
To investigate the interaction between NK cells and monocytes in patients, we assessed the effect of ex vivo monocyte depletion of PBMC from patients with cHL and patients with DLBCL and healthy participants on NK-cell activation in CD16+ and CD16-ve subsets. In these experiments, CD137 was used as a marker of NK-cell activation. Because CD137 can function as an inhibitory receptor (because of bidirectional signaling), depending on the ligand being targeted,49 we tested the effect of CD137 blockade on NK-cell killing of K562 cells (supplemental Figure 4). This showed that NK-cell killing was reduced by CD137 blockade, confirming that CD137 was a suitable marker of NK-cell activation. In the ex vivo assay, PBMC with monocytes intact or magnetic-activated cell sorting-column depleted were stimulated with K562 cells for 20 hours before assaying CD137 expression on NK-cell subsets. As immunosuppressive cells such as regulatory T cells are known to be elevated in patients with B-cell lymphomas,50 T cells were left intact so as not to confound the analysis. In healthy participants, monocyte depletion did not affect NK-cell activation, whereas monocyte depletion in patients with cHL and patients with DLBCL did enhance CD137 activation. When monocytes were depleted, NK-cell activation was unchanged in both NK-cell subsets in healthy participants (Figure 4A) and the CD16+ subset in pretherapy patients with cHL (Figure 4B), whereas monocyte depletion resulted in modestly increased activation in CD16+ NK cells for DLBCL, and marked activation in CD16-ve NK cells for both cHL and DLBCL (Figure 4C), indicating that patient circulating monocytes suppress their activation.
NK-cell activation is inhibited by immunosuppressive monocyte/macrophages in patient samples ex vivo. Patient PBMC, with or without monocyte depletion, was co-incubated with K562 and CD137 quantified on CD16+/− CD56+NK-cell subsets in (A) healthy participants. (B) patients with cHL, and (C) patients with DLBCL.
NK-cell activation is inhibited by immunosuppressive monocyte/macrophages in patient samples ex vivo. Patient PBMC, with or without monocyte depletion, was co-incubated with K562 and CD137 quantified on CD16+/− CD56+NK-cell subsets in (A) healthy participants. (B) patients with cHL, and (C) patients with DLBCL.
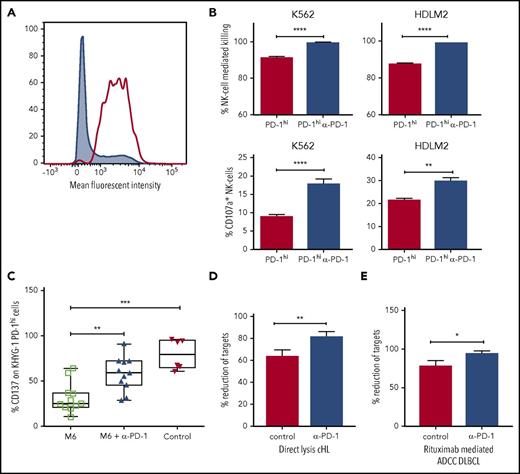
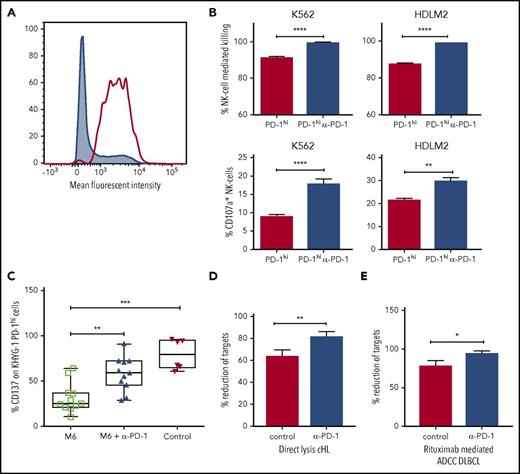
Next, we tested to see whether PD-1 blockade could increase direct lysis of PD-1 expressing target cells by NK cells in vitro. For this, we used the KHYG1 NK-cell leukemia cell line. Approximately 30% of KHYG1 cells express PD-1, and after fluorescence-activated cell sorter sorting (Figure 5A), KHYG1 PD-1hi cells continue to express PD-1 in prolonged culture. Compared with culture with isotype control antibodies, KHYG1 PD-1hi cultured with pembrolizumab produced enhanced degranulation of CD107a on activation with K562 and HDLM2 target cells (both of which are known to express PD-L1), accompanied by lysis of target cells (Figure 5B). These findings were not seen with KHYG1 PD-1lo cells. This indicates the interruption of the PD-1/PD-L1 axis is sufficient to induce PD-1hi NK cells to inhibit survival and proliferation in hematologic malignancies.
Immunosuppressive monocyte/macrophages inhibit NK-cell activation and killing via the PD-1/PD-L1 axis. (A) Fluorescence-activated cell sorter histogram showing unsorted (gray) and KHYG1 PD-1hi sorted (clear) NK cells. (B) Histograms show killing and CD107a degranulation of KHYG-1 PD-1hi/lo cells against K562 and HDLM2 targets with/without PD-1 blockade. (C) M-CSF and interleukin 6 M6 cultured PD-L1-enriched monocytes were co-incubated with KHYG1 PD-1hi cells with PD-1 blockade (middle) or isotype alone (left). CD137 was quantified on NK cells on exposure to the PD-L1 nonexpressing line SU-DHL-4 cell-line. In the control assay, KHYG1 PD-1hi cells were co-incubated with SU-DHL-4 targets alone (right). (D) Target cell lysis by primary NK cells from patients with cHL (n = 3) on exposure to the PD-L1 expressing cell-line HDLM2. (E) Rituximab-mediated ADCC target cell lysis by primary NK cells from patients with DLBCL (n = 3) against the PD-L1 expressing cell-line TK in the presence of pembrolizumab. In the control assays, target cells and primary NK cells were co-incubated with immunoglobulin G4 isotype control. ADCC, antibody dependent cellular cytotoxicity.
Immunosuppressive monocyte/macrophages inhibit NK-cell activation and killing via the PD-1/PD-L1 axis. (A) Fluorescence-activated cell sorter histogram showing unsorted (gray) and KHYG1 PD-1hi sorted (clear) NK cells. (B) Histograms show killing and CD107a degranulation of KHYG-1 PD-1hi/lo cells against K562 and HDLM2 targets with/without PD-1 blockade. (C) M-CSF and interleukin 6 M6 cultured PD-L1-enriched monocytes were co-incubated with KHYG1 PD-1hi cells with PD-1 blockade (middle) or isotype alone (left). CD137 was quantified on NK cells on exposure to the PD-L1 nonexpressing line SU-DHL-4 cell-line. In the control assay, KHYG1 PD-1hi cells were co-incubated with SU-DHL-4 targets alone (right). (D) Target cell lysis by primary NK cells from patients with cHL (n = 3) on exposure to the PD-L1 expressing cell-line HDLM2. (E) Rituximab-mediated ADCC target cell lysis by primary NK cells from patients with DLBCL (n = 3) against the PD-L1 expressing cell-line TK in the presence of pembrolizumab. In the control assays, target cells and primary NK cells were co-incubated with immunoglobulin G4 isotype control. ADCC, antibody dependent cellular cytotoxicity.
To establish whether immunosuppressive monocytes mediate suppression of NK cells via the PD-1/PD-L1 axis, an in vitro functional model of TAM-like monocytes was developed. Monocytes were cultured with the M6 TAM-inducing cytokine cocktail of M-CSF and interleukin 6. Consistent with an inhibitory phenotype, M6 cultured monocytes were highly enriched for CD163 (30-fold; P < .001) and PD-L1 (6-fold; P = .0024). M6 cultured monocytes were co-incubated with KHYG1-PDhi cells with or without PD-1 blockade, and NK-cell activation on exposure to the PD-L1 nonexpressing SU-DHL-4 target cell-line was tested. KHYG1-PD-1hi cells were activated on contact with SU-DHL-4. However, M6 cultured monocytes partially suppressed activation of KHYG1-PD-1hi cells. In contrast, in the presence of PD-1 blockade, suppression was reversed (Figure 5C). Then, using primary NK cells expanded from patients with cHL and patients with DLBCL in the presence or absence of PD-1 blockade, we were able to demonstrate that the PD-1/PD-L1 axis is involved in directly suppressing NK-cell killing of a cHL line (Figure 5D) and of rituximab-mediated ADCC of a DLBCL line (Figure 5E), as well as CD107a degranulation, interferon γ production, and CD137 activation (supplemental Figure 5).
The checkpoint expression on NK cells and monocytes is reset by therapy in cHL and DLBCL
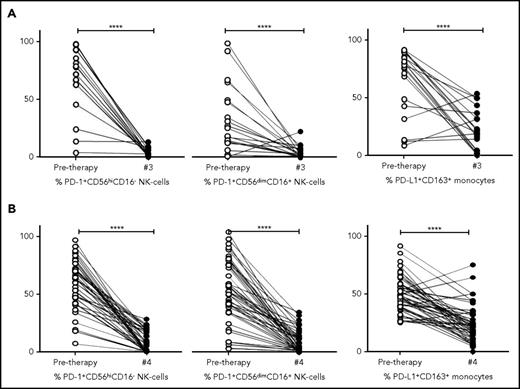
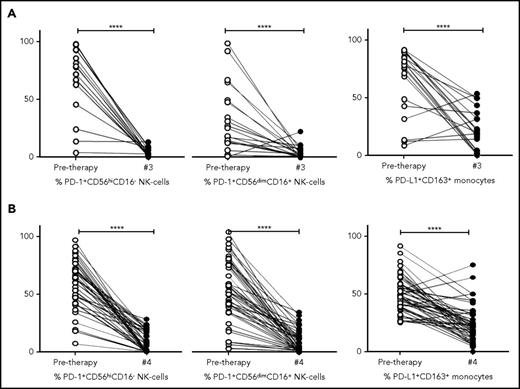
To determine the kinetics of relevant immune biomarkers during therapy, NK cells and monocyte levels measured in pretherapy and posttreatment samples (ie, postcycle 3 ABVD in cHL [Figure 6A] and postcycle 4 R-CHOP therapy in DLBCL [Figure 6B]) were compared. Absolute values are provided in supplemental Figure 5A-B and are in line with percentage changes.
Kinetics of NK cells and monocytes before and during therapy in cHL and DLBCL. (A) Proportion of NK-cell and monocyte subsets pretherapy and after 3 cycles of ABVD in patients with cHL. (B) Proportion of NK cell and monocyte subsets pretherapy and after 4 cycles of R-CHOP in patients with DLBCL. Percentages are of total numbers of CD56hiCD16− NK cells, CD56dimCD16+ NK cells, and CD163+ monocytes, respectively.
Kinetics of NK cells and monocytes before and during therapy in cHL and DLBCL. (A) Proportion of NK-cell and monocyte subsets pretherapy and after 3 cycles of ABVD in patients with cHL. (B) Proportion of NK cell and monocyte subsets pretherapy and after 4 cycles of R-CHOP in patients with DLBCL. Percentages are of total numbers of CD56hiCD16− NK cells, CD56dimCD16+ NK cells, and CD163+ monocytes, respectively.
Interestingly, for both cHL and DLBCL, the elevated expression of PD-1 on NK-cell subsets in pretherapy blood decreased during therapy to levels equivalent to that seen in healthy participants (all P = NS). The kinetics of monocyte subsets were then analyzed. In a paired analysis for both cHL and DLBCL, levels of PD-L1+CD14+ monocytes, PD-L1+moMDSC and PD-L1+CD163+CD14+ monocyte subsets, were reduced relative to pretherapy (all P < .0001). Values of PD-L1+CD14+ monocytes, PD-L1+moMDSC and PD-L1+CD163+CD14+ monocyte subsets observed during therapy, were equivalent to those seen in healthy participants (all P = NS).
Discussion
In this study, we describe an immune evasion strategy mediated by NK cells that are “skewed” toward an exhausted PD-1-enriched CD3−CD56hiCD16-ve NK-cell phenotype. NK-cells PD-1/PD-L1 axis interaction occurs via both the malignant B-cell and PD-L1-expressing M2 monocytes and TAMs. The mechanism is active in both cHL and DLBCL, but is more prominent in the former.
Although readily detectable, NK cells were reduced in the circulation in both patients with cHL and patients with DLBCL B-cell lymphoma relative to healthy participants, with levels equivalent between lymphoma subtypes. Although CD16-ve NK cells are typically less than 10% of all NK cells in the healthy circulation, we show their relative proportion is markedly expanded by ∼4 times in patients with cHL. We saw similar findings in DLBCL. This is of particular importance, as CD16-ve NK cells constitute the majority of NK cells in secondary lymphoid tissues44,45 (ie, the context in which lymphoma resides), and because CD16 is the receptor that binds the FC portion of therapeutic immunoglobulin G1 monoclonal antibodies such as rituximab to mediate ADCC. These findings were recapitulated in diseased lymph nodes.
To determine whether the altered ratio of CD16-ve to CD16+ NK cells corresponded to the development of a distinct new NK-cell phenotype, we performed a detailed phenotypic analysis. This revealed that both the CD16-ve and CD16+ NK-cell compartments are for the most part similar to these subsets in healthy participants, indicating that the conventional NK-cell phenotypes are skewed toward CD16-ve NK cells. Transition of CD16+ NK cells toward a CD16-ve phenotype has been previously described.51 Consistent with the notion of NK-cell plasticity is our observation that ratios of CD16-ve:CD16+ NK cells are reset after chemotherapy. However, the decrease in expression of CCR7 in pretherapy blood NK cells suggests than that in addition to a skewed ratio, the CD16-ve NK-cell compartment is enriched in certain unique features that would assist malignant B cells to evade NK-cell recognition. CCR7 is a secondary lymphoid compartment homing receptor that assists NK cells to egress from the blood to the lymphoid circulation by binding to CCL21 and CCL19, chemokines expressed, respectively, at the luminal side of high endothelial venules and in the T-cell-rich areas of secondary lymphoid organs.52 In keeping with this, the CD16-ve NK cells had markedly higher PD-1 expression in patients with B-cell lymphoma than healthy participants, and the proportion of circulating PD-1hiCD3−CD56hiCD16-ve NK cells was more pronounced in cHL than DLBCL. Put together, this appears to represent a novel strategy by which B-cell lymphoma evades NK-cell immune-surveillance that is more prominent in cHL than DLBCL. We speculate that 1 mechanism by which lymphoma induces changes in the circulating NK-cell population is via the upregulation of circulating moMDSC we observed. moMDSC upregulate indoleamine 2,3-dioxygenase, which is the rate-limiting enzyme of tryptophan catabolism. Tryptophan depletion might thus inhibit NK-cell proliferation.53 Another possibility is that these NK-cell abnormalities may also have been present before the onset of, and predisposed to the development of, B-cell lymphoma. The latter interpretation is consistent with the known predisposition to all cause malignancy that is observed in individuals with reduced capacity for direct NK-cell cytotoxicity.13
Aberrant PD-L1 expression by lymphoma cells is a key mediator of impaired antitumor immune responses in a range of B-cell lymphoproliferative disorders, and inhibiting their interaction with PD-1 on immune effector cells restores immune function.54,55 However, PD-L1 is also expressed on other cell types and in peripheral tissues and is upregulated during inflammation and in the tumor microenvironment.56,57 Indeed, across multiple solid cancer types, clinical responses are observed not only in patients with high tumor PD-L1 levels but also when PD-L1 was expressed by tumor-infiltrating immune cells.58 Within B-cell lymphomas, PD-L1/PD-L2 molecules are expressed by M2 TAMs.17 Furthermore, within the peripheral circulation, the moMDSC subset is associated with higher rates of disease progression in patients with B-cell lymphoma.22,59,60 We have previously shown that this subset is enriched in PD-L1 in DLBCL and in migration markers that enable them to traffic to lymph nodes, as well as CD163.61 When we compared PD-L1 expression on monocyte/macrophage subsets across lymphoma subtypes, there was a marked increase in PD-L1+moMDSC (and PD-L1+CD163+CD14+ monocytes) in cHL relative to patients with DLBCL. In line with this, within lymphoma nodes levels of PD-L1/PD-L2, CD163 and CD68 were also higher in cHL relative to DLBCL. The findings are also in keeping with the differences regarding PD-1 expression on NK cells being more marked in cHL. Consistent with these findings, other transcripts known to be enriched in TAMs (CSF-1, CCL3, STAT3, interleukin 10, and PD-1 [PD-1 expression by tumor-associated macrophages is known to inhibit phagocytosis and tumor immunity])48 were also highly significantly increased in cHL tissues relative to DLBCL. Then, in a series of experiments using patient samples ex vivo, an in vitro TAM-like model system to investigate the interaction between NK cells, and monocyte/macrophages, and using primary NK cells expanded from patients with cHL and patients with DLBCL, we were able to demonstrate that the PD-1/PD-L1 axis is involved in directly suppressing NK-cell activation and cytolysis, including rituximab-mediated ADCC. Critically, PD-1 blockade resulted in reversal of monocyte/macrophage-mediated immunosuppression of NK cells. Put together, the data show that in addition to expression of PD-1 down-regulating the immune effector response by interacting with PD-L1 on B-cell lymphoma cells (enhanced by gene amplification at 9p24.1), inhibition of NK cells also occurs by PD-L1/PD-L2 expressing TAMs. As has previously been observed with multiple myeloma, we showed that NK-cell cytotoxicity was augmented by checkpoint blockade.36
The study used blood and tissue samples from patients with cHL and patients with DLBCL and compared results with those of healthy controls. Primary NK cells, NK-cell lines, and an in vitro model of M2 TAMs were used. As a result, the study has a number of limitations. These lymphomas are distinct clinicopathological entities, and the in vitro model used may not be representative of the differences in vulnerability to PD-1 blockade mediated by NK cells and immunosuppressive monocyte/macrophages in vivo. The study would benefit from access to serial patient samples treated with PD-1 blockade. This would be particularly valuable in establishing whether this mechanism contributes to the relative resistance of PD-1 blockade in DLBCL relative to cHL.
In summary, we describe a hitherto unrecognized immune evasion strategy mediated via distortion in the proportion of NK cells with a PD-1hiCD3−CD56hiCD16-ve phenotype. It remains to be determined whether this phenotype predated the B-cell lymphoma and was involved in its pathogenesis. In addition to the inhibition of NK cells by the malignant B cells, suppression of NK cells occurs by PD-L1/PD-L2 expressing CD163+ monocyte/macrophages. Emphasizing the value in comparing TME between lymphoma entities, this mechanism is more prominent in cHL than DLBCL, which (along with copy number alterations of 9p24.1 on HRS cells) may contribute to the enhanced clinical sensitivity of cHL to PD-1 blockade. Further studies are required to delineate the molecular mechanisms that underpin the differences within the TME between B-cell lymphomas.
Presented in abstract form at the 58th annual meeting of the American Society of Hematology, San Diego, California, December 3-6, 2016, in the Lymphoma Biology NonGenetic Studies session.
The online version of this article contains a data supplement.
The publication costs of this article were defrayed in part by page charge payment. Therefore, and solely to indicate this fact, this article is hereby marked “advertisement” in accordance with 18 USC section 1734.
Acknowledgments
M.K.G. is supported by the Leukaemia Foundation, and C.K. by a Leukaemia Foundation Bridgestone Award, a National Health and Medical Research Council Early Career Fellowship, and a Princess Alexandra Hospital Award. DLBCL blood samples used were from the Australasian Leukaemia Lymphoma Group NHL21 study, and their collection was supported by a grant from the Cancer Council Queensland. This study was supported by the Kasey-Anne Lymphoma Giving Fund, a giving account of the Lord Mayor’s Charitable Foundation, and the Pathology Queensland Study, Education and Research Committee.
Authorship
Contribution: F.V. designed and performed assays and data analysis and cowrote the manuscript; D.A., C.K., Q.C., E.H., J.T., C.G., and S.B. performed assays; M.S.H., D.T., S.J., R.B., D.C., and A.H. contributed samples; and M.K.G. conceived and oversaw the project, performed data analysis, and cowrote the manuscript. All authors approved the final version.
Conflict-of-interest disclosure: The authors declare no competing financial interests.
Correspondence: Maher K. Gandhi, Level 5 East, University of Queensland Diamantina Institute, Translational Research Institute, Brisbane, 4102, QLD, Australia; e-mail: m.gandhi@uq.edu.au.

