Key Points
Gene regulatory features in MM patients reveal a key regulatory network and epigenetic changes that underpin the disease.
Abstract
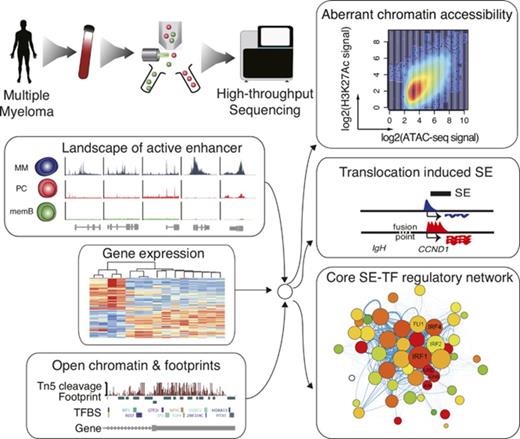
Multiple myeloma (MM) is an aggressive cancer that originates from antibody-secreting plasma cells. Although genetically and transcriptionally well characterized, the aberrant gene regulatory networks that underpin this disease remain poorly understood. Here, we mapped regulatory elements, open chromatin, and transcription factor (TF) footprints in primary MM cells. In comparison with normal antibody-secreting cells, MM cells displayed consistent changes in enhancer activity that are connected to superenhancer (SE)-mediated deregulation of TF genes. MM cells also displayed widespread decompaction of heterochromatin that was associated with activation of regulatory elements and in a major subset of patients’ deregulation of the cyclic adenosine monophosphate pathway. Finally, building SE-associated TF-based regulatory networks allowed identification of several novel TFs that are central to MM biology. Taken together, these findings significantly add to our understanding of the aberrant gene regulatory network that underpins MM.
Introduction
Multiple myeloma (MM) is an aggressive neoplastic plasma cell (PC) disorder. With an incidence of ∼6 in 100 000 per year, it results in 13 000 deaths annually in the United States alone.1,2 Through the tremendous effort of the Multiple Myeloma Research Foundation Consortium and other MM investigators worldwide, the genetic alterations and the aberrant gene expression programs that are associated with the disease are well characterized in a large cohort of MM patients.3-5 MM can broadly be divided into tumors with immunoglobulin heavy chain (IGH) gene translocations involving CCND1-3, FGFR3/MMSET, and MAFs and tumors with hyperdiploid genomes containing several trisomies.6,7 In addition to these changes, recurrent aberrations including frequent genomic rearrangements that cause increased MYC expression have been identified and linked to disease development, progression, and patient outcome.6,7 Likewise, the aberrant gene expression patterns observed in MM have allowed for pinpointing pathways that are critical for disease progression and growth, and for patient survival.4,8,9 Together with studies of the underlying genetics, gene expression studies have allowed for detailed classification of MM into 7 subgroups with distinct molecular pathogeneses.4,8,9
The transcriptional activity of genes is regulated through the interplay between promoters, enhancers, and other cis-acting regulatory elements bound by transcription factors (TFs).10,11 Primary tumor cells, in comparison with their healthy cell-of-origin counterparts, have been shown to display altered enhancer repertoires that are associated with tumor-specific transcription.12-14 Several TF, including MAF, MYC, IRF4, PRDM1/BLIMP1, and XBP1, have been shown to play important roles in MM.5,7,15-18 However, their roles in establishing the MM transcriptional program remain poorly understood.
Subsets of enhancers cluster together to form superenhancers (SEs).19 These elements have been shown to control genes important for maintaining cellular identity but are also frequently associated with oncogenes and translocations that result in aberrant gene expression in cancer.19-21 Hence, SEs are of significant interest as disease drivers. Indeed, drugs that target SE activity in the MM.1S MM cell line and other cancer cells have been shown to induce cancer cell death.20,22
Although genetically and transcriptionally well characterized, underlying gene regulatory mechanisms that establish the aberrant MM gene expression programs remain poorly understood. To characterize the MM regulome and gain deeper insight into the regulation of the MM gene regulatory network, we performed genomewide analysis of gene expression, open chromatin, and enhancer usage in primary MM cells.
Materials and methods
Collection of patient samples and FACS sorting of MM cells
Bone marrow (BM) samples from treatment-naive MM patients were obtained from the Karolinska University Hospital (Sweden; EPN 2014/526-31/3), Baylor Scott and White Health (Dallas and Temple, Texas; institutional review board number 013-199), and MD Anderson Cancer Center (Houston, Texas; PA14-0847). Institutional/national human ethics review committees approved the studies. BM mononuclear cells were isolated using Ficoll-Paque. To eliminate contaminating cells, MM cells were fluorescence-activated cell sorted (FACS) using an FACSAria II/FUSION as live (PI− or 7AAD−) CD2/CD3/CD4/CD8/CD11b/CD14/CD16−CD138+CD38+. For cryopreserved samples, CD319 was used to compensate for the loss of CD138.23 CD19, CD45, and CD56 were used to separate MM cells in selected samples. MM cells were frequently enriched using anti-CD138 beads (Miltenyi Biotec and Stemcell Technologies) prior to FACS sorting. Supplemental Figure 1A-B and supplemental Table 1, available on the Blood Web site, provide a schematic overview of purification strategies and lists of antibodies used.
Isolation of memory B cells, plasmablasts, and PCs
Human spleens were obtained from discarded tissues from surgeries at Baylor Scott & White Health (Dallas, TX; institutional review board number 012-174). Spleen mononuclear cells were isolated using Ficoll-Paque. Memory B cells (memB) (7AAD−CD19+IgD−CD27+) were FACS sorted from spleen B cells enriched using EasySep Human B-Cell Enrichment Kit (Stemcell Technologies). For differentiation, memB cells were cultured in RPMI 1640 with 10% fetal calf serum and stimulated with 1 μg/mL activating anti-CD40 antibody and 50 ng/mL recombinant IL-21 for 6 days. At day 6, plasmablasts (PB) (7AAD−CD38+CD138−) and PCs (7AAD−CD38+CD138+) were FACS sorted. Supplemental Figure 1A-B and supplemental Table 1 provide a schematic overview of purification strategies and lists of antibodies used.
RNA-seq of primary cells
Cells were FACS sorted into buffer RLT with β-mercaptoethanol and RNA purified using the AllPrep DNA/RNA Micro Kit (Qiagen). Libraries were prepared from 100 to 1000 ng of RNA using the SMARTer Stranded Total RNA Sample Prep Kit (Clontech). Libraries were paired-end sequenced (75 cycles) using the Illumina HiSeq2500/4000 platform.
ChIP-seq and ATAC-seq of primary cells
Chromatin immunoprecipitation sequencing (ChIP-seq) was performed on 0.2 to 0.5 × 10⁶ FACS-sorted cells using polyclonal anti-H3K27Ac (Diagenode, catalog no. C15410196, lot no. A1723-0041D) and the Rubicon ThruPLEX DNA-sequation 12S library preparation kit (Rubicon Genomics). Libraries were single-end sequenced (50 cycles) using the Illumina HiSeq2000 platform. Assay for transposase-accessible chromatin using sequencing (ATAC-seq) was performed on 50 000 to 75 000 FACS-sorted cells. Nuclei were immediately prepared and subjected to Tn5 transposition, and libraries were polymerase chain reaction amplified and pair-end sequenced (50-75 cycles) using the Illumina HiSeq2500/4000 platform (supplemental Materials and methods).
ChIP and RNA sequencing of myeloma cell lines
Myeloma cell lines, purchased from ATCC or DSMZ, were subjected to RNA-seq and ChIP-seq as described in the supplemental Materials and methods.
shRNA knockdown and cell viability assay
Short hairpin RNA (shRNA) knockdown was performed by spin infection. Twenty-four hours after infection, cells were selected by puromycin (1 μM) for 3 days. Knockdown efficiency was evaluated by quantitative polymerase chain reaction and western blot. Postselection, live cells were counted using a hemocytometer. The supplemental Materials and methods provides shRNA vector production and the primers and antibodies used.
Bioinformatics
Reads were mapped to the human reference genome (hg19) using TopHat (2.0.14), Bowtie2, and Bowtie (0.12.7) for RNA-seq, ChIP-seq, and ATAC-seq reads, respectively.
Arraystudio (Omicsoft) was used to calculate fragments per kilobase of transcript per million mapped reads (FPKM) values, identify differentially expressed genes, and perform principal component analysis (PCA) from RNA-seq data. Peaks and differential signals in ChIP-seq and ATAC-seq data were determined using MACS (1.4.2) and HOMER.24 De novo motif enrichment analysis was performed using HOMER. The assignment of DEs to target genes was done as previously described.12 SE calling was performed using ranking of superenhancer (ROSE).20,21 HotSpot was used to define accessible chromatin regions in ATAC-seq data. GM12878 ChromHMM annotations were obtained from UCSC genome browser. GREAT25 was used to assign biological function to distal regions.
The network motif analysis followed the procedure previously described.26 TF footprints were called from ATAC-seq data using DNase2TF.27 To generate SE-TF regulatory networks, ChIP-seq, RNA-seq, and ATAC-seq data from 8 MM samples were integrated. Individual TF regulatory networks were constructed using previously described principles28 with the incorporation of gene expression data and TF footprints at SEs. The network was displayed using Cytoscape (supplemental Materials and methods). Data Accession Number from ENA (European Nucleotide Archive) database: PRJEB25605.
Results
Isolation of normal B-lineage and MM cells
To globally profile transcriptional and gene regulatory landscapes, MM cells were FACS sorted from patient BM. This allowed us to consistently perform experiments on pure and viable MM cells even from cryopreserved samples (supplemental Figure 1A-B). MM immunophenotypes and clinical data are listed in supplemental Table 2. To obtain normal control cells, memB were purified and further in vitro differentiated29 into PBs and PCs (PBs/PCs for simplicity in remaining text; supplemental Figure 1A-B). Secretion of immunoglobulin G/A from PBs/PCs was verified by enzyme-linked immunosorbent assay (data not shown), and RNA-seq and ChIP-seq from PCs/PBs showed high correlation to data from ex vivo PCs (supplemental Figure 1C-D), validating that PCs/PBs well represent the cell type.
The MM gene expression program
To investigate transcriptional changes, MM and normal cells were subjected to RNA-seq. As expected, comparing memB with PBs/PCs and MM with PBs/PCs revealed expected cell type–specific gene expression changes and gene set enrichment (supplemental Figure 2A-B). PCA revealed distinct clustering of memB, PBs, PCs, and MM and showed that MM more closely resembles PBs/PCs cells at the transcriptional level (supplemental Figure S2C).
The MM active enhancer landscapes
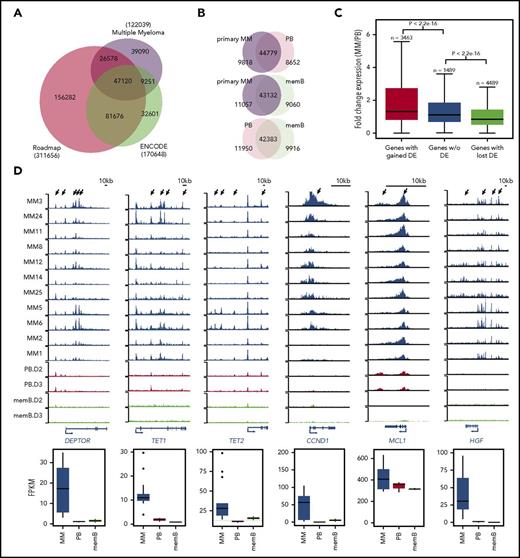
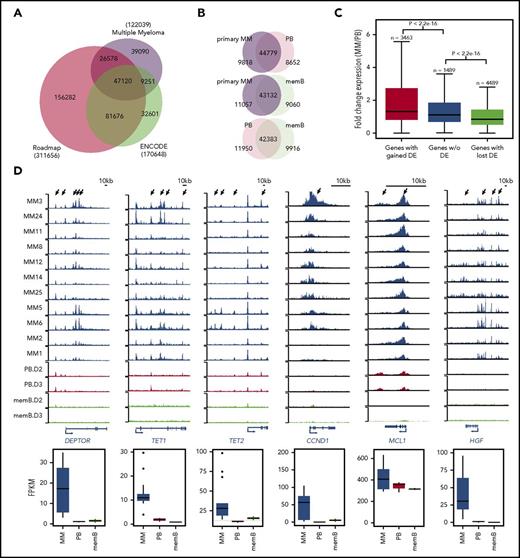
To characterize active enhancers, cells were subjected to H3K27Ac ChIP-seq.10 Approximately 120 000 active enhancers were identified in primary MM and in MM cell lines (Figure 1A). Approximately 30% (39 090/122 039) of active enhancers had not been previously identified in the ENCODE and Roadmap Epigenome projects10,11 (Figure 1A). Furthermore, 36% (23 341/65 400) of active enhancers were exclusive to primary MM and not identified in MM cell lines (supplemental Figure 3A). Saturation analysis (supplemental Figure 3B) suggests that the number of samples (although not reaching a strict plateau) gives a good representation of the active enhancer landscape in primary MM.
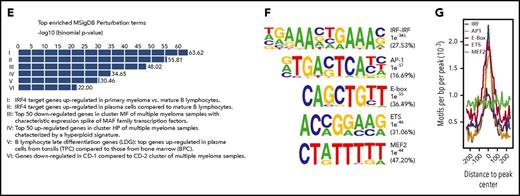
MM cells display widespread alterations in enhancer activity. (A) Overlap between active H3K27Ac-marked enhancers in MM (11 primary MM and 10 MM cell lines) and the ENCODE and Roadmap Epigenome enhancer catalogs. Total number of H3K27Ac-marked regions is indicated in parentheses for each group. (B) Number of elements showing similar or differential (twofold) H3K27Ac signals when comparing primary MM (n = 11), PB (n = 3), and memB (n = 3). (C) Box and whisker plots of the fold change in RNA expression (comparing MM and PBs) for genes with or without DEs with gained or lost H3K27Ac signal. (D) MM-related genes displaying increased expression and H3K27Ac signals in primary MM (black tracks) compared with PBs (red tracks) and memB (green tracks). Arrows indicate enhancers. Expression (average FPKM ± standard deviation) of the gene in each loci is shown below the tracks. (E) GREAT analysis of enhancers with gained activity in MM compared with PBs. Top 6 significant Molecular Signatures Database (MSigDB) Perturbation terms are shown. X-axis displays enrichment P values (−log10). (F) De novo identification of TF motifs enriched in enhancers with gained H3K27Ac signal in MM compared with PBs (gained DEs). The best TF motif matches, P values for motif enrichment, and percentage of regions containing motif are indicated to the right of the sequence logos. (G) Distribution of enriched motifs in the gained DEs. BPC, bone marrow plasma cell; HP, hyperploid; MF, MAF/MAFB; TPC, tonsil plasma cell.
MM cells display widespread alterations in enhancer activity. (A) Overlap between active H3K27Ac-marked enhancers in MM (11 primary MM and 10 MM cell lines) and the ENCODE and Roadmap Epigenome enhancer catalogs. Total number of H3K27Ac-marked regions is indicated in parentheses for each group. (B) Number of elements showing similar or differential (twofold) H3K27Ac signals when comparing primary MM (n = 11), PB (n = 3), and memB (n = 3). (C) Box and whisker plots of the fold change in RNA expression (comparing MM and PBs) for genes with or without DEs with gained or lost H3K27Ac signal. (D) MM-related genes displaying increased expression and H3K27Ac signals in primary MM (black tracks) compared with PBs (red tracks) and memB (green tracks). Arrows indicate enhancers. Expression (average FPKM ± standard deviation) of the gene in each loci is shown below the tracks. (E) GREAT analysis of enhancers with gained activity in MM compared with PBs. Top 6 significant Molecular Signatures Database (MSigDB) Perturbation terms are shown. X-axis displays enrichment P values (−log10). (F) De novo identification of TF motifs enriched in enhancers with gained H3K27Ac signal in MM compared with PBs (gained DEs). The best TF motif matches, P values for motif enrichment, and percentage of regions containing motif are indicated to the right of the sequence logos. (G) Distribution of enriched motifs in the gained DEs. BPC, bone marrow plasma cell; HP, hyperploid; MF, MAF/MAFB; TPC, tonsil plasma cell.
Directly comparing MM with memB or PBs identified ∼20 000 enhancers with altered activity (Figure 1B; supplemental Figure 3C). With regulatory elements reflecting cellular identity,10,11 memB, PBs, and MM cells formed expected discrete clusters by PCA (supplemental Figure 3D). Interestingly, the second component (PC2) suggests that MM cells have a repertoire of active elements that contain significant memB characteristics. In line with this, looking specifically at enhancers regulated in the memB-to-PB transition, MM fails to properly alter activity of developmentally regulated elements (supplemental Figure 3E). Together, this demonstrates that MM is associated with widespread changes in enhancer activity.
Active enhancers regulate the expression of genes associated with MM biology
To investigate if the altered activity of enhancers in MM (differential enhancers, DEs) is associated with transcriptional changes, we compared the expression of genes associated with enhancers with gained or lost DEs comparing MM with PBs (Figure 1C). This revealed that genes with the gained or lost DEs displayed altered expression compared with genes without DEs (Figure 1C). Hence, altered enhancer activity is associated with changes in gene expression in MM cells.
Many loci previously linked to MM biology display increased gene expression and enhancer activity (Figure 1D; supplemental Figure 3F). This includes genes involved in signaling (DEPTOR30 ); cell-cycle progression (CCND131 ); survival (MCL132 and HGF33 ); interaction with the BM microenvironment (ITGA4,34 CD200,35 CXCR4,36 KIT,37 CDH2,38 and IL6ST39 ); and DNA demethylation (TET1/2). Interestingly, previous studies have shown hypermethylation of the TET1 and TET2 genes in MM samples.40 However, we observed clear overexpression accompanied by distinct establishment of novel active enhancers for these genes (Figure 1D).
To globally assess the function of gained DEs (comparing MM with PBs), we used GREAT25 to assign biological function to enhancers. The top 6 most significant gene sets were all either directly connected to MM biology or regulation by the MM-associated TF IRF4 (Figure 1E). Thus, gained DEs are associated with genes previously shown to be deregulated in MM.
Taken together, these data strongly suggest that establishment of the MM-specific enhancer landscape is directly reflected in the aberrant expression of genes important for regulation of proliferation, survival, DNA methylation, signaling, and adhesion in MM cells.
Core TF families at the DEs in myeloma
To identify the TFs or TF families that are responsible for the establishment and/or increased activity of enhancers in MM, we performed de novo motif enrichment analysis in gained DEs. IRF-IRF, AP-1, E-box, ETS, and MEF2 motifs were significantly enriched (Figure 1F) and preferentially located centrally (Figure 1G), indicating that these factors increased the activity of these elements in MM.
Recurring SEs regulate TF genes key in MM biology
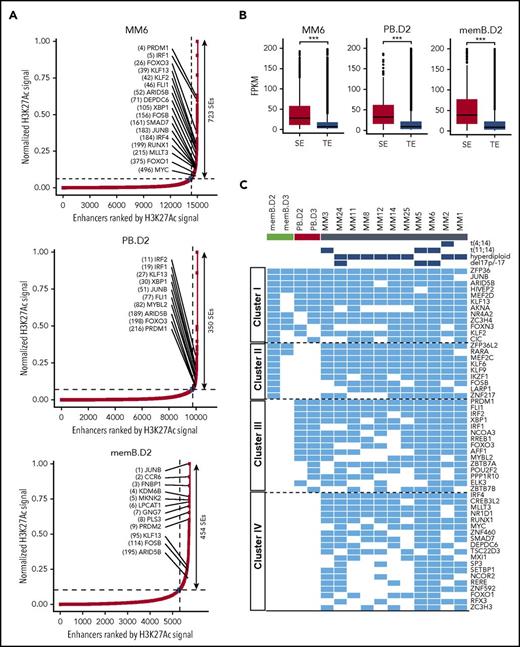
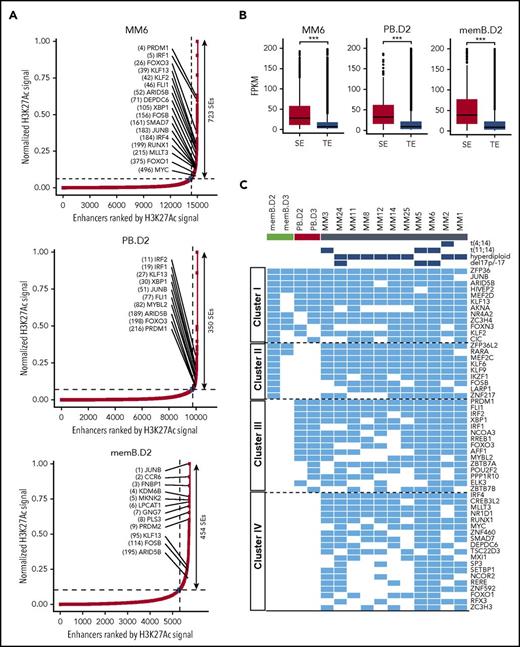
MM-associated SEs have previously been identified in the MM.1S myeloma cell line20 but remain unexplored in primary MM. We used ROSE21 to identify SEs in individual MM and control samples based on H3K27Ac signals (Figure 2A). SEs identified in MM were associated with genes previously linked to MM and IRF4 (supplemental Figure 4A). SEs displaying altered activity in MM (as compared with memB and/or PBs) were associated with genes linked to immune regulation (supplemental Figure 4B-C). As expected, SE-associated genes had significantly higher expression levels than those associated with typical enhancers (TEs) (Figure 2B). SEs are known to be associated with TF genes. We found 55 SEs recurrently (in ≥6 samples) associated with TF genes in our primary MM samples (Figure 2C; supplemental Figure 4D-E). Clustering revealed 4 different groups of TFs (clusters I-IV) (Figure 2C). A similar pattern was observed in MM cell lines (supplemental Figure 4F), but it is noteworthy that only 5 TFs in cluster IV from primary MM cells were SE associated in MM cell lines (comparing Figure 2C with supplemental Figure 4F).
Recurring SEs are associated with TF genes in MM cells and normal controls. (A) SEs identified by ROSE in MM, memB, and PB cells. Selected TFs included in panel C are indicated. (B) SE-associated genes are expressed higher than genes associated with TEs. Box and whiskers plots display FPKM for SE- or TE-associated genes. ***P ≤ .001. (C) Heat map of SE-associated TF genes identified by ROSE in at least 6 MM samples. The blue color indicates the presence of an SE that is associated with the indicated TF gene. The 4 identified clusters (I to IV) are indicated.
Recurring SEs are associated with TF genes in MM cells and normal controls. (A) SEs identified by ROSE in MM, memB, and PB cells. Selected TFs included in panel C are indicated. (B) SE-associated genes are expressed higher than genes associated with TEs. Box and whiskers plots display FPKM for SE- or TE-associated genes. ***P ≤ .001. (C) Heat map of SE-associated TF genes identified by ROSE in at least 6 MM samples. The blue color indicates the presence of an SE that is associated with the indicated TF gene. The 4 identified clusters (I to IV) are indicated.
The shared SE association of TFs across cell types in clusters I to III suggests that these have a general role in B-lineage cells (cluster I) or a specific role in memB/PBs (cluster II/III) in addition to potentially aberrant functions in MM. This is consistent with the observation that the MM enhancer repertoire contains both memB- and PB-related features (supplemental Figure 3D-E). Interestingly, the IRF4 and MYC SEs (cluster IV) are only found in MM cells. This suggests that SE establishment underpins the IRF4 and MYC overexpression that is essential to the MM etiology and progression18 and that other TFs in cluster IV are critical in MM biology.
Together, these observations implicate SE establishment as an important mechanism for causing deregulated TF expression and thereby underpin the aberrant MM gene regulatory program.
De novo SE formation in association with t(11;14) and t(4;14) translocations
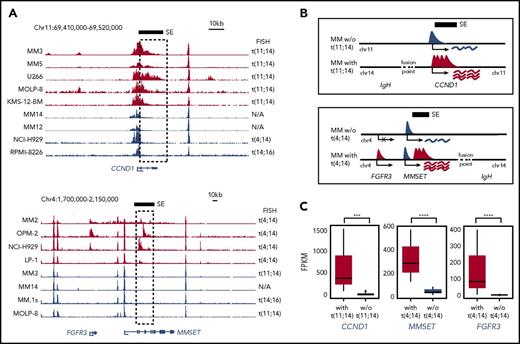
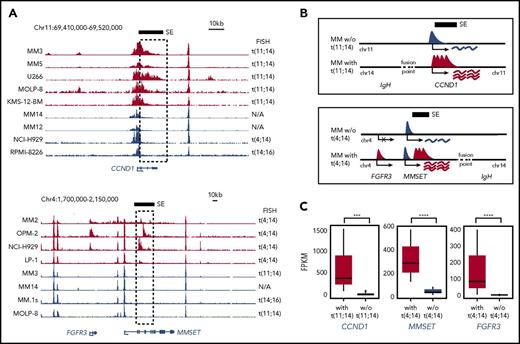
Translocations juxtaposing CCND1 and FGFR3/MMSET with the IGH SEs are central to MM biology7 and have been linked to aberrant expression of these genes in MM.7,41 To determine how IGH translocations impact the regulation of the juxtaposed oncogenes, we visually compared H3K27Ac signals in samples with t(4;14) and t(11;14) translocations (Figure 3A). Interestingly, samples displayed de novo SE formation at translocated CCND1 and FGFR3/MMSET loci (Figure 3A and schematic model depicted in Figure 3B), potentially formed as a consequence of altered chromatin topology that was introduced by the translocation regardless of the exact breakpoints. As expected, the expression of CCND1, MMSET, and FGFR3 was significantly higher in MM cells carrying IGH translocations (Figure 3C). This suggests that the strong activation of these genes is a result of the combined activity of IGH SEs and the de novo SE.
t(11;14) and t(4;14) translocations results in de novo SE formation in MM. (A) H3K27Ac signals in MM cells at the CCND1 (top) and FGFR3/MMSET loci (bottom). Translocations involving the IGH locus (on chr14) in individual MM samples are indicated on the right. The black bar and dashed box indicate the de novo SE's genomic position. (B) Illustration depicting the normal CCND1 and FGFR3/MMSET loci and the loci after juxtaposition of IGH SEs with accompanying de novo SE formation and transcription. (C) RNA-seq expression levels (average FPKM ± standard deviation) of CCND1, MMSET, and FGFR3 in MM with or without the indicated translocation. N/A, not applicable; w/o, without. ***P ≤ .001; ****P ≤ .0001.
t(11;14) and t(4;14) translocations results in de novo SE formation in MM. (A) H3K27Ac signals in MM cells at the CCND1 (top) and FGFR3/MMSET loci (bottom). Translocations involving the IGH locus (on chr14) in individual MM samples are indicated on the right. The black bar and dashed box indicate the de novo SE's genomic position. (B) Illustration depicting the normal CCND1 and FGFR3/MMSET loci and the loci after juxtaposition of IGH SEs with accompanying de novo SE formation and transcription. (C) RNA-seq expression levels (average FPKM ± standard deviation) of CCND1, MMSET, and FGFR3 in MM with or without the indicated translocation. N/A, not applicable; w/o, without. ***P ≤ .001; ****P ≤ .0001.
Chromatin states of MM
To determine chromatin accessibility changes in MM, we performed ATAC-seq on memB, PB, PC, and primary MM samples. Similar to what was observed for H3K27Ac, saturation analysis indicated that our samples provide a robust representation of open chromatin in MM (supplemental Figure 5A). Furthermore, PCA of ATAC-seq data revealed distinct clustering of normal cells with PCs most closely resembling MM (supplemental Figure 5B).
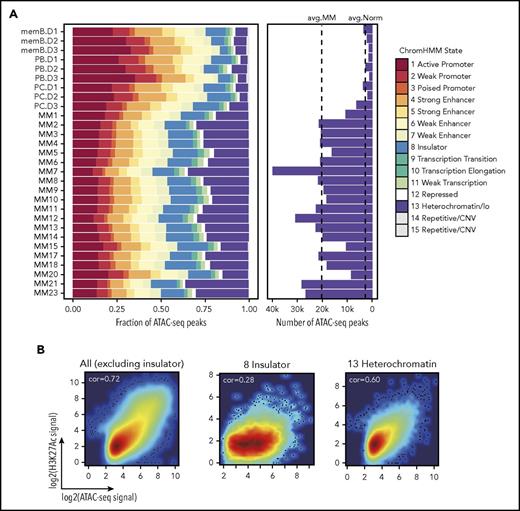
ENCODE has previously annotated the GM12878 (commonly used to represent normal B cells in epigenetics) genome as belonging to 1 of 15 distinct chromatin (ChromHMM) states.42 To annotate open chromatin regions, we overlapped MM ATAC-seq peaks with GM12878 ChromHMM (Figure 4A). Strikingly, a large fraction of MM open chromatin is localized within the ChromHMM heterochromatin state (Figure 4A left panel). This enrichment is statistically significant (P value: 3.27 × 10⁻⁶) and represents a large increase in the absolute number of open chromatin regions (Figure 4A right panel).
Heterochromatin regions become accessible in MM and are associated with increased activity of regulatory elements. (A) Bar chart displaying the overlap between open chromatin identified (by ATAC-seq) in MM, memB, PB, and PC samples and the 15 ChromHMM states defined in GM12878. Chromatin states are indicated by colors. The right panel indicates the absolute number of open chromatin regions that overlap with the GM12878 heterochromatin state. The dotted lines indicate the mean number of open chromatin regions within the GM12878 heterochromatin state in MM and normal controls. (B) Scatter plot of normalized H3K27Ac and ATAC-seq (open chromatin) signals in the indicated chromatin states (data from 1 representative MM). cor, correlation.
Heterochromatin regions become accessible in MM and are associated with increased activity of regulatory elements. (A) Bar chart displaying the overlap between open chromatin identified (by ATAC-seq) in MM, memB, PB, and PC samples and the 15 ChromHMM states defined in GM12878. Chromatin states are indicated by colors. The right panel indicates the absolute number of open chromatin regions that overlap with the GM12878 heterochromatin state. The dotted lines indicate the mean number of open chromatin regions within the GM12878 heterochromatin state in MM and normal controls. (B) Scatter plot of normalized H3K27Ac and ATAC-seq (open chromatin) signals in the indicated chromatin states (data from 1 representative MM). cor, correlation.
Next, we examined if increased chromatin accessibility within the heterochromatin state led to increased activity (Figure 4B). As expected, ATAC-seq and H3K27Ac signals were poorly correlated in insulator regions (0.28) but had high correlation in other regions (0.72) (Figure 4B middle and left panels). Similar to noninsulator regions, open chromatin within the heterochromatin state also displayed significant correlation to increased activity (0.60) (Figure 4B right panel). De novo motif enrichment analysis of these regions (supplemental Figure 5C) indicates that the activity of these elements rely on the same TFs that drive global changes in the MM gene regulatory program (Figure 1F).
We next attempted to assess the potential function of genes that are deregulated by activation of regulatory elements within the heterochromatic state using GREAT. Interestingly, there was a strong association between these regions and the cyclic adenosine monophosphate (cAMP) signaling pathway and its related pathways in 11 of 23 MM samples (supplemental Figure 5D).
Together, these data suggest that widespread conversion of normally heterochromatic regions into accessible active chromatin is a key step in MM development and that, in at least a subset of patients, this leads to altered cAMP signaling.
Changes to fundamental building blocks in TF regulatory networks
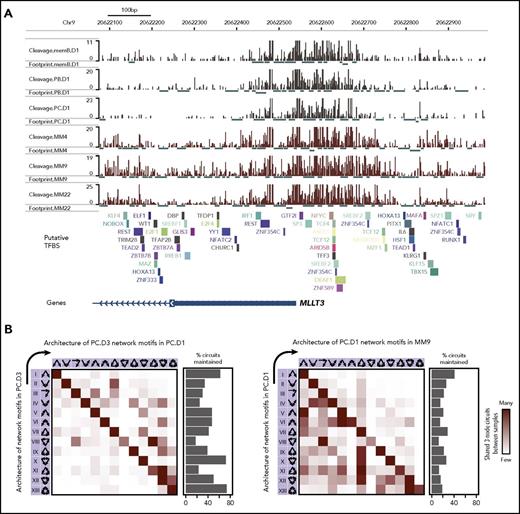
The aberrant gene regulatory program in MM is linked to TF-associated SEs that are shared by normal and MM cells (Figure 2). We therefore hypothesized that higher-level organization of TF-to-TF regulatory relationships would differ despite TFs being part of the regulatory circuitry in both cell types. To identify potential changes, we used a previously described method for comparing TF network architecture26 that describes networks in terms of 13 three-node network motifs that are analogous to network building blocks (supplemental Figure 6A). To count the occurrences of each network motif, genomic footprints were used to determine TF binding (Figure 5A). TF binding was then used to build global TF regulatory networks26 in which network motifs were counted.
Building blocks of the MM TF regulatory network differ from normal cells. (A) ATAC-seq (Tn5 integration sites) signals in the 1-kb region surrounding the MLLT3 promoter region in memB, PB, PC, and MM cells. TF footprints identified by DNase2TF in each sample are displayed below each respective track. Putative TF binding sites (TFBS) are displayed below tracks. (B) The 13 possible network motifs (3-node circuits) were identified in a global network built from TF binding (determined by TF footprints) in TF gene promoters for the cell type (indicated on the y-axis). Each row in the heat map indicates the level of conservation of the identified network motif in the second cell type (indicated on the x-axis). The percentages of maintained network motifs are indicated to the right of the heat map. Network motifs are organized from the least to the most interconnected motif (left to right or top to bottom).
Building blocks of the MM TF regulatory network differ from normal cells. (A) ATAC-seq (Tn5 integration sites) signals in the 1-kb region surrounding the MLLT3 promoter region in memB, PB, PC, and MM cells. TF footprints identified by DNase2TF in each sample are displayed below each respective track. Putative TF binding sites (TFBS) are displayed below tracks. (B) The 13 possible network motifs (3-node circuits) were identified in a global network built from TF binding (determined by TF footprints) in TF gene promoters for the cell type (indicated on the y-axis). Each row in the heat map indicates the level of conservation of the identified network motif in the second cell type (indicated on the x-axis). The percentages of maintained network motifs are indicated to the right of the heat map. Network motifs are organized from the least to the most interconnected motif (left to right or top to bottom).
As expected, the network motifs detected in PCs were to a large extent maintained across 2 different PC donors (Figure 5B left panel). In addition, the number of motifs that were conserved in the PC network between the donors was relatively high (Figure 5B left panel bar chart). As expected, more substantial changes in the network motifs were observed when comparing different developmental stages (supplemental Figure 6B). Hence, overall, the cell type–specific network architecture is relatively maintained between biological replicates. However, network motifs detected in PCs substantially changed in MM cells in terms of both network motifs and maintained circuits. The tendency toward complex interconnected network motifs observed in PCs changed to less interconnected motifs in MM (Figure 5B right panel; supplemental Figure 6C). Together, these findings suggest that even though PCs and MM cells share the expression of many TFs, their gene regulatory network architectures are distinctly different and that the MM network tends to have less complex regulatory motifs.
The SE TF regulatory network in MM
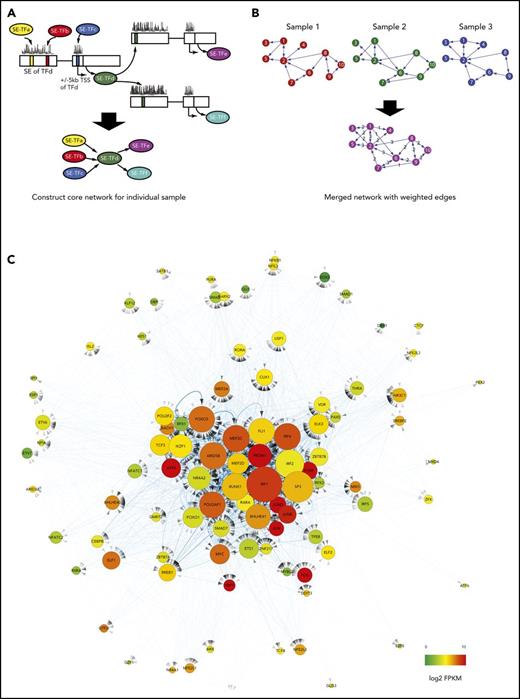
To investigate the transcriptional regulatory network established by SEs in MM, ChIP-seq, RNA-seq, and TF footprinting data were integrated. To make a comprehensible network, we restricted the network by considering only SE-associated TF genes. In brief, footprinting was used to call the bindings of all SE-associated TFs in SEs and promoters of included TF genes (Figure 6A). The networks constructed for individual samples were merged (Figure 6B) into a consensus MM TF regulatory network (Figure 6C).
Core TF regulatory network derived from data integration. (A) Transcriptional networks were built for individual MM samples based on SE-associated TF genes and their binding to SEs (called by footprinting) and promoter regions of SE-associated TF genes. (B) Individual networks are combined into a merged SE TF regulatory network with weighted edges. (C) Cytoscape visualization of the merged SE TF regulatory network originating from 8 individual MM cell lines. Based on the weights of all connections, TFs are organized from the center (high weight) to the periphery (low weight) of the network. The node size represents the number of degrees or connections to the SE-associated TF gene, whereas a weighted edge defines the regulatory relationship (arrows indicating regulation/binding) between TF genes. Expression levels (log2 FPKM) of TF in the network are indicated by color.
Core TF regulatory network derived from data integration. (A) Transcriptional networks were built for individual MM samples based on SE-associated TF genes and their binding to SEs (called by footprinting) and promoter regions of SE-associated TF genes. (B) Individual networks are combined into a merged SE TF regulatory network with weighted edges. (C) Cytoscape visualization of the merged SE TF regulatory network originating from 8 individual MM cell lines. Based on the weights of all connections, TFs are organized from the center (high weight) to the periphery (low weight) of the network. The node size represents the number of degrees or connections to the SE-associated TF gene, whereas a weighted edge defines the regulatory relationship (arrows indicating regulation/binding) between TF genes. Expression levels (log2 FPKM) of TF in the network are indicated by color.
As expected, IRF4 and other IRF family members (IRF1 and IRF2) were found to be highly connected and central to the network, confirming the central role of IRFs in MM biology and in driving the MM gene expression program. Similarly, MYC, MEF, IKZF1, and RUNX2 have been shown to play central roles in MM biology.6,7,43,44 In agreement with this, MYC, IKZF1, and members of the RUNX family (in particular, RUNX1) are highly connected within the TF regulatory network.
In addition to the IRF-IRF composite motifs, ETS, MEF2, E-box, and AP-1 motifs were prominent in enhancers with increased activity in MM cells (Figure 1F). All TF families represented by these motifs are highly connected and central to the MM TF regulatory network (Figure 6C), arguing that they are critical in MM pathobiology. Although the importance of the Fos (FOS/FOSB) and Jun (JUN/JUNB/JUND) gene family members has recently been demonstrated,45 this implicates E-box–binding TFs (TCF3/E2A and potentially MYC), MEF2B/C, and several ETS factors (FLI1, ELK3, ETS1, ELF1, and ELF2) as novel key MM TFs.
Hence, our SE-TF regulatory network identified TFs known to be critical for MM pathobiology as well as several novel TFs not previously studied in MM. In addition, the network offers a comprehensive view of the interplay between key TFs that together drive the aberrant gene regulatory program in MM.
Validation of key TF nodes in the MM TF regulatory network
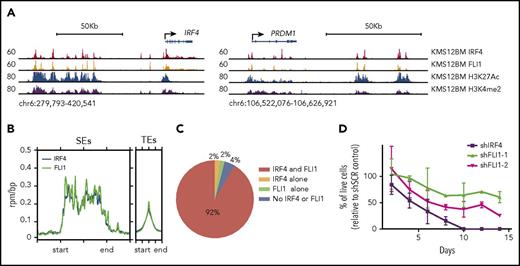
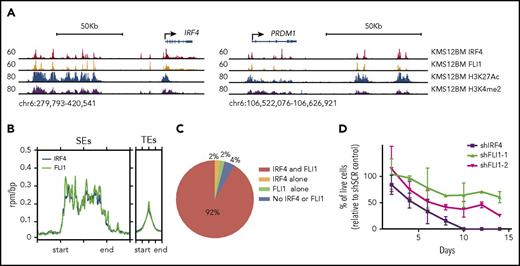
To validate the central roles of IRF and ETS factors in the MM gene regulatory network (Figure 6C), we performed IRF4 and FLI1 ChIP-seq in MM cells. IRF4 and FLI1 ChIP-seq gave robust signals (Figure 7A), and identified peaks were significantly enriched for IRF and ETS motifs, respectively (supplemental Figure 7A-B). Both TFs were found to bind active enhancers (Figure 7A-B) but with higher enrichment at SEs than TEs (Figure 7B). Interestingly, IRF4 and FLI1 showed significant overlap, with 92% of all SEs (Figure 7C) and 39% of all enhancers (supplemental Figure 7C) displaying binding of both TFs. The strong association of IRF4 and FLI1 with SEs in MM cells indicates that they control genes critical for MM biology and survival. To address this, MM cells were subjected to shRNA-mediated knockdown of IRF4 and FLI1. Significant knockdown of both IRF4 and FLI1 was achieved (data not shown and supplemental Figure 7D, respectively), and tumor toxicity was evaluated. Knockdown of both IRF4 and FLI1 led to increased cell death; the former was in agreement with previous studies.18
Genomewide occupancy and functional knockdown of key TFs in MM cells. (A) Browser shots showing IRF4, FLI1, H3K27Ac, and H3K4me2 ChIP-seq in KMS12BM MM cells at the IRF4 (left) and PRDM1 loci (right). (B) Distribution of IRF4 and FLI1 ChIP-seq signals at SEs and TEs (defined by H3K27Ac). (C) Cooccupancy of IRF4 and FLI1 at SEs (% of SEs identified in KMS12BM). (D) Percentage of live cells in knockdown samples relative to scramble controls at indicated time points. Two independent experiments with 2 replicates of each were performed.
Genomewide occupancy and functional knockdown of key TFs in MM cells. (A) Browser shots showing IRF4, FLI1, H3K27Ac, and H3K4me2 ChIP-seq in KMS12BM MM cells at the IRF4 (left) and PRDM1 loci (right). (B) Distribution of IRF4 and FLI1 ChIP-seq signals at SEs and TEs (defined by H3K27Ac). (C) Cooccupancy of IRF4 and FLI1 at SEs (% of SEs identified in KMS12BM). (D) Percentage of live cells in knockdown samples relative to scramble controls at indicated time points. Two independent experiments with 2 replicates of each were performed.
Taken together, these findings confirm that IRF4 and FLI1 together play a central role in the MM gene regulatory network and regulation of MM survival.
Discussion
We here describe the aberrant epigenetic landscape and transcriptional program in FACS-sorted MM cells from up to 24 treatment-naive patients. To our knowledge, this is the first study describing the changes in gene regulatory elements and gene expression in highly purified FACS-sorted primary MM cells. The analysis reveals striking epigenetic differences between MM cells and their normal cell-of-origin counterparts in addition to significant divergence between primary MM and MM cell lines.
MM cells show substantial epigenetic changes that are closely linked to aberrant transcription of genes linked to multiple facets of MM biology (Figure 1D; supplemental Figure 3F). Based on motif enrichment analysis, these changes seem to rely on a relatively small subset of TFs, including IRF, ETS, MEF2, E-Box, and AP-1 family members (Figure 1F). The significant enrichment of E-Box sequences (CAG(G/C)TG) indicate an important function for E proteins (TCF3/E2A, TCF4/E2-2, and TCF12/HEB)46 and potentially noncanonical binding of MYC47 in shaping the MM-associated enhancer repertoire. The role of the ETS family of TFs has remained unexplored. Interestingly, we found that ETS family members FLI1 and ETS1 both are regulated by SEs in MM and central to the MM regulatory network. Confirming this, FLI1 strongly associated with SEs together with IRF4 and was found to be important for MM cell survival. Hence, this highlights the critical role of the ETS family in MM and suggests a highly collaborative role with the IRFs in MM biology. In addition, multiple other TFs are associated with SEs (Figure 2C) and central to the gene regulatory network (Figure 6C). Future studies of the binding patterns of these TFs will reveal their functions in the establishment and regulation of the MM gene regulatory program.
Strikingly, MM cells display increased chromatin accessibility within areas of the genome that are heterochromatic in normal B cells (Figure 4). These changes in accessibility are accompanied by enhancer activation and active transcription, as indicated by the positive correlation between ATAC-seq and H3K27Ac signals (Figure 4B). This suggests that decompaction of heterochromatin is a defining feature of MM. Globally, DNA hypomethylation is associated with MM disease progression.48 Reduced DNA methylation could thus cause increased chromatin accessibility, thereby allowing for TFs to associate with DNA in these regions in MM cells. This would then predict that progressively increased chromatin accessibility should be associated with disease progression. Alternatively, aberrant TF binding could be responsible for decreased DNA methylation levels in bound regions. Interestingly, accessible regions within the normally heterochromatic regions are strongly associated with genes involved in the cAMP-signaling pathway in a large subset of patients (supplemental Figure 5D). cAMP, a well-known second messenger, has previously been targeted in MM and the in vitro treatment effectiveness described.49 Hence, these findings potentially argue for the use of phosphodiesterase inhibitors or other agents that manipulate cAMP levels as part of treatment in a subset of MM patients.49
MM cells seemingly rely on a core set of TFs regardless of the transforming oncogenic mechanism.10,46 Consistent with this notion, several SE-associated TFs were recurrently identified in MM samples (Figure 2C), suggesting that SE establishment is a key component of MM biology. As previously suggested,18,20 this makes these groups of TFs and SEs attractive therapeutic targets. However, because MM consists of several subgroups,8 many of the TF-associated SEs identified were only present in certain subsets of patients (Figure 2C). Addressing the connection between MM subgroups, genetic abnormalities, and changes in the regulatory landscape promises to offer further insights into mechanism of transformation and clinical outcome.
Taken together, studying epigenetic and gene-regulatory changes in cancer may represent a path both to understand the underlying mechanisms of transformation and to identify novel therapeutics that result in minimal effects on normal cells or that target specific disease subgroups. Indeed, this study identifies distinct gene regulatory changes and previously unrecognized features of MM biology that may be linked to potential therapeutic targets.
The online version of this article contains a data supplement.
The publication costs of this article were defrayed in part by page charge payment. Therefore, and solely to indicate this fact, this article is hereby marked “advertisement” in accordance with 18 USC section 1734.
Acknowledgments
The authors thank the Wallenberg Institute for Regenerative Medicine FACS facility at Karolinska Institutet (KI) and the Baylor Institute for Immunology Research (BIIR, Dallas, Texas) Flow Cytometry Shared Resource Laboratory for flow cytometry and cell sorting, the Karolinska High-Throughput Center (KI), and the Karolinska Bioinformatics and Expression Analysis and Genomics Core (KI) for assistance with high-throughput sequencing, the Karolinska University Hospital Hematology Center, the Baylor Charles A. Sammons Cancer Center (Dallas, Texas), the Department of Lymphoma and Myeloma at Anderson Cancer Center (Houston, Texas), Baylor Scott & White Memorial Hospital (Temple, Texas), and Luz Muniz (Baylor Research Institute) for MM sample collection. The authors thank the BIIR Biobank & Project Management Core for assistance with sample processing and the BIIR Bioinformatics and Biostatistics Cores for assistance in sequencing data processing and storage. Finally, the authors thank Carson Harrod for proofreading the manuscript.
This work was supported by the Baylor Charles A. Sammons Cancer Center, the Baylor Scott & White Research Institute, the Swedish Cancer Foundation (Cancerfonden), the Knut and Alice Wallenberg Foundation (KAW), the Swedish Foundation for Strategic Research, the Karolinska Institutet Research Foundation, and a private donation by Björn and Lena Ulvaeus.
Authorship
Contribution: Y.J., E.H., R.M., and Y.C.L. designed the research; Y.J., E.H., A.D.K., L.M., A.W., and C.G. performed the research; Y.J., K.C., A.D.P., E.H., R.M., and Y.C.L. analyzed and interpreted the data; Y.J., K.C., and A.D.P. performed the statistical analysis; R.E.D., Y.M.L., R.S., A.W., and H.N. provided MM samples; Y.J., K.C., A.D.P., E.H., R.M., and Y.C.L. wrote the manuscript; and R.M. and Y.C.L. supervised the study.
Conflict-of-interest disclosure: The authors declare no competing financial interest.
Correspondence: Robert Mansson, Karolinska Institutet, Medicinaren 25/Neo, 141 83 Huddinge, Stockholm, Sweden; e-mail: robert.mansson@ki.se; and Yin C. Lin, Baylor Scott & White Research Institute, 3434 Live Oak St, Dallas, TX 75204; e-mail: yin.lin@bswhealth.org.
REFERENCES
Author notes
Y.J., K.C., and A.D.P. contributed equally to this study.
R.M. and Y.C.L. contributed equally to this study.

