Key Points
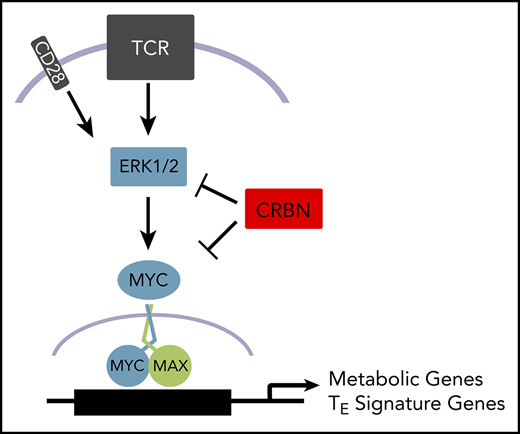
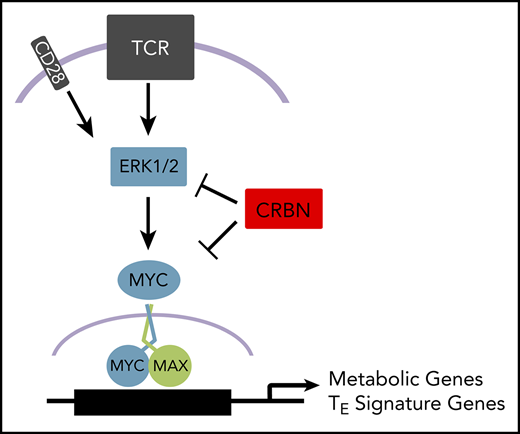
Cereblon loss or treatment with cereblon E3 ligase-modulating compounds provokes a hypermetabolic T-cell effector phenotype.
Nutrient consumption and metabolism of activated CD8+ T cells is orchestrated by cereblon’s control of Myc.
Abstract
Immunomodulatory drugs, such as thalidomide and related compounds, potentiate T-cell effector functions. Cereblon (CRBN), a substrate receptor of the DDB1-cullin-RING E3 ubiquitin ligase complex, is the only molecular target for this drug class, where drug-induced, ubiquitin-dependent degradation of known “neosubstrates,” such as IKAROS, AIOLOS, and CK1α, accounts for their biological activity. Far less clear is whether these CRBN E3 ligase-modulating compounds disrupt the endogenous functions of CRBN. We report that CRBN functions in a feedback loop that harnesses antigen-specific CD8+ T-cell effector responses. Specifically, Crbn deficiency in murine CD8+ T cells augments their central metabolism manifested as elevated bioenergetics, with supraphysiological levels of polyamines, secondary to enhanced glucose and amino acid transport, and with increased expression of metabolic enzymes, including the polyamine biosynthetic enzyme ornithine decarboxylase. Treatment with CRBN-modulating compounds similarly augments central metabolism of human CD8+ T cells. Notably, the metabolic control of CD8+ T cells by modulating compounds or Crbn deficiency is linked to increased and sustained expression of the master metabolic regulator MYC. Finally, Crbn-deficient T cells have augmented antigen-specific cytolytic activity vs melanoma tumor cells, ex vivo and in vivo, and drive accelerated and highly aggressive graft-versus-host disease. Therefore, CRBN functions to harness the activation of CD8+ T cells, and this phenotype can be exploited by treatment with drugs.
Introduction
Cereblon (CRBN), first discovered through genetic linkage analysis in patients who had a mild, autosomal recessive, nonsyndromic intellectual disability, is the sole documented target of a thalidomide-derived class of E3 ligase-modulating agents that induce immune modulation, teratogenicity, and antineoplastic activity1,2 in multiple myeloma,3,4 B-cell malignancies,5-7 and deletion chromosome 5q myelodysplastic syndrome.8,9 CRBN functions as the substrate-recruiting module for DDB1 (DNA damage-binding protein-1), Cul4A or B (cullin 4), and ROC1 (regulator of cullin 1) E3 ubiquitin ligase complex,10-12 and binding of immune modulating compounds (hereinafter referred to as IM) alters the specificity of this E3 ligase, to degrade a cast of “neosubstrate” proteins that play important roles in hematopoiesis, angiogenesis, and T- and NK-cell regulation.6,13-15 Of these known targets, the lymphocyte transcriptional repressor IKAROS16 and its paralogue AIOLOS17 are the only suggested determinants of IM compound-driven T-cell phenotypes,14,18 However, it has been suggested that some of the IM properties of these compounds reflect displacement of normal CRBN binding partners, which are poorly characterized.19 In particular, Crbn-deficient CD4+ T cells augment disease pathogenesis in a model of experimental autoimmune encephalomyelitis; this has been attributed to epigenetic regulation of the Kcna3 gene, which encodes Kv1.3, a voltage-activated potassium ion channel.20
T-cell stimulation leads to dynamic changes in metabolic programming that are critical for the survival and homeostasis of the T-cell compartment,21 and T cells must elevate both aerobic glycolysis and oxidative phosphorylation (OXPHOS), to promote antigen-induced growth, proliferation, and effector functions.22-24 Thus, identifying T-cell metabolic regulators, especially those targetable by small-molecule agonists or inhibitors, is likely to have a dramatic impact on various forms of immunotherapy.25 With a focus on CD8+ T cells, we report that CRBN expression is dynamically regulated during T-cell receptor (TCR) activation, CRBN controls expression of the master T-cell metabolic regulator c-MYC (MYC),26 and Crbn deficiency or IM compound treatment confers a unique and superior T-cell metabolic program. Collectively, these findings reveal CRBN to be a tractable regulator of T-cell metabolism and function that has broad potential to modulate T-cell effector (TE) functions in clinical settings.
Methods
A summary of all key resources is provided in supplemental Table 1, and detailed methods are provided in supplemental Material and supplemental Tables 2 and 3, available on the Blood Web site.
T-cell isolation and activation
Spleens from 6- to 12-week-old mice were processed into single-cell suspensions and placed in red blood cell lysis buffer for 1 minute. CD3+, CD8+, and CD4+ T and B cells were isolated by immunomagnetic negative selection according to the manufacturer’s protocol (Miltenyi Biotec, Bergisch Gladbach, Germany). Human T cells were derived from buffy coats (OneBlood, Tampa, FL) and were isolated per the manufacturer’s protocol and frozen at −80°C in 90% fetal bovine serum and 10% dimethyl sulfoxide before use. Before activation, T cells were rested in complete medium for 1 to 3 hours at 37°C. For flow-based assays, reverse transcription-polymerase chain reaction (RT-PCR), Seahorse analyses, cytokine analysis, and metabolomics, 96-well round bottom plates were coated with 3 to 5 µg/mL anti-CD3 in 100 µL phosphate-buffered saline overnight at 4°C or for 90 minutes at 37°C. Crbn+/+ and Crbn−/− T cells were plated in equal numbers (2 × 10⁵ per well), with and without 1 µg/mL anti-CD28. For western blot analysis, 12-well plates were similarly coated, and 2 × 10⁶ T cells per well were plated with 1 µg/mL anti-CD28. For OT1 and OT1;Crbn−/− activation, 106 splenocytes were plated per well in a 24-well plate with 0.001 to 1.0 nM peptide and 10 ng/mL interleukin-2 (IL-2), unless otherwise indicated.
Experimental melanoma mouse model and adoptive cell transfer
Mice were injected subcutaneously with 105 B16 melanoma cells on the left flank. Tumors were measured every 2 to 3 days by 2 perpendicular measurements, and volume was calculated by the equation axb2 × 0.52, where a is the longest measurement and b is the perpendicular measurement. Mice were euthanized when tumors ulcerated or the longest side exceeded 20 mm. Some cohorts of mice were euthanized early (days 10-14) for tumor-infiltrating lymphocyte analysis. Tumors were processed into a single-cell suspension and agitated for 30 minutes in complete RPMI medium supplemented with collagenase I and IV, hyaluronidase, and DNase I. Populations of T cells from tumors were stained for flow cytometry and immediately analyzed. For adoptive cell transfer, CD45.1 mice were sublethally irradiated for 3 days after initial tumor inoculation at 600 rad, and 2 × 10⁶ T cells were injected via tail vein. The mice were then treated with 250 000 IU IL-2 via intraperitoneal injection twice daily for 3 days.
Experimental GVHD mouse model
To induce graft-versus-host disease (GVHD), we performed the major histocompatibility complex–mismatched C57BL/6-to-BALBc/J bone marrow transplantation model. Crbn−/− and Crbn+/+ T cells were purified according to the manufacturer’s instructions (EasySep). BALB/c mice were lethally irradiated with 800 to 900 cGy and injected with 5 × 10⁶ CD3-depleted Crbn+/+ bone marrow cells, with and without 106 T cells from either Crbn+/+ or Crbn−/− mice via the tail vein 24 hours after irradiation. Weight was measured at various intervals. Interferon-γ (IFN-γ) and IL-17 were measured by flow cytometry in splenocytes harvested 14 days after transplantation and restimulated with phorbol myristate acetate, ionomycin, and 1 µL/mL brefeldin A.
Results
CRBN is dispensable for T-cell development but represses CD8+ T-cell activation
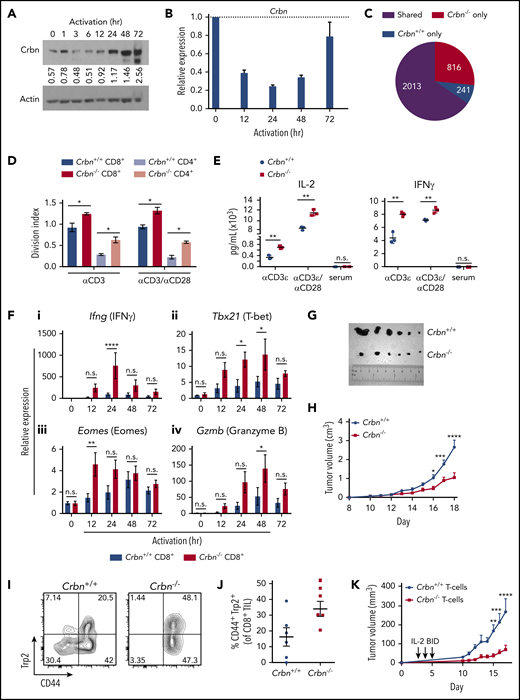
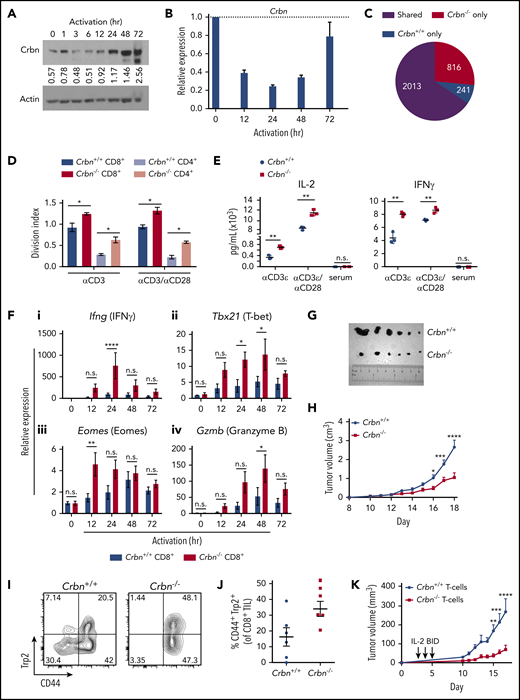
First, we assessed the effects of TCR activation with anti-CD3ε/anti-CD28 on CRBN expression in both mouse and primary human CD8+ T cells. Quantitative RT-PCR (qRT-PCR) and immunoblot analyses revealed that CRBN expression was dynamically controlled in activated T cells, where (1) there were marked reductions in levels of CRBN protein (Figure 1A) and messenger RNA (mRNA; Figure 1B) in mouse and human T cells (supplemental Figure 1A) immediately after TCR activation; and (2) Crbn mRNA expression then rebounded, and CRBN protein levels rose to levels higher than those found in unstimulated T cells. These findings suggest that CRBN functions in controlling T-cell activation. Indeed, expression-profiling analysis of unstimulated vs anti-CD3ε/anti-CD28–activated Crbn+/+ and Crbn−/− CD3+ T cells revealed that, although there were few differences in gene expression in unstimulated T cells, there were 816 differentially expressed genes in activated Crbn−/− T cells (Figure 1C; supplemental Figure 1B).
Ablation of Crbn augments T-cell activation and function. CRBN protein (A) and mRNA (B) levels following anti-CD3ε/anti-CD28 stimulation of mouse (C57Bl/6) T cells. (C) Number of transcriptional changes after anti-CD3ε+anti-CD28 stimulation of Crbn+/+ T cells, Crbn−/− T cells, or both (Shared). (D) Crbn+/+ and Crbn−/− CD4+ and CD8+ T-cell proliferation after 72 hours of 5 μg/mL anti-CD3ε+/−/1 μg/mL anti-CD28 stimulation, as measured by CellTrace Violet (CTV), quantified by the division index (mean number of divisions per cell). (E) Production of IL-2 and IFN-γ after 72 hours of activation in Crbn+/+ and Crbn−/− T cells after stimulation with anti-CD3ε+/−/anti-CD28. (F) Fold change in levels of the indicated mRNAs (determined by qRT-PCR) after activation of Crbn+/+ and Crbn−/− CD8+ T cells for 12, 24, 48, and 72 hours, relative to levels of B2M (β2-microglobulin) mRNA: Ifng (i), Tbx21 (ii), Eomes (iii), and Gzmb (iv). (G) Images of representative B16 melanoma tumors in Crbn+/+ and Crbn−/− recipient mice and (H) tumor growth over time in these 2 cohorts. (I-J) CD44 cell surface expression and Trp2-peptide reactivity of CD8 tumor-infiltrating lymphocytes from B16 tumor-bearing Crbn+/+ and Crbn−/− mice (day 10). (K) Tumor growth of B16 tumor-bearing mice after adoptive cell transfer of Crbn+/+ and Crbn−/− T cells and treatment with IL-2 twice a day (arrows). All results are representative of at least 2 independent experiments in at least 3 mice (excluding microarray analysis). n.s., not significant; *P < .05; **P < .01; ***P < .001; ****P < .0001.
Ablation of Crbn augments T-cell activation and function. CRBN protein (A) and mRNA (B) levels following anti-CD3ε/anti-CD28 stimulation of mouse (C57Bl/6) T cells. (C) Number of transcriptional changes after anti-CD3ε+anti-CD28 stimulation of Crbn+/+ T cells, Crbn−/− T cells, or both (Shared). (D) Crbn+/+ and Crbn−/− CD4+ and CD8+ T-cell proliferation after 72 hours of 5 μg/mL anti-CD3ε+/−/1 μg/mL anti-CD28 stimulation, as measured by CellTrace Violet (CTV), quantified by the division index (mean number of divisions per cell). (E) Production of IL-2 and IFN-γ after 72 hours of activation in Crbn+/+ and Crbn−/− T cells after stimulation with anti-CD3ε+/−/anti-CD28. (F) Fold change in levels of the indicated mRNAs (determined by qRT-PCR) after activation of Crbn+/+ and Crbn−/− CD8+ T cells for 12, 24, 48, and 72 hours, relative to levels of B2M (β2-microglobulin) mRNA: Ifng (i), Tbx21 (ii), Eomes (iii), and Gzmb (iv). (G) Images of representative B16 melanoma tumors in Crbn+/+ and Crbn−/− recipient mice and (H) tumor growth over time in these 2 cohorts. (I-J) CD44 cell surface expression and Trp2-peptide reactivity of CD8 tumor-infiltrating lymphocytes from B16 tumor-bearing Crbn+/+ and Crbn−/− mice (day 10). (K) Tumor growth of B16 tumor-bearing mice after adoptive cell transfer of Crbn+/+ and Crbn−/− T cells and treatment with IL-2 twice a day (arrows). All results are representative of at least 2 independent experiments in at least 3 mice (excluding microarray analysis). n.s., not significant; *P < .05; **P < .01; ***P < .001; ****P < .0001.
To test the effects of Crbn on T-cell phenotypes, we assessed Crbn-deficient mice,27 where Crbn expression is abolished in all tissues (supplemental Figure 1C-D).27 Consistent with a previous report of mice with a similar global deletion of Crbn,20 splenic CD4+ and CD8+ T-cell populations were equally distributed in Crbn−/− and Crbn+/+ littermates (supplemental Figure 1E), which had similar proportions of CD69+ and CD25+ T cells in the spleen, lymph node, peripheral blood, and bone marrow (supplemental Table 4). The distribution of naïve, long-term memory T cells (TM) and effector TM cells was also comparable in 3-month-old Crbn−/− and Crbn+/+ littermates, and the counts of thymocytes and thymic subpopulations were similar in Crbn−/− and Crbn+/+ mice (supplemental Table 4). Crbn deficiency also had no effect on the distribution of splenic B cells, NK cells, or regulatory T cells (Tregs) (supplemental Table 4). Finally, homeostatic responses within the T-cell compartment were similar in studies evaluating age-associated T-cell phenotypes, where Crbn−/− and Crbn+/+ mice have similar proportions of activated CD44+CD8+ and CD44+CD4+ T cells (supplemental Figure 1F) and the expected age-dependent increases in CD44+ cells that are induced by homeostatic turnover.28,29
To assess the possible effects of Crbn deficiency on T-cell activation, Crbn−/− and Crbn+/+ T cells were stimulated with increasing concentrations of anti-CD3ε, with or without anti-CD28 costimulation. Notably, there were marked increases in the average number of divisions of CD4+ and CD8+ Crbn−/− T cells based on CellTrace Violet staining after activation with anti-CD3ε and even without anti-CD28 costimulation (Figure 1D). Strikingly, increases in the cytokines IL-2 and IFN-γ (Figure 1E) were detected with and without CD28 costimulation, although serum levels of the cytokines were not detected in Crbn−/− mice. Finally, TNF-α, IL-17, and IL-10 levels were also increased in anti-CD3ε stimulated Crbn−/− T cells, but no differences were detected in IL-4 levels (supplemental Figure 1G).
To assess whether the hyperproliferative state of Crbn−/− T cells is associated with changes in the levels of neosubstrates of Crbn (Ikaros and CK1α) or transcription targets of Ikaros (ie, Irf-4), western blot analyses were performed in activated Crbn+/+ and Crbn−/− T cells. Although Ikaros, CK1α, and particularly, Irf-4, were induced after TCR stimulation, their expression levels were not dependent upon Crbn status (supplemental Figure 1H). Moreover, Ikzf1 mRNA levels were not Crbn related (supplemental Figure 1I).
To determine if Crbn deficiency augments CD8+ TE function and activates Crbn−/− and Crbn+/+, CD8+ T cells were assessed for effector markers after TCR stimulation.30,31 Interestingly, activated Crbn−/− CD8+ T cells had significant increases in TE signature genes, including IFN-γ (Ifng), T-bet (T-box 21, Tbx21), Eomes, and granzyme B (Gzmb) (Figure 1F) and perforin (Prf1) (supplemental Figure 1J).
To determine if Crbn−/− CD8+ T cells had increased effector function in vivo, we assessed their activity in syngeneic B16 melanoma transplantation studies. As recipients, Crbn−/− mice demonstrated a significant reduction in tumor progression and burden vs Crbn+/+ mice (Figure 1G-H) and had and an increased number of CD44+ melanoma antigen tyrosinase–related protein (Trp2)–reactive CD8+ tumor-infiltrating lymphocytes (Figure 1I-J). Notably, adoptive cell-transfer studies of Crbn−/− vs Crbn+/+ T cells into B16 melanoma-bearing mice demonstrated that Crbn deficiency confers superior antitumor activity in T cells (Figure 1K). Thus, Crbn deficiency promotes a hyperactive and superior TE phenotype.
CRBN controls the bioenergetics of activated T cells
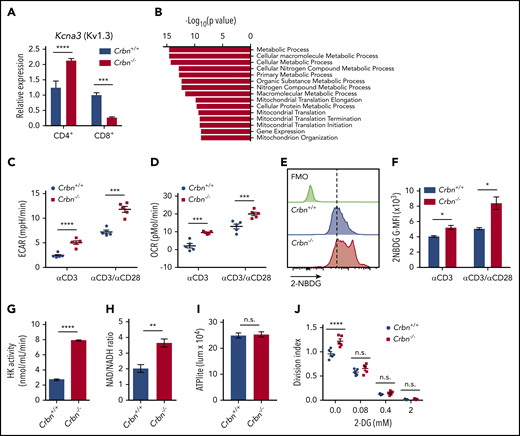
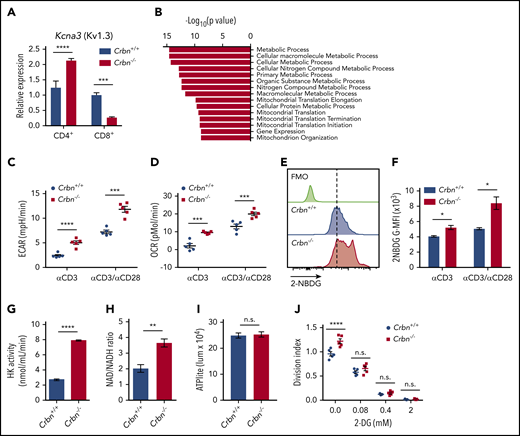
CD4+Crbn−/− T cells have a hyperactivated response after TCR stimulation that is associated with increased expression of the potassium channel Kv1.3.20 We confirmed this finding but, interestingly, activated Crbn−/− CD8+ T cells displayed decreases in Kcna3 mRNA levels compared with activated Crbn+/+ CD8+ T cells (Figure 2A). Thus, other mechanisms likely account for the hyperactivated phenotype of Crbn−/− CD8+ T cells.
CRBN loss augments energetics of activated CD8+ T cells. (A) Relative expression of Kcna3 (vs B2M) after a 24-hour stimulation of Crbn+/+ and Crbn−/− CD4+ and CD8+ T cells with anti-CD3ε, with or without anti-CD28. (B) Pathway analysis of transcripts that specifically change in activated Crbn−/− T cells (Figure 1D). Basal ECARs (C) and OCRs (D) in anti-CD3ε, with or without anti-CD28–activated Crbn+/+ and Crbn−/− CD8+ T cells. (E-F) Glucose uptake of activated Crbn+/+ and Crbn−/− CD8+ T cells with anti-CD3ε, with or without anti-CD28, as measured by the fluorescent glucose analogue 2-NBDG; G-MFI, geometric MFI; FMO, fluorescence −1. (G) Hexokinase (HK) enzymatic activity of activated Crbn+/+ and Crbn−/− CD8+ T cells. (H) NAD+/NADH ratio of activated Crbn+/+ and Crbn−/− CD8+ T cells. (I) ATP production of activated Crbn+/+ and Crbn−/− CD8+ T cells. (J) Crbn+/+ and Crbn−/− CD8+ T-cell proliferation after 72 hours of anti-CD3ε+anti-CD28 stimulation with 2-deoxyglucose to suppress glycolysis. All results are representative of at least 2 independent experiments. n.s., not significant; * P < .05; ** P < .01; *** P < .001; **** P < .0001.
CRBN loss augments energetics of activated CD8+ T cells. (A) Relative expression of Kcna3 (vs B2M) after a 24-hour stimulation of Crbn+/+ and Crbn−/− CD4+ and CD8+ T cells with anti-CD3ε, with or without anti-CD28. (B) Pathway analysis of transcripts that specifically change in activated Crbn−/− T cells (Figure 1D). Basal ECARs (C) and OCRs (D) in anti-CD3ε, with or without anti-CD28–activated Crbn+/+ and Crbn−/− CD8+ T cells. (E-F) Glucose uptake of activated Crbn+/+ and Crbn−/− CD8+ T cells with anti-CD3ε, with or without anti-CD28, as measured by the fluorescent glucose analogue 2-NBDG; G-MFI, geometric MFI; FMO, fluorescence −1. (G) Hexokinase (HK) enzymatic activity of activated Crbn+/+ and Crbn−/− CD8+ T cells. (H) NAD+/NADH ratio of activated Crbn+/+ and Crbn−/− CD8+ T cells. (I) ATP production of activated Crbn+/+ and Crbn−/− CD8+ T cells. (J) Crbn+/+ and Crbn−/− CD8+ T-cell proliferation after 72 hours of anti-CD3ε+anti-CD28 stimulation with 2-deoxyglucose to suppress glycolysis. All results are representative of at least 2 independent experiments. n.s., not significant; * P < .05; ** P < .01; *** P < .001; **** P < .0001.
To gain insight into the hyperactivated state manifested in Crbn−/− CD8+ T cells, gene set enrichment analysis (GSEA) was performed on transcripts unique to activated Crbn−/− T cells (Figure 1D). This analysis revealed an enrichment for metabolic and mitochondrial processes (Figure 2B). Consistent with these findings, anti-CD3ε+anti-CD28–activated Crbn−/− CD8+ T cells had higher basal rates of glycolysis and respiration than activated Crbn+/+ T cells, based on their extracellular acidification rates (ECARs; Figure 2C; supplemental Figure 2) and oxygen consumption rates (OCR; Figure 2D; supplemental Figure 2).
Costimulation with CD28 or other costimulatory molecules is normally necessary to induce robust changes in T-cell metabolism.32 However, increases in basal ECAR and OCR were also evident in polyclonal Crbn−/− CD8+ T cells stimulated with anti-CD3ε alone (Figure 2C-D). Further, the overall reduction in OCR observed after oligomycin treatment (which suppresses mitochondrial adenosine triphosphatase) indicated that mitochondrial adenosine triphosphate (ATP) production rates were elevated in Crbn−/− vs Crbn+/+ CD8+ T cells (supplemental Figure 2). Interestingly, Activated CD8+Crbn−/− T cells displayed significant increases in glucose uptake (as measured by uptake of the fluorescent glucose analogue 2-NBDG; Figure 2E-F), marked increases in hexokinase activity (Figure 2G), and a higher ratio of the oxidized and reduced forms of nicotinamide adenine dinucleotide (NAD+/NADH; Figure 2H), which is consistent with robust respiration and glycolytic rates.33 Static levels of intracellular ATP were comparable in activated Crbn−/− and Crbn+/+ T cells, however, suggesting that the generation of ATP is proportional to its utilization (Figure 2I). Finally, treatment with 2-deoxyglucose, which blocks glycolysis, abolished the proliferative advantage of activated Crbn−/− T cells (Figure 2J). Thus, glycolysis is necessary for the robust metabolic phenotype of Crbn−/− CD8+ T cells and contributes to their superior proliferative response.
Crbn controls antigen-specific activation of CD8+ effector function
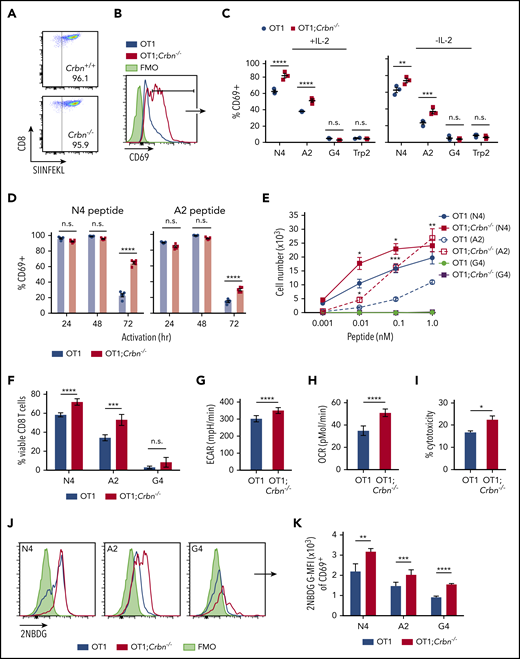
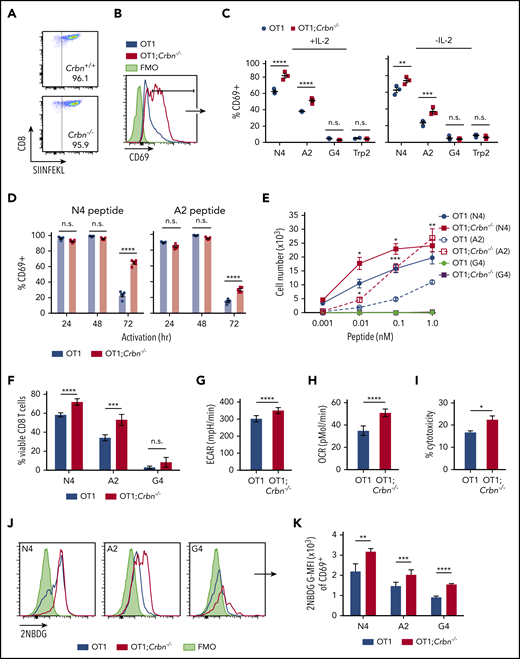
To assess the role of Crbn in antigen-specific activation we evaluated TCR signal strength, spontaneous activation, and persistence in antigen-activated Crbn−/− CD8+ T cells, which were generated by crossing Crbn−/− mice with ovalbumin (OVA) peptide TCR-transgenic mice (OT1).34 As expected, 96% of CD8+ splenocytes from Crbn−/−;OT-1 mice displayed reactivity to the H-2Kb OVA tetramer (Figure 3A). In these experiments, splenocytes were stimulated with the immunodominant, high-affinity SIINFEKL peptide (N4); with a variant, intermediate-affinity OVA peptide (SAINFEKL, A2); or with an OVA peptide (SIIGFEKL, G4) that has very low affinity for the OT1 TCR.35 After 72 hours of activation with the N4 and A2 peptides, CD69 was elevated in OT1;Crbn−/− T cells (Figure 3B) independent of exogenous IL-2 (Figure 3C). In contrast, there was no response to the G4 peptide or to the OT1-irrelevant Trp2 peptide (Figure 3B-C). Interestingly, OT1 and OT1;Crbn−/− T cells expressed comparable levels of CD69 in response to the N4 and A2 peptides immediately after activation, but prolonged elevated expression of CD69 manifested in OT1;Crbn−/− T cells (Figure 3D). The proliferation of OT1;Crbn−/− T cells was also augmented in response to increasing doses of N4 and A2 peptides when compared to OT1 T cells; but again, OT1;Crbn−/− T cells did not respond to the low-affinity G4 peptide (Figure 3E). Thus, CRBN controls the persistence of activated T cells after antigen stimulation, but does not confer responses to a very-low-affinity or irrelevant antigen. In accordance with these findings, peptide-stimulated OT1;Crbn−/− CD8+ T cells had superior viability and higher basal ECAR, basal OCR, and cytotoxic potential against an OVA-expressing B16 melanoma tumor target (Figure 3G-I) and increased uptake of the glucose analogue 2-NBDG (Figure 3J-K).
CRBN controls antigen-specific CD8+ T-cell activation. (A) OVA-reacting, tetramer-positive CD8+ splenocytes from OT1 and OT1;Crbn−/− mice. (B-C) Total number of CD69-expressing OT1 and OT1;Crbn−/− T cells at 72 hours in response to SIINFEKL (N4, B), or in response to N4, SAINFEKL (A2), SIIGFEKL (G4), or Trp2 peptides, with or without added IL-2 (C). (D) CD69 expression in OT1 and OT1;Crbn−/− T cells after 24, 49, and 72 hours of culture with 0.1 nM N4 or A2 peptide. (E) Dose response of peptide-reactive T cells with 0.1 nM of N4, A2, or G4 peptide stimulation, as determined by cell counting. (F) Percentage of viable CD8+ T cells after stimulation with the N4, A2, and G4 peptides for 72 hours. Basal ECARs (G) and basal OCRs (H) from OT1 and OT1;Crbn−/− CD8+ T cells stimulated with SIINFEKL peptide for 24 hours. (I) Percentage of cytotoxicity of OT1 and OT1;Crbn−/− T cells vs OVA-expressing B16 cells (72-hour coculture). (J) Flow analysis of glucose uptake based on fluorescent glucose analogue, 2-NBDG;G-MFI, after 48 hours of activation with the N4, A2, and G4 peptides of OT1 and OT1;Crbn−/− T cells in CD69+ cells. (K) Summary of data shown in panel J. All results are representative of at least 2 independent experiments. n.s., not significant, *P < .05; **P < .01; ***P < .001; ****P < .0001.
CRBN controls antigen-specific CD8+ T-cell activation. (A) OVA-reacting, tetramer-positive CD8+ splenocytes from OT1 and OT1;Crbn−/− mice. (B-C) Total number of CD69-expressing OT1 and OT1;Crbn−/− T cells at 72 hours in response to SIINFEKL (N4, B), or in response to N4, SAINFEKL (A2), SIIGFEKL (G4), or Trp2 peptides, with or without added IL-2 (C). (D) CD69 expression in OT1 and OT1;Crbn−/− T cells after 24, 49, and 72 hours of culture with 0.1 nM N4 or A2 peptide. (E) Dose response of peptide-reactive T cells with 0.1 nM of N4, A2, or G4 peptide stimulation, as determined by cell counting. (F) Percentage of viable CD8+ T cells after stimulation with the N4, A2, and G4 peptides for 72 hours. Basal ECARs (G) and basal OCRs (H) from OT1 and OT1;Crbn−/− CD8+ T cells stimulated with SIINFEKL peptide for 24 hours. (I) Percentage of cytotoxicity of OT1 and OT1;Crbn−/− T cells vs OVA-expressing B16 cells (72-hour coculture). (J) Flow analysis of glucose uptake based on fluorescent glucose analogue, 2-NBDG;G-MFI, after 48 hours of activation with the N4, A2, and G4 peptides of OT1 and OT1;Crbn−/− T cells in CD69+ cells. (K) Summary of data shown in panel J. All results are representative of at least 2 independent experiments. n.s., not significant, *P < .05; **P < .01; ***P < .001; ****P < .0001.
CRBN harnesses arginine and glutamine metabolism to control polyamine levels
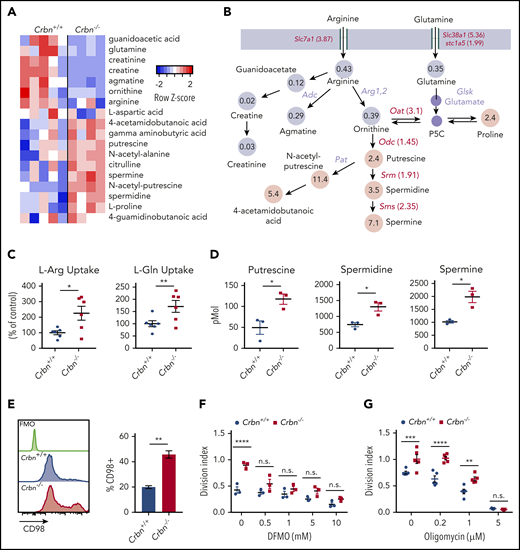
Aerobic glycolysis is a well-known regulator of the CD8+ TE phenotype.36,37 To assess mechanisms that may account for the superior effector phenotype of Crbn−/− CD8+ T cells, we performed global metabolomic profiling by liquid chromatography-mass spectrometry (LC-MS), in both positive and negative ionization modes. MZmine (freeware) was used to identify and align features of activated Crbn+/+ and Crbn−/− CD8+ T cells, which were then defined by principal component analysis. Finally, those with a twofold or greater change and P ≤ .1 were analyzed for pathway overrepresentation (supplemental Figure 3A-B). Pathway enrichment analysis revealed highly significant involvement of the arginine/proline pathway (supplemental Figure 3A; false discovery rate [FDR], 0.006; −log(p), 9.47). A heatmap of metabolites detected in this pathway suggested that activated Crbn−/− CD8+ T cells have increased utilization of glutamine, arginine, and ornithine, as these cells had markedly elevated levels of downstream metabolites, including proline, putrescine, N-acetyl putrescine, 4-acetamidobutanoic acid, and the longer chain polyamines spermidine and spermine (Figure 4A-B; supplemental Figure 3C).
CRBN harnesses arginine and glutamine metabolism in activated CD8+ T cells. (A-B) Metabolomic LC-MS/MS analysis of 24-hour anti-CD3ε+anti-CD28–activated Crbn+/+and Crbn−/− CD8+ T cells. (A) Heat map of metabolites that were significantly different and (B) the average fold change in arginine, glutamine, and proline metabolites. Gray indicates downregulated metabolites in the pathway, and pink denotes increased metabolites in the pathway. Fold change in mRNA levels for enzymes and transporters for each reaction are indicated. All enzymes and transporters were upregulated by the fold change indicated in Crbn−/− CD8+ T cells. Enzymes that were not assessed for differential expression are shown in lavender. (C) L-Arg and L-Glu uptake (% of control) by Crbn+/+ and Crbn−/− CD8+ T cells after 24 hours of anti-CD3ε+anti-CD28 activation. (D) Intracellular putrescine, spermidine, and spermine levels measured by LC-MS/MS of activated Crbn+/+and Crbn−/− CD8+ T cells (24 hours). (E) Flow cytometric analyses of CD98 expression in Crbn+/+and Crbn−/− CD8+ T cells after anti-CD3ε+anti-CD28 stimulation for 24 hours. (F-G) Crbn+/+ and Crbn−/− CD8+ T-cell proliferation after 72 hours of anti-CD3ε+anti-CD28 stimulation with cotreatment of α-difluoromethylornithine (5 mM; DFMO; F) or oligomycin (G). All results are representative of at least 2 independent experiments (excluding metabolomics analysis). n.s., not significant; *P < .05; ** P < .01; ***P < .001; ****P < .0001.
CRBN harnesses arginine and glutamine metabolism in activated CD8+ T cells. (A-B) Metabolomic LC-MS/MS analysis of 24-hour anti-CD3ε+anti-CD28–activated Crbn+/+and Crbn−/− CD8+ T cells. (A) Heat map of metabolites that were significantly different and (B) the average fold change in arginine, glutamine, and proline metabolites. Gray indicates downregulated metabolites in the pathway, and pink denotes increased metabolites in the pathway. Fold change in mRNA levels for enzymes and transporters for each reaction are indicated. All enzymes and transporters were upregulated by the fold change indicated in Crbn−/− CD8+ T cells. Enzymes that were not assessed for differential expression are shown in lavender. (C) L-Arg and L-Glu uptake (% of control) by Crbn+/+ and Crbn−/− CD8+ T cells after 24 hours of anti-CD3ε+anti-CD28 activation. (D) Intracellular putrescine, spermidine, and spermine levels measured by LC-MS/MS of activated Crbn+/+and Crbn−/− CD8+ T cells (24 hours). (E) Flow cytometric analyses of CD98 expression in Crbn+/+and Crbn−/− CD8+ T cells after anti-CD3ε+anti-CD28 stimulation for 24 hours. (F-G) Crbn+/+ and Crbn−/− CD8+ T-cell proliferation after 72 hours of anti-CD3ε+anti-CD28 stimulation with cotreatment of α-difluoromethylornithine (5 mM; DFMO; F) or oligomycin (G). All results are representative of at least 2 independent experiments (excluding metabolomics analysis). n.s., not significant; *P < .05; ** P < .01; ***P < .001; ****P < .0001.
Both l-arginine (L-Arg) and l-glutamine (L-Gln) can serve as the carbon and nitrogen units for polyamine biosynthesis,38 and L-Gln transporters are needed to sustain glutaminolysis in T cells.26 Notably, activated Crbn−/− CD8+ T cells expressed elevated levels of Slc7a1 encoding the L-Arg transporter CAT-1,39 and the Slc38a1 (SNAT1) and Slc1a5 (ASCT2) L-Gln transporters,40 compared with activated wild-type CD8+ T cells (Figure 4B; supplemental Figure 3D-E). Moreover, elevated levels of mRNAs encoding enzymes that catabolize ornithine or direct polyamine biosynthesis, specifically Odc1, Oat, Srm, and Sms, confirmed that this pathway is amplified in activated Crbn−/− vs Crbn+/+ CD8+ T cells (Figure 4B; supplemental Figure 3G-J). Further, uptake studies of U-14C-labeled L-Arg and L-Gln confirmed transport of both amino acids is enhanced in activated Crbn−/− CD8+ T cells (Figure 4C), and targeted tandem mass spectrometry (LC-MS/MS) analyses confirmed that activated Crbn−/− T cells have supraphysiological intracellular levels of putrescine, spermidine, and spermine (Figure 4D). Expression of CD98/Slc3A2, which forms a heterodimer with Slc7A5, to direct transport of neutral branched-chain amino acids,41 was also significantly elevated in Crbn−/− CD8+ T cells (Figure 4E). Finally, the hyperproliferative state of activated Crbn−/− CD8+ T cells required increases in polyamines, as this was abolished by cotreatment with α-difluoromethylornithine, an irreversible inhibitor of ODC42 (Figure 4F).
Superior TE phenotypes of Crbn−/− CD8+ T cells appear to be largely caused by increases in glycolysis and OXPHOS fueled by enhanced nutrient availability and metabolism, yet there was a trend toward higher spare respiratory capacity in activated Crbn−/− CD8+ T cells (supplemental Figures 2D and 3K). Although OXPHOS is necessary for energy generation in TE cells, spare respiratory capacity is considered an important driver for TM differentiation, and mitochondrial remodeling appears to instruct T-cell metabolic programming where TMs manifest fused mitochondria.21 Mitochondrial biomass and mitochondrial membrane potential were not significantly different in activated Crbn−/− and Crbn+/+ CD8+ T cells (supplemental Figure 3L-M), yet transmission electron microscopy revealed modest increases in the number of mitochondria in activated Crbn−/− cells (supplemental Figure 3N-O). However, mitochondrial length and superoxide reactive oxygen species (supplemental Figure 3P-Q) were similar in Crbn+/+ and Crbn−/− CD8+ T cells, which may reflect increased glutathione metabolism in Crbn−/− CD8+ T cells (supplemental Figure 3A). Finally, treatment with the ATP-synthase inhibitor oligomycin43 also impaired the proliferative advantage of activated Crbn−/− T cells (Figure 4G). Thus, nutrients that fuel both glycolysis and OXPHOS contribute to the superior response of Crbn−/− CD8+ T cells that aligns both genetically and metabolically with a TE phenotype.
A CRBN-Myc circuit controls CD8+ T-cell effector phenotypes and metabolism
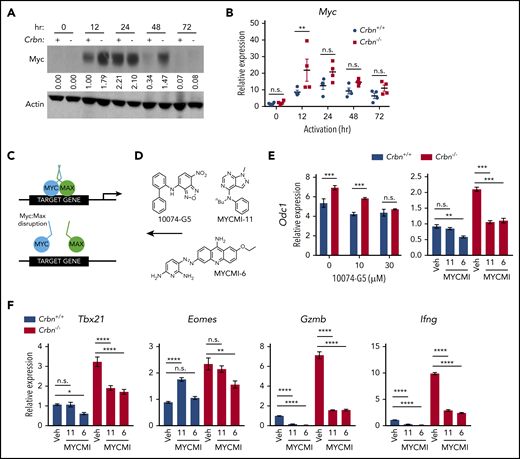
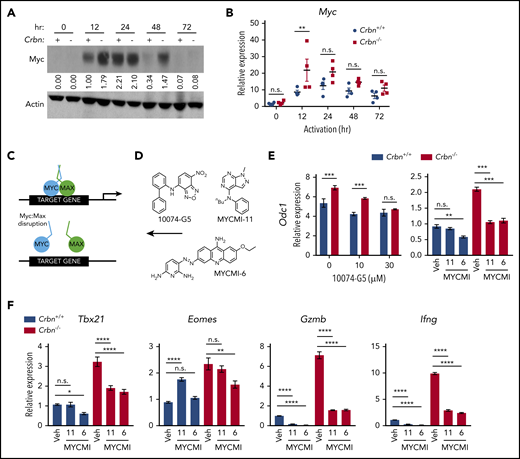
To elucidate the precise pathway activated in Crbn−/− T cells, we subjected differentially expressed genes (Figure 2A) to GSEA for transcriptional drivers. These analyses revealed that the gene expression changes in activated Crbn−/− T cells largely reflect differences in Myc:Max and Myc transcription targets (supplemental Figure 4A; FDR q = 0.002). Consistent with this hypothesis, there were significant increases and sustained levels of Myc protein in activated Crbn−/− vs Crbn+/+ total T cells and of Myc mRNA in activated Crbn−/− vs Crbn+/+ CD8+ T cells (Figure 5A-B). Myc is a master regulator of metabolic transcription programs44 and induces polyamine biosynthesis45 via transcriptional induction of Odc1, which is elevated in Crbn−/− T cells (Figure 3B; supplemental Figure 3G). Further, in activated T cells, Myc induces the expression of transporters and enzymes that direct glutamine catabolism and flux into polyamines,26,38,45 and provokes increases in cell size. Interestingly, Crbn−/− CD8+ T cells were significantly larger, based on forward scatter area, compared with Crbn+/+ CD8+ T cells (supplemental Figure 4B).
CRBN controls TE phenotype by altering the dynamic regulation of MYC. (A) Myc protein levels in activated Crbn+/+ and Crbn−/− T cells (denoted + and −) were determined by immunoblot analysis at the indicated intervals after stimulation with anti-CD3ε+anti-CD28. The expression shown is relative to levels of β-actin, and the data are representative of 4 independent experiments. Values indicate band density of the western blot. (B) Myc mRNA levels in Crbn+/+ and Crbn−/− CD8+ T cells after activation by anti-CD3ε+anti-CD28 for the times indicated. (C) Diagram of MYC:MAX pharmacological disruption and (D) the structures of 10074-G5, MYCMI-11, and MYCMI-6 MYC:MAX inhibitors used. (E-F) CD8+ T cells were stimulated with anti-CD3ε+anti-CD28 for 24 hours, with or without cotreatment with the indicated doses of 10074-G5 or with 30 μM MYCMI-11 or MYCI-6 MYC/MAX dimerization inhibitors. Levels of Odc1 (E), and the TE signature genes Tbx21, Eomes, Gzmb, and Ifng transcripts in Crbn+/+and Crbn−/− CD8+ T cells (F). All results are representative of at least 2 independent experiments. n.s., not significant; *P < .05; **P < .01; ***P < .001; ****P < .0001.
CRBN controls TE phenotype by altering the dynamic regulation of MYC. (A) Myc protein levels in activated Crbn+/+ and Crbn−/− T cells (denoted + and −) were determined by immunoblot analysis at the indicated intervals after stimulation with anti-CD3ε+anti-CD28. The expression shown is relative to levels of β-actin, and the data are representative of 4 independent experiments. Values indicate band density of the western blot. (B) Myc mRNA levels in Crbn+/+ and Crbn−/− CD8+ T cells after activation by anti-CD3ε+anti-CD28 for the times indicated. (C) Diagram of MYC:MAX pharmacological disruption and (D) the structures of 10074-G5, MYCMI-11, and MYCMI-6 MYC:MAX inhibitors used. (E-F) CD8+ T cells were stimulated with anti-CD3ε+anti-CD28 for 24 hours, with or without cotreatment with the indicated doses of 10074-G5 or with 30 μM MYCMI-11 or MYCI-6 MYC/MAX dimerization inhibitors. Levels of Odc1 (E), and the TE signature genes Tbx21, Eomes, Gzmb, and Ifng transcripts in Crbn+/+and Crbn−/− CD8+ T cells (F). All results are representative of at least 2 independent experiments. n.s., not significant; *P < .05; **P < .01; ***P < .001; ****P < .0001.
Given these phenotypes, to assess whether the superior metabolic phenotype of Crbn−/− CD8+ T cells was Myc dependent, we treated activated cells with a series of Myc:Max heterodimerization inhibitors46 at the time of activation (Figure 5C-D). As expected, treatment with these Myc:Max disrupters blocked the induction of the Myc target gene Odc1 in Crbn−/− CD8+ T cells (Figure 5E), as well as that of the glutamine transporters Slc38a1 and Slc1a5 and the polyamine biosynthetic enzymes Srm and Sms (supplemental Figure 4C). Interestingly, the effector gene signature of activated Crbn−/− CD8+ T cells, including Tbx21, Eomes, Gzmb, and Ifng, was also suppressed in a dose-dependent manner by treatment with these Myc:Max inhibitors (Figure 5F; supplemental 4D). Thus, the metabolic and TE signatures of activated Crbn−/− CD8+ T cells are Myc dependent.
Crbn deficiency augments T-cell activity in GVHD
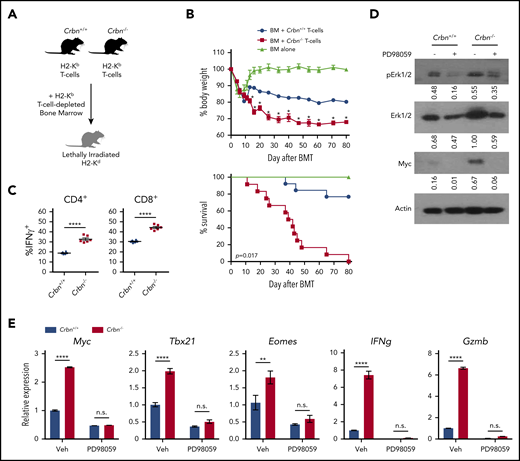
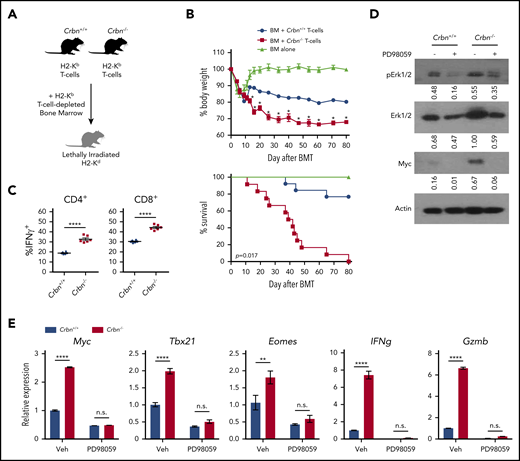
IM compounds are associated with exacerbated GVHD toxicity in patients with multiple myeloma who undergo allogeneic hematopoietic cell transplantation,47 which is most likely related to potentiated TE-cell functions. Moreover, alloreactive T cells that drive GVHD are metabolically reprogrammed.48 To assess the effects of Crbn deficiency on polyclonal T-cell activation in vivo in response to alloantigens, we used a lethal mouse model of GVHD, where lethally irradiated major histocompatibility complex–mismatched BALB/c (H2d) recipients are reconstituted with donor-derived C57Bl/6 (H2b) CD3+ T-cell–depleted bone marrow.49 After randomization, equal numbers of C57Bl/6 Crbn+/+ and Crbn−/− T cells were transferred into lethally irradiated recipient BALB/c mice (Figure 6A). Notably, recipients receiving Crbn−/− T cells displayed a rapid loss in body weight and quickly succumbed to GVHD, compared with recipients receiving Crbn+/+ T cells (Figure 6B; P = .017). Significantly higher percentages of CD4+ and CD8+ effector T cells expressing IFN-γ were evident in mice receiving Crbn−/− T cells 14 days after transplantation (Figure 6C), yet Crbn−/− and Crbn+/+ donor cells had a similar number of T cells expressing the proinflammatory cytokine IL-17 (supplemental Figure 5A), which can provoke tissue toxicity.50 Moreover, the number of T cells producing another cytokine marker of acute GVHD,51 IL-5 (supplemental Figure 5A), were similar on day 14 after bone marrow transplantation.
CRBN controls TE phenotype and harnesses GVHD pathogenesis. (A) Schematic of GVHD experiments. (B) Effects of GVHD in a model of BALB/c mice receiving C57Bl/6 T-cell–depleted bone marrow, with and without Crbn+/+ or Crbn−/− T cells (H2b) after lethal body irradiation. The percentage of body weight (top) and survival (bottom) of recipient BALB/c H2d mice was monitored at the indicated intervals. (C) The percentage of IFN-γ–producing CD4+ and CD8+ T cells in donor Crbn+/+ or Crbn−/− T cells derived from the GVHD model after restimulation with phorbol myristate acetate and ionomycin ex vivo on day 14 after transplantation. (D) pERK1/2, total ERK1/2, and Myc protein levels, as determined by western blot analysis in Crbn+/+ and Crbn−/− CD8+ T cells, with or without 25 μM PD98059 24 hours after activation with anti-CD3ε+anti-CD28. (E) qRT-PCR analysis of Myc, Tbx21, Eomes, Ifng, and Gzmb mRNA levels in Crbn+/+ vs Crbn−/− CD8+ T cells 24 hours after activation with anti-CD3ε+anti-CD28+/− cotreatment with 25 μM PD98059. All results are representative of at least 2 independent experiments. n.s., not significant; *P < .05; **P < .01; ****P < .0001.
CRBN controls TE phenotype and harnesses GVHD pathogenesis. (A) Schematic of GVHD experiments. (B) Effects of GVHD in a model of BALB/c mice receiving C57Bl/6 T-cell–depleted bone marrow, with and without Crbn+/+ or Crbn−/− T cells (H2b) after lethal body irradiation. The percentage of body weight (top) and survival (bottom) of recipient BALB/c H2d mice was monitored at the indicated intervals. (C) The percentage of IFN-γ–producing CD4+ and CD8+ T cells in donor Crbn+/+ or Crbn−/− T cells derived from the GVHD model after restimulation with phorbol myristate acetate and ionomycin ex vivo on day 14 after transplantation. (D) pERK1/2, total ERK1/2, and Myc protein levels, as determined by western blot analysis in Crbn+/+ and Crbn−/− CD8+ T cells, with or without 25 μM PD98059 24 hours after activation with anti-CD3ε+anti-CD28. (E) qRT-PCR analysis of Myc, Tbx21, Eomes, Ifng, and Gzmb mRNA levels in Crbn+/+ vs Crbn−/− CD8+ T cells 24 hours after activation with anti-CD3ε+anti-CD28+/− cotreatment with 25 μM PD98059. All results are representative of at least 2 independent experiments. n.s., not significant; *P < .05; **P < .01; ****P < .0001.
Histopathological analyses of skin, colon, and liver confirmed pathology consistent with GVHD49 in mice receiving both Crbn+/+ and Crbn−/− T cells (supplemental Figure 5B). Because GVHD can be influenced by altered lymphopenia-associated proliferation and activation,28 T cells from Crbn+/+ and Crbn−/− littermates were adoptively transferred into sublethally irradiated syngeneic mice. The division index of CD4+ and CD8+ T cells and splenocyte numbers were equally distributed in mice receiving Crbn+/+ vs those receiving Crbn−/− T cells, suggesting no differences in persistence after homeostatic expansion (supplemental Figure 5C-F). Moreover, both populations of naïve T cells that proliferated in response to acute, transient lymphopenia acquired the characteristic conversion to a memory-like T-cell phenotype at the same rate28 (supplemental Figure 5G-H).
In patients who undergo hematopoietic stem cell transplantation, the amount of activating protein 1 (AP-1), a leucine zipper transcription factor complex composed of c-Fos:c-Jun heterodimers, is an important determinant of GVHD severity.52 In our work, GSEA for transcriptional drivers revealed enrichment of AP-1 transcriptional activity in activated Crbn−/− CD8+ T cells (supplemental Figure 4A). One study has shown that extracellular-regulated kinase (ERK) activation, AP-1 induction, and expression of the activation marker CD69 are linked processes.53 Moreover, MEK inhibitors selectively suppress alloreactivity and GVHD pathology.54,55 Notably, activated Crbn−/− CD8+ T cells had a 50% increase in total ERK1/2 vs Crbn+/+ T cells (Figure 6D). Further, treatment with the selective MEK inhibitor PD98059 effectively suppressed the increases in total and phospho-ERK1/2 manifested in activated Crbn−/− CD8+ T cells and completely abolished the high levels of Myc protein and mRNA and the effector genes Tbx21, Eomes, Gzmb, and Ifng in activated Crbn−/− T cells (Figure 6D-E). These findings are consistent with a model wherein CRBN harnesses an ERK1/2-to-AP-1/Myc pathway after activation of CD8+ T cells to dampen TE phenotypes.
IM compounds induce MYC and MYC-dependent phenotypes in human CD8+ T cells
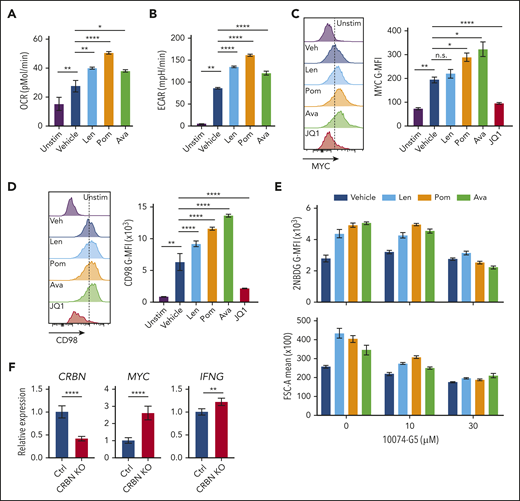
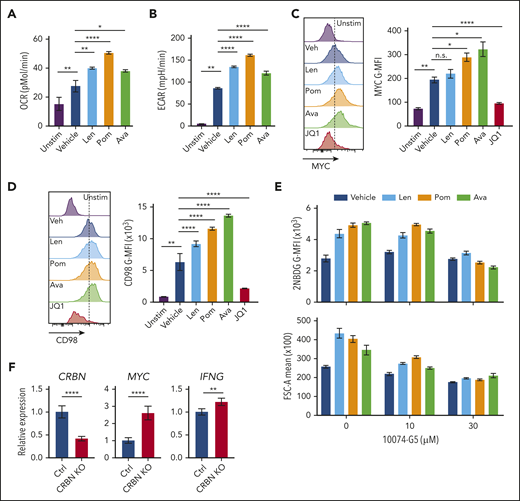
Putative mechanisms for IM compounds include dual activity via neosubstrate degradation and target binding interference, which would downregulate and upregulate IM target proteins, respectively.10 Currently, there are no known endogenous proteins or pathways linked to the T-cell phenotypes provoked by IM compounds.10 To test whether IM compounds affect the CRBN-MYC circuit, activated human CD4+ and CD8+ T cells from healthy human donors were treated with the IM compounds lenalidomide, pomalidomide, and CC-122 (avadomide). Similar to previous studies in which lenalidomide and pomalidomide were used,56-59 treatment of human CD8+ T cells with avadomide7 significantly increased IFN-γ secretion, especially in cells stimulated with low levels of anti-CD3ε and anti-CD28 (supplemental Figure 6A). All 3 IM compounds augmented the metabolism of activated CD8+ T cells, including increased OCR (Figure 7A) and ECAR (Figure 7B), and all 3 suppressed the levels of IKAROS in CD8+ T cells (supplemental Figure 6B). Notably, MYC protein levels in these T cells, as measured by mean fluorescence intensity (MFI), were significantly increased by treatment with the IM compounds (Figure 7C; supplemental Figure 6C). Further, the expression of CD98 (Figure 7D), glucose uptake, and cell size (Figure 7E) were also augmented in activated human CD8+ T cells after IM treatment (supplemental Table 5), and treatment-induced 2-NDBG uptake and cell size were effectively blocked by cotreatment with the MYC:MAX inhibitor 10074-G5 (Figure 7F; supplemental Table S5). Finally, CRISPR (clustered regularly interspaced short palindromic repeats)/cas9directed knockdown of CRBN expression in primary human CD8+ T cells provoked increases in MYC and IFNg expression after activation (Figure 7F; supplemental Figure 6D). Thus, IM compound treatment or CRBN knockdown in activated human CD8+ T cells drives a superior TE phenotype that resembles mouse Crbn−/− CD8+ T cells.
Targeting CRBN augments human CD8+ T-cell bioenergetics and MYC expression. OCRs (A) and ECARs (B) in activated human CD8+ T cells treated with vehicle or IM compounds for 5 days, as indicated, at a 10-µM dose of lenalidomide (Len), pomalidomide (Pom), and avadomide (Ava). (C) MYC protein levels in unstimulated (Unstim) and anti-CD3+anti-CD28–activated human CD8+ T cells treated with IM compounds (Len, Pom or Ava; 10 µM) for 5 days as detected by flow cytometry. JQ1 (a BET inhibitor) was used to show staining specificity for MYC in these experiments. (D) CD98 surface expression in activated human CD8+ T cells treated with IM compounds for 5 days. (E) Glucose uptake (top) and cell size (bottom) of activated (treated with anti-CD3+anti-CD28) human CD8+ T cells treated with IM compounds, with or without the MYC/MAX dimerization inhibitor 10074-G4, as measured using the fluorescent glucose analogue 2-NBDG (top) or forward scatter area (FSC-A, bottom) by flow cytometry. (F) Resting CD8+ T cells, enriched from healthy donor peripheral blood mononuclear cell (PBMCs), and complexed ribonucleoproteins (CRBN gRNAs+CAS9) were mixed with 4 × 10⁶ CD8+ T cells, resuspended in primary cell solution, and nucleoporated. After nucleoporation, the cells were rested for 48 hours and then activated with anti-CD3+anti-CD28. After 5 days, the cells were assessed for levels of CRBN, MYC, and IFNg mRNA vs B2M transcripts by qRT-PCR. All results are representative of at least 2 independent experiments (excluding the CRISPR experiments). For statistical comparisons, see supplemental Table 5. n.s., not significant; *P < .05; **P < .01; ****P < .0001.
Targeting CRBN augments human CD8+ T-cell bioenergetics and MYC expression. OCRs (A) and ECARs (B) in activated human CD8+ T cells treated with vehicle or IM compounds for 5 days, as indicated, at a 10-µM dose of lenalidomide (Len), pomalidomide (Pom), and avadomide (Ava). (C) MYC protein levels in unstimulated (Unstim) and anti-CD3+anti-CD28–activated human CD8+ T cells treated with IM compounds (Len, Pom or Ava; 10 µM) for 5 days as detected by flow cytometry. JQ1 (a BET inhibitor) was used to show staining specificity for MYC in these experiments. (D) CD98 surface expression in activated human CD8+ T cells treated with IM compounds for 5 days. (E) Glucose uptake (top) and cell size (bottom) of activated (treated with anti-CD3+anti-CD28) human CD8+ T cells treated with IM compounds, with or without the MYC/MAX dimerization inhibitor 10074-G4, as measured using the fluorescent glucose analogue 2-NBDG (top) or forward scatter area (FSC-A, bottom) by flow cytometry. (F) Resting CD8+ T cells, enriched from healthy donor peripheral blood mononuclear cell (PBMCs), and complexed ribonucleoproteins (CRBN gRNAs+CAS9) were mixed with 4 × 10⁶ CD8+ T cells, resuspended in primary cell solution, and nucleoporated. After nucleoporation, the cells were rested for 48 hours and then activated with anti-CD3+anti-CD28. After 5 days, the cells were assessed for levels of CRBN, MYC, and IFNg mRNA vs B2M transcripts by qRT-PCR. All results are representative of at least 2 independent experiments (excluding the CRISPR experiments). For statistical comparisons, see supplemental Table 5. n.s., not significant; *P < .05; **P < .01; ****P < .0001.
Discussion
Targeting CRBN in activated mouse and human CD8+ T cells, either via genetic means or through small-molecule treatment, generates a robust metabolic, hyperactive CD8+ TE phenotype that has enhanced activity in a validated model of GVHD and enhanced antitumor activity in a syngeneic melanoma tumor model. These findings suggest that targeting CBRN would augment the antitumor activity of the immune checkpoint, tumor-infiltrating leukocytes, and/or chimeric antigen receptor–T-cell therapeutic strategies, but enhance the severity of GVHD in transplantation settings. In support of the latter, CD98 signaling56 and anaplerosis of alloreactive T cells57 have been implicated in GVHD severity, and these responses appear to be harnessed by CRBN.
CRBN has been reported to control metabolism in other cell types, by directing degradation of glutamine synthetase (GS)60 via interactions with acetylated lysines of GS that are triggered by high intracellular glutamine concentrations and by CRBN-directed suppression of the activity of the α1 subunit of AMP-activated protein kinase (AMPKa1),61 a regulator of energy homeostasis. Further, CRBN binds to the CD147-SLC16A1 (MCT1) lactate transporter complex in multiple myeloma cells, and IM drug binding destabilizes this complex, contributing to its antineoplastic activity in this malignancy.19
Our studies established the striking finding that CRBN harnesses CD8+ T-cell metabolism downstream of the MEK/ERK signaling pathway, which is necessary for the induction of Myc after TCR engagement. The control of Myc by CRBN is entirely novel and is highly significant in T-cell biology, as Myc functions as a master regulator of T-cell activation and metabolism26 and also controls asymmetric division of T cells into effector vs memory cell fates.62,63 Notably, Green and colleagues26 have shown that Myc augments metabolism and enables the proliferation of CD4+ and CD8+ T cells via transcriptional reprogramming that includes induction of enzymes that direct glycolysis, glutaminolysis, and polyamine biosynthesis. Consistent with high Myc activity, Crbn-deficient activated mouse CD8+ T cells and human CD8+ T cells treated with IM compounds exhibit increased levels of MYC, and in T cells, this leads to enhanced nutrient uptake, NAD+/NADH ratios, glycolytic rates, and basal and reserve capacity for OXPHOS. Further, MYC function is necessary to sustain the hypermetabolic phenotype of activated mouse and human CD8+ T cells, as these are cancelled by treatment with validated inhibitors of MYC:MAX function.46,64 Thus, a CRBN-MYC circuit controls the magnitude of antigen-specific activation of CD8+ T cells and drives a hyperactive TE-cell fate.
MYC expression is controlled by several means, including mRNA decay,65 ubiquitin-mediated protein turnover by DDB1-Cul4A-TRUSS66,67 (evident using the EGFP-MYC reporter), and microRNA and long noncoding RNA regulation,68-70 transcription,71 and translation.72 Thus, the control of Myc mRNA and protein levels in activated T cells and by CRBN in this context, is likely to be very complex. What is known is that Myc mRNA induction involves an increase in both transcription initiation and a release from an elongation block.73 Intriguingly, translational regulation of Myc also includes a polyamine-directed pathway,74 which we have shown is highly elevated in Crbn-deficient T cells that rely on polyamine biosynthesis to sustain their hyperactive phenotype. In our study, a primary regulator of Myc mRNA and protein expression was MEK/ERK signaling, which is interesting, given the established roles of MEK/ERK activation in the control of both acute and chronic GVHD.54,55,75 Precisely how CRBN harnesses MEK/ERK1 signaling and how this then sustains high levels of Myc expression in activated CD8+ T cells is not yet clear, but it represents an important area for future investigation, along with studies that resolve how TCR signaling dynamically controls the expression of CRBN itself.
Notably, T-bet expression is increased 7- to 12-fold in activated Crbn−/− CD8+ T cells, which is consistent with their cytokine production profile, gene signature, and metabolic phenotypes. Germane to our study, high T-bet and its induction of IFN-γ are critical determinants of acute GVHD50 and suggest that impaired CRBN function contributes to poor clinical outcomes. This, and the augmented antitumor phenotype of Crbn−/− CD8+ T cells, suggests the CRBN-MEK/ERK-Myc circuit (supplemental Figure 7), which augments, sustains, and drives an antigen-specific T-cell phenotype, could have far-reaching clinical applications. Important future translational studies include those that will assess the anticancer efficacy of targeting CRBN in maintenance of graft versus leukemia, and in improving the efficacy of a broad spectrum of immune checkpoint and adoptive cell therapies.
The data reported in this article have been deposited in the Gene Expression Omnibus database (accession number GSE81725).
The online version of this article contains a data supplement.
The publication costs of this article were defrayed in part by page charge payment. Therefore, and solely to indicate this fact, this article is hereby marked “advertisement” in accordance with 18 USC section 1734.
Acknowledgments
The authors thank Dalia Ercan; the staffs of the Proteomics and Metabolomics, Flow Cytometry, Molecular Genomics, Cancer Informatics, and Chemical Biology Cores of the Moffitt Cancer Center; the Moffitt/University of South Florida Comparative Medicine Program; and the University of South Florida (USF) Health Lisa Muma Weitz Laboratory for Advanced Microscopy and Cell Imaging.
This work was supported by a National Natural Science Foundation of China grant (81702268) (Y.H.); a Natural Science Foundation of Tianjin grant (18JCYBJC93400) (Y.H.); a Sponsored Research Agreement with Celgene Corporation (N.J.L., P.K.E.-B.); the Cortner-Couch Endowed Chair for Cancer Research of the USF School of Medicine (J.L.C.); funds from Lesa France Kennedy (J.L.C.); a Leukemia and Lymphoma Society-Specialized Center of Research (LLS-SCOR) grant (J.L.C.); National Institutes of Health, National Cancer Institute (NCI) Center Core Support grant (P30-CA076292); funds from the State of Florida to the Moffitt Cancer Center and Research Institute; the NCI in conjunction with a Career Enhancement Award from the Moffitt Skin Cancer Specialized Programs of Research Excellence (SPORE) grant (P50CA168536) (P.K.E.-B.); a NCI Research Specialist award (R50CA211447) (H.R.L.); an NCI National Research Service Award (F32CA203217) (M.R.F.); and a research grant from Celgene Corporation to the Moffitt Cancer Center and Research Institute.
Authorship
Contribution: R.S.H., M.S.B., and Y.H. contributed equally to the discovery of the new concepts presented in this manuscript; R.S.H., J.L.C., and P.K.E.-B. designed the research plan, performed the experiments, analyzed and interpreted the data, and prepared the manuscript; M.R.F., A.A.A., W.E.G., C.Y., A.Y.A., S.C., J.M.M., A.W.M., J.M.R.B., C.M.C., and L.Y. performed the experiments, analyzed and interpreted the data, and prepared the figures; J.M.K., L.N.D., and T.J.G. performed the metabolomics studies; X.-Z.Y. designed the experiments and assisted with the studies of GVHD; J.F. assisted with the GVHD model design and data analysis; M.A. and S.Y.Y. synthesized the chemicals; H.R.L. and N.J.L. provided concept design for synthesis of key chemical reagents, interpreted the results, and helped in the preparation of the article; S.R. and R.J.G. participated in concept design and provided specialized research expertise in metabolomics; Y.H. performed the GVHD experiments; K.J. and J.M. provided the pathology analysis for the GVHD model; X.R. provided financial support through an integrated Moffitt research alliance; A.M.R. provided key reagents and expertise; J.L.C. and P.K.E.-B. shared equally in manuscript preparation and designed the research plan, performed the data analysis, and interpreted the results, and took responsibility for all aspects of the work; and all authors reviewed and agreed to the publication of the data.
Conflict-of-interest disclosure: J.M.M. was a salaried employee of Celgene Corporation, but was a graduate student in the Cancer Biology PhD program at the time of her involvement in this study. N.J.L., H.R.L., P.K.E.-B., and the Moffitt Cancer Center and Research Institute received payment from licensing unrelated technology to Celgene Corporation and have an appropriate conflict-of-interest management plan. The remaining authors declare no competing financial interests.
The current affiliation for M.A. is the Department of Chemistry Quaid-e-Azam University, Islamabad, Pakistan.
Correspondence: John L. Cleveland, Department of Tumor Biology, H. Lee Moffitt Cancer Center and Research Institute, 12902 Magnolia Dr, Tampa, FL 33612; e-mail: john.cleveland@moffitt.org.
REFERENCES
Author notes
R.S.H., M.S.B., and Y.H. contributed equally to this study.

