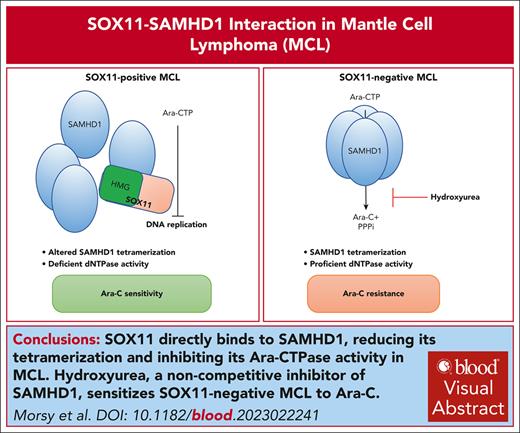
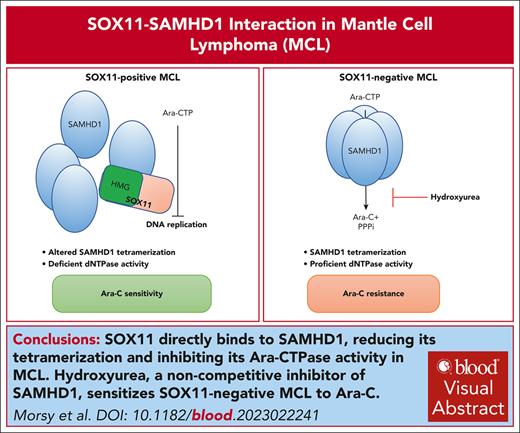
SOX11 directly binds, via its HMG domain, to SAMHD1, reducing its tetramerization and inhibiting its ara-CTPase activity in MCL.
The noncompetitive inhibitor of SAMHD1, hydroxyurea, sensitizes SOX11− MCL to ara-C.
Visual Abstract
Sterile alpha motif and histidine-aspartate (HD) domain–containing protein 1 (SAMHD1) is a deoxynucleoside triphosphate triphosphohydrolase with ara-CTPase activity that confers cytarabine (ara-C) resistance in several hematological malignancies. Targeting SAMHD1’s ara-CTPase activity has recently been demonstrated to enhance ara-C efficacy in acute myeloid leukemia. Here, we identify the transcription factor SRY-related HMG-box containing protein 11 (SOX11) as a novel direct binding partner and first known endogenous inhibitor of SAMHD1. SOX11 is aberrantly expressed not only in mantle cell lymphoma (MCL), but also in some Burkitt lymphomas. Coimmunoprecipitation of SOX11 followed by mass spectrometry in MCL cell lines identified SAMHD1 as the top SOX11 interaction partner, which was validated by proximity ligation assay. In vitro, SAMHD1 bound to the HMG box of SOX11 with low-micromolar affinity. In situ crosslinking studies further indicated that SOX11-SAMHD1 binding resulted in a reduced tetramerization of SAMHD1. Functionally, expression of SOX11 inhibited SAMHD1 ara-CTPase activity in a dose-dependent manner resulting in ara-C sensitization in cell lines and in a SOX11-inducible mouse model of MCL. In SOX11-negative MCL, SOX11-mediated ara-CTPase inhibition could be mimicked by adding the recently identified SAMHD1 inhibitor hydroxyurea. Taken together, our results identify SOX11 as a novel SAMHD1 interaction partner and its first known endogenous inhibitor with potentially important implications for clinical therapy stratification.
Introduction
Mantle cell lymphoma (MCL) is a rare and aggressive form of non-Hodgkin lymphoma, with a median overall survival of 5 years.1,2 Recently, several new therapeutic strategies including noncovalent Bruton tyrosine kinase inhibitors, bispecific antibodies, and next generation chimeric antigen receptor T-cell therapy have been developed and shown promising results in the relapsed/refractory settings.3,4
Intensified first-line regimens containing cytarabine (ara-C), followed by consolidating high-dose therapy and autologous stem cell transplantation (ASCT) have significantly improved treatment outcome of MCL.5,6 However, relapses occur after ASCT, and MCL remains incurable in most cases.7,8 High-dose ara-C confers durable response to rituximab-based immunochemotherapies and overcome resistance in younger and older patients with MCL.5,9,10
Response to ara-C is regulated by sterile alpha motif and histidine-aspartate (HD) domain–containing protein 1 (SAMHD1).11 SAMHD1 harbors a dNTP triphosphohydrolase activity that limits the availability of endogenous dNTPs during G1 phase of the cell cycle and in terminally differentiated cells.12,13 SAMHD1 also hydrolyzes the active triphosphate metabolite of cytarabine (ara-C) known as ara-CTP, limiting its intracellular concentration.11 SAMHD1 has been shown to be responsible for ara-C resistance in several hematological malignancies, including acute myeloid leukemia (AML).14,15 Accordingly, clinical outcome in ara-C–treated patients with AML is negatively correlated with SAMHD1 expression levels.15-17 Contrary to AML, no clear correlation of SAMHD1 expression and ara-C responses could be identified in MCL,18,19 suggesting the existence of SAMHD1-modulating factors in MCL.
The transcription factor SRY-related high-mobility group (HMG)-box containing protein 11 (SOX11), a member of the C family of SOX proteins,20 is expressed in the majority of conventional MCL (cMCL) cases21-23 and a subset of Burkitt lymphomas.24 SOX11 is not expressed in normal B cells and does not have a known function dedicated to B-lymphopoiesis.25-27 Several lines of evidence have reported an oncogenic role for SOX11 in MCL pathogenesis through the regulation of gene expression2,28-31 and augmentation of aberrant B-cell receptor signaling.32 Aberrant expression and context-specific oncogenic functions of SOX11 have also been described in carcinomas including breast and lung cancers.20,33-35 However, the interactome of the SOX11 protein is largely unknown.
Here, we demonstrate that SOX11 directly binds to SAMHD1 via its HMG domain, reduces SAMHD1 tetramerization, impairs the ara-CTPase activity of SAMHD1, and confers enhanced sensitivity to ara-C in MCL, both in vitro and in vivo models.
Methods
Cell lines and culture
The MCL cell lines Granta-519, JeKo-1 and JVM-2 were purchased from the German Collection of Microorganisms and Cell Cultures (DSMZ, Braunschweig, Germany). Rec1 was a kind gift from Christian Bastard. Cells were cultured in RPMI 1640-Glutamax (Gibco, Life Technologies, Paisley, United Kingdom), supplemented with 10% heat-inactivated fetal bovine serum (Gibco, Life Technologies) and 50 μg/mL gentamicin (Gibco, Life Technologies), maintained at 37°C and 5% CO2, and split every 3 days to a density of 0.5 × 10⁶ cells per mL. Doxycycline-inducible JVM-2 cells ectopically overexpressing SOX11 (JVM-2iSOX11) and its control (JVM-2vector) were also included in this study (see also supplemental Information, available on the Blood website).
Ethical approval
The study was performed in accordance with the Declaration of Helsinki, including informed patient consent, and was approved by the Ethical Committee in Stockholm (2018/2182–32). Animal experiments were approved by the regional animal ethics committee of Stockholm County (approval 13820-2019) in accordance with the Animal Protection Law (SFS1988:534), the Animal Protection Regulation (SFS 1988:539), and the Regulation for the Swedish National Board for Laboratory Animals (SFS1988:541).
Primary MCL cells
Cryo-preserved cells taken from diagnostic samples of patients with MCL from our recent study19 were used for SOX11-SAMHD1 colocalization by proximity ligation assay (PLA). Three samples with high lymphoma cell purity (>90% of MCL cells) were selected for ara-C treatment and labeled as PS1-3. For details, see supplemental Table 1.
Genetic silencing of SOX11 by siRNA
Small interfering RNA (siRNA) experiments were performed using predesigned siRNA against SOX11 (4392420, Ambion), and scramble nontargeting siRNA (4390844, Ambion) was used as negative control. Granta519 and JeKo-1 cells were maintained at a density of 0.5 × 10⁶ cells per mL 24 hours before transfection with siRNAs. The desired number of cells to be transfected was resuspended in 100 μL of nucleofection reagents supplied by Amaxa Cell line Nucleofector kit C (VCA-1004, Lonza), containing a 1 μM concentration of the respective siRNA, electroporated using an Amaxa machine, program X-01, immediately fed by warm RPMI 1640 containing 20% fetal bovine serum, and maintained at 37°C and 5% CO2 for 48 hours.
Virus-like particle (VLP)-mediated depletion of SAMHD1
The ablation of SAMHD1 at the protein level was carried out using inactivated VLPs including Vpx, which targets SAMHD1 for ubiquitin-mediated proteolysis. The VLPs were provided and prepared as previously described17 and the references therein. A nontargeting particle (dX) was used as a negative control. The efficiency of SAMHD1 depletion was validated by western blotting as described below.
Treatment
Cytosine-β-d-arabinofuranoside (C1768-100MG) was purchased from Sigma and dissolved in RPMI 1640 into a final concentration of 10 mg/mL. Hydroxyurea (HU) (H8627) purchased from Sigma was also used in combination with cytarabine (see supplemental Information).
Cell cycle analysis
Analysis of the cell cycle was performed using a propidium iodide flow cytometry kit (ab139418, Abcam, Amsterdam, The Netherlands), according to the manufacturer’s protocol (see supplemental Information)
Western blotting
Protein expression was measured by performing western blotting using total cell lysates from siRNA-transfected, Vpx-treated, SOX11-induced, or ara-C–treated cell lines as previously described.19 Blots were developed using Western Lightning Plus ECL, Enhanced Chemiluminescence Substrate (NEL104001EA), and visualization and semiquantification were performed using a LiCOR machine and Odyssey software, respectively. For reprobing purposes, membranes were stripped using Restore Western Blot Stripping Buffer (Thermo Fisher, catalog no. 21059). Information regarding manufacturer and dilution for all antibodies can be found in supplemental Table 2.
Crosslinking and native gel electrophoresis
To assess tetramerization of SAMHD1, both JVM-2vector and JVM-2iSOX11 cultured in doxycycline-supplemented media were crosslinked with a disuccinimidyl glutarate (Thermo Fisher, catalog no. 20593) at the concentrations 5, 2.5, 1.25, 0.625 and 0.312 mM for 30 minutes at room temperature as described in a study by Rudd et al.36 Crosslinking was quenched by addition of 1 M Tris, pH 8, for 30 minutes at room temperature. Crosslinked cell pellets were washed twice with phosphate-buffered saline (1×) and resuspended in RIPA buffer supplemented with protease- and phosphatase-inhibitor cocktail. Samples were quantified and mixed with Laemmli buffer free of β-mercaptoethanol, and boiling was omitted before electrophoresis using NuPAGE 4% to 12% Bis-Tris gels (NP0321BOX, Invitrogen). The rest of the western blot procedure was performed as described above.
Heterotopic JVM-2 animal model
Female NMRI nu/nu mice aged 45 days (BomTac: NMRI-Foxn1nu, Taconic) were housed with 8 mice per cage and given sterile water and food ad libitum. Sample size was estimated to be 6 animals per group in a total of 8 groups for a power of 0.8 and a significance level of 0.05, estimating a hypothetical mean difference in survival of 50% and a standard deviation of 30%. A surplus of 2 mice per group was used to account for possible xenotransplant failures or other unexpected occurrences. Conditions were first tested in a pilot experiment, with the timing of drug injection determined to be day 5 after cell injection, corresponding to the time when the animals reached a tumor volume of 150 mm3.
Co-IP and mass spectrometry
Coimmunoprecipitation (Co-IP) was performed using Granta519 and JeKo1 cells crosslinked (2 × 10⁷ cells per sample) in 11% formaldehyde solution (11% formaldehyde, 0.1 M NaCl, 1 mM EDTA, 0.5 mM EGTA, 50 mM HEPES (N-2-hydroxyethylpiperazine-N′-2-ethanesulfonic acid), and pH 8). Detailed protocol for Co-IP, sample preparation for mass spectrometry, LC-ESI-LTQ-Orbitrap analysis, and peptide and protein identification are explained in supplemental Information. The following steps were used to define SOX11 interacting proteins: (1) filter out protein identifications in any of the 6 IgG control pull downs (3 replicates in each cell line); (2) keep potential SOX11 interacting proteins with identification in all 3 replicates in either or JeKo-1 or Granta; and (3) require the mean number of peptide spectrum matches in the 3 replicates of JeKo-1 or Granta to be >2 peptide spectrum matches.
Cell viability assay
Cell viability was assessed using the CellTiter 96 AQueous One Solution Cell Proliferation Assay (MTS) (Promega). For 1 test, 20 μL of MTS solution was added to 100 μL of the cultured cells and kept at conditions of 37°C and 5% CO2 for 3 hours, and absorbance at 490 nm was measured using a ClarioStar reader (BMGlabtech). Viability values were calculated by normalizing absorbance of treated cell to the absorbance of their respective untreated controls.
For assessing the response of induced JVM-2 cells with different concentrations of doxycycline to cytarabine, we used the CellTiter-Glo Luminescent Cell Viability Assay (Promega). For each test, 50 μL of CellTiter-Glo reagent was added to an equal volume of cell suspension in 96-well plate and kept on a plate shaker for 20 minutes at room temperature to allow cell lysis. Luminescence was measured using a ClarioStar reader.
HPLC-MS/MS assay for measurement of intracellular dNTPs and ara-CTP
Both JVM-2vector and JVM-2iSOX11 treated with 10 μM ara-C for 24 hours were collected, washed with phosphate-buffered saline, and lysed in 65% methanol at 95°C for 3 minutes. Lysed samples were centrifuged at 13 000 rounds per minute; and supernatants underwent speed vacuum dry for subsequent chromatography–tandem mass spectrometry method.37 High-performance liquid chromatography/mass spectrometry (HPLC-MS/MS) is described elsewhere.36
Immunocytochemistry and PLA
Immunofluorescence staining was performed on 4% paraformaldehyde-fixed and 0.1% Triton X-100–permeabilized cells on Superfrost Plus adhesion slides (Thermo Fisher), followed by confocal microscopy imaging. Duolink in situ PLA was performed using a DUO92008 kit (Merck). See the “Methods” section of the supplemental Information for further details.
Cellular thermal shift assay
To assess the shift of thermal aggregation temperature of SAMHD1 upon SOX11 overexpression, 1 × 10⁶ JVM-2vector and JVM-2iSOX11 cells were collected and resuspended in 60 μL of Tris-buffered saline buffer (pH 7.5). Cell suspensions were heated at a range of temperature 38, 42, 48, 52, 55, and 60°C for 3 minutes, followed by a 3-minute incubation at room temperature. Cells were then lysed by 3 freezing/thawing cycles. Each cycle comprised 3 minutes on dry ice, followed by 3-minute incubation in a water bath at 37°C. Total protein was quantified by Bradford assay and the procedure of western blot was performed as described above. Band intensities of SAMHD1 at the different conditions were normalized to the respective band intensities of the thermostable superoxide dismutase-1 and the percentage of remaining proteins were calculated and plotted to sigmoidal Boltzmann curve using GraphPad (La Jolla, CA) software.
MST
Binding of SOX11 HMG to SAMHD1 was measured using microscale thermophoresis (MST). Experiments were performed in 25 mM HEPES (pH 8.0), 150 mM NaCl, 5 mM MgCl2, 5 mM dithiothreitol, 0.02% Tween 20, and 0.1 mg/mL bovine serum albumin in standard capillaries on a Monolith NT.115. Fluorescence was observed using the Nanotemper His-Tag Red-Tris-NTA at 25 nM bound to SAMHD1H215A(1-626) at 100 nM for 10 seconds at 80% MST power and 80% LED power. See the “Methods” section of the supplemental Information for further details.
Confocal imaging
Imaging was performed using a Nikon A1R confocal laser scanning microscope equipped with a Nikon Eclipse Ti-E inverted microscope. Laser lines used were 405 nm (DAPI [4′,6-diamidino-2-phenylindole]), 488 nm (fluorescein isothiocyanate [FITC]) and 561 nm (tetramethyl rhodamine isothiocyanate [TRITC]). Images were captured with the imaging software NIS-Elements version 5.30.02. Fluorophores used in this study were FITC and TRITC and DAPI and Texas Red. The aperture size (pinhole) of objective lenses was set at 1.2. Images were captured at a magnification of 100× for PLA. For details about image analysis, see the supplemental Information.
Statistical analysis
Statistical analysis was performed using Graph Prism version 6 (GraphPad). The experiments were conducted in at least 2 independent biological replicates, and the data were represented as mean ± the standard error of the mean with 95% confidence intervals.
ZIP synergy analysis
After determining full dose-response curves for each drug, drug-drug interaction of drug combinations was determined using a zero interaction potential (ZIP) algorithm, which determines the degree of combination synergy or antagonism between drug combinations by comparing observed response against the expected response that assumes no interaction between drugs.38
Results
SOX11 directly binds to SAMHD1 in MCL
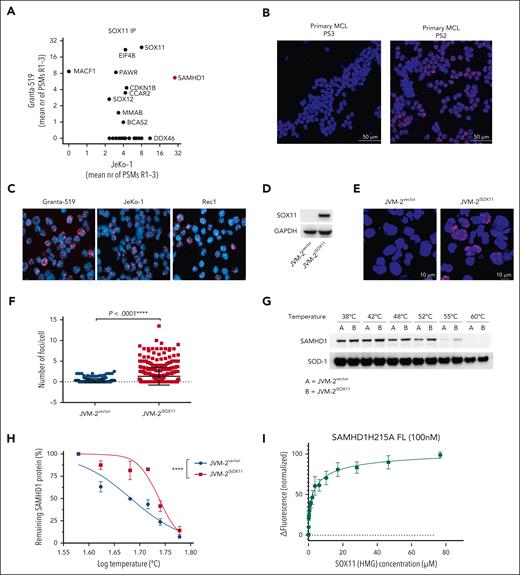
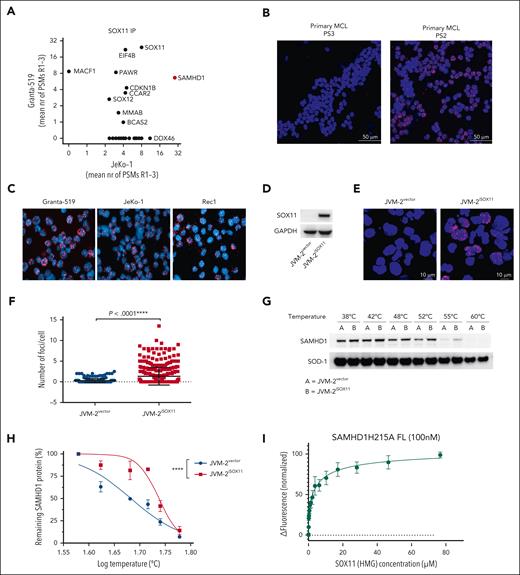
To identify potential interaction partners of SOX11, we performed coimmunoprecipitation of nuclear SOX11 in 2 well-characterized SOX11+ MCL cells lines, Granta-519 and JeKo-1, and analyzed the recovered proteins by HPLC/MS (supplemental Figure 1A). SAMHD1 was the top significant partner protein of SOX11 in both cell lines (Figure 1A; supplemental Figure 1B; see also supplemental Data Set 1). To validate a possible SOX11-SAMHD1 colocalization, we carried out an in situ PLA in cells of 3 primary MCL (PS1, PS2, and PS3) with different level of SOX11 expression (supplemental Table 1) as well as 3 SOX11+ MCL cell lines (Granta-519, JeKo-1 and Rec1) using SAMHD1 and SOX11 antibodies (Figure 1B-C; supplemental Figure 2A-D). To further validate specificity for SOX11, we ectopically expressed SOX11 in SOX11-inducible JVM-2iSOX11 cells (Figure 1D), derived from the SOX11− MCL cell line JVM-2. As expected, a positive PLA signal was seen only upon induction of SOX11 (Figure 1E-F; supplemental Figure 3A). Colocalization as assessed by confocal immunofluorescence microscopy was consistent with SOX11-SAMHD1 interaction (supplemental Figure 3B-C). Moreover, results of cellular thermal shift assays suggested physical interaction of SAMHD1 and SOX11, as evidenced by the shift of the thermal aggregation temperature of SAMHD1 from 41 to 54°C (Figure 1G-H) in the absence (JVM-2vector) or presence (JVM-2iSOX11) of SOX11, respectively. To address whether this interaction was direct, we performed MST with recombinant SAMHD1 and the HMG domain of SOX11. These experiments revealed direct binding of the SOX11-HMG domain to SAMHD1 with low micromolar affinity (KD = 3.2 ± 0.6 μM; Figure 1I). Collectively, these results suggest a direct interaction of SOX11 with SAMHD1.
SOX11 binds to SAMHD1 in MCL. (A) Identification of SOX11 protein interactors by mass spectrometry–based proteomics analysis of coimmunoprecipitation of SOX1 in Granta-519 and JeKo-1 cell lines. Three biological replicates were analyzed per cell line, and the mean number of peptide spectrum matches (PSMs) across the 3 replicates per protein are displayed on the axes. Proteins with 0 PSMs indicate absence of interaction in that cell line. See “Methods” for defining SOX11 interacting proteins. (B) PLA performed on 2 primary MCL cells with different SOX11 expression levels (supplemental Table 1) using rabbit polyclonal anti-SOX11 and mouse monoclonal anti-SAMHD1. The DAPI channel represents stained nuclei, whereas the red channel (TRITC) represents SOX11-SAMHD1 colocalization. Original magnification, 60×; scale bar, 50 μm; and the pinhole was set at 1.2. The red fluorescent foci represent the colocalization between SOX11 and SAMHD1. (C) PLA performed on Granta-519, JeKo-1, and Rec1 cells using rabbit polyclonal anti-SOX11 and mouse monoclonal anti-SAMHD1. Original magnification, 60×; and pinhole set at 1.2. (D) Representative western blot showing the efficiency of doxycycline-induced expression SOX11 in JVM-2vector and JVM-2iSOX11 at 72 hours after doxycycline treatment. SOX11 band is detected at 74 kDa and GAPDH at 37 kDa. (E) Representative images of PLA performed on JVM-2vector and JVM-2iSOX11 using rabbit polyclonal anti-SOX11 and mouse monoclonal anti-SAMHD1; original magnification, 60×; scale bar, 10 μm; and pinhole set at 1.2. Cells were treated with doxycycline 0.1 μM for 72 hours. (F) Scatterplot shows number of fluorescent foci per cell. The number of foci per cell were analyzed in total 350 cells of JVM-2vector or JVM-2iSOX11 using CellProfiler software. The data are represented as mean ± standard error of the mean (SEM) of 3 independent biological replicates. P < .0001 was calculated by unpaired, 2-tailed t test with Welch correction. (G) CETSA performed using JVM-2vector and JVM-2iSOX11 72 hours after treatment with 0.1 μM doxycycline. A representative western blot showing band intensities of SAMHD1 (71 kDa) and thermostable superoxide dismutase-1 (SOD-1) (20 kDa). (H) Sigmoidal Boltzmann curve of percentage of remaining SAMHD1 protein on y-axis and log10 temperature on x-axis. Data are represented as mean ± SEM of 3 independent biological replicates. ∗∗∗∗P < .0001; 2-way analysis of variance (ANOVA). (I) Binding of SOX11 HMG to SAMHD1 measured by MST. The fluorescence change in labeled SAMHD1 upon titration with SOX11 HMG is plotted; error bars are standard deviation of the mean values from 3 independent experiments. Fitting of the data to a hyperbolic binding isotherm gives KD = 3.2 ± 0.6 μM. CETSA, cellular thermal shift assay.
SOX11 binds to SAMHD1 in MCL. (A) Identification of SOX11 protein interactors by mass spectrometry–based proteomics analysis of coimmunoprecipitation of SOX1 in Granta-519 and JeKo-1 cell lines. Three biological replicates were analyzed per cell line, and the mean number of peptide spectrum matches (PSMs) across the 3 replicates per protein are displayed on the axes. Proteins with 0 PSMs indicate absence of interaction in that cell line. See “Methods” for defining SOX11 interacting proteins. (B) PLA performed on 2 primary MCL cells with different SOX11 expression levels (supplemental Table 1) using rabbit polyclonal anti-SOX11 and mouse monoclonal anti-SAMHD1. The DAPI channel represents stained nuclei, whereas the red channel (TRITC) represents SOX11-SAMHD1 colocalization. Original magnification, 60×; scale bar, 50 μm; and the pinhole was set at 1.2. The red fluorescent foci represent the colocalization between SOX11 and SAMHD1. (C) PLA performed on Granta-519, JeKo-1, and Rec1 cells using rabbit polyclonal anti-SOX11 and mouse monoclonal anti-SAMHD1. Original magnification, 60×; and pinhole set at 1.2. (D) Representative western blot showing the efficiency of doxycycline-induced expression SOX11 in JVM-2vector and JVM-2iSOX11 at 72 hours after doxycycline treatment. SOX11 band is detected at 74 kDa and GAPDH at 37 kDa. (E) Representative images of PLA performed on JVM-2vector and JVM-2iSOX11 using rabbit polyclonal anti-SOX11 and mouse monoclonal anti-SAMHD1; original magnification, 60×; scale bar, 10 μm; and pinhole set at 1.2. Cells were treated with doxycycline 0.1 μM for 72 hours. (F) Scatterplot shows number of fluorescent foci per cell. The number of foci per cell were analyzed in total 350 cells of JVM-2vector or JVM-2iSOX11 using CellProfiler software. The data are represented as mean ± standard error of the mean (SEM) of 3 independent biological replicates. P < .0001 was calculated by unpaired, 2-tailed t test with Welch correction. (G) CETSA performed using JVM-2vector and JVM-2iSOX11 72 hours after treatment with 0.1 μM doxycycline. A representative western blot showing band intensities of SAMHD1 (71 kDa) and thermostable superoxide dismutase-1 (SOD-1) (20 kDa). (H) Sigmoidal Boltzmann curve of percentage of remaining SAMHD1 protein on y-axis and log10 temperature on x-axis. Data are represented as mean ± SEM of 3 independent biological replicates. ∗∗∗∗P < .0001; 2-way analysis of variance (ANOVA). (I) Binding of SOX11 HMG to SAMHD1 measured by MST. The fluorescence change in labeled SAMHD1 upon titration with SOX11 HMG is plotted; error bars are standard deviation of the mean values from 3 independent experiments. Fitting of the data to a hyperbolic binding isotherm gives KD = 3.2 ± 0.6 μM. CETSA, cellular thermal shift assay.
SOX11 negatively regulates ara-CTPase activity of SAMHD1
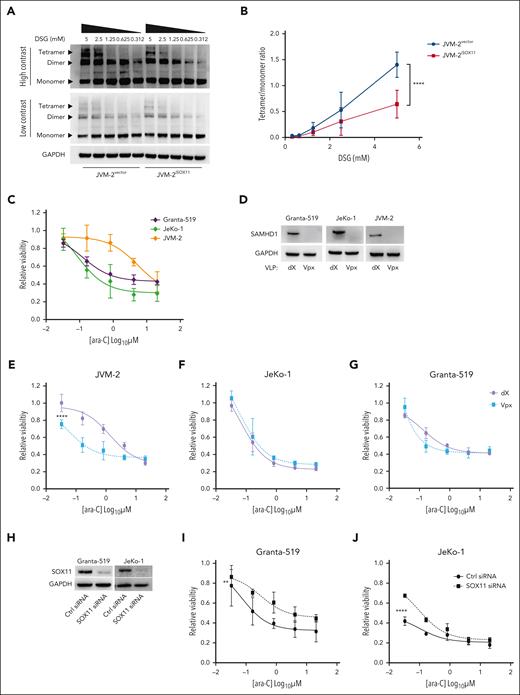
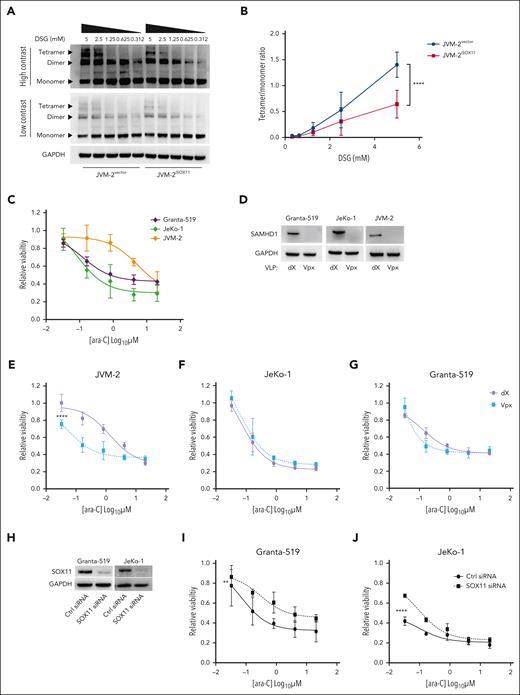
Because enzymatic activity of SAMHD1 requires allosterically regulated homo-tetramerization,39,40 we next investigated the effect of SOX11 on steady-state levels of SAMHD1 homo-oligomers. To this end, native gel electrophoresis of SAMHD1 in JVM-2iSOX11 after in situ crosslinking showed that SOX11 induction significantly reduced the SAMHD1 tetramer-to-monomer ratio (Figure 2A-B) (P < .0001). Hence, the SOX11-SAMHD1 interaction has direct effects on the SAMHD1 cellular quaternary configuration.
SOX11 impairs tetrameric configuration of SAMHD1 and confers ara-C sensitivity. (A) Representative western blot of native gel electrophoresis performed using disuccinimidyl glutarate (DSG)-crosslinked in JVM-2vector and JVM-2iSOX11 96 hours after treatment with 0.1 μM doxycycline. The tetrameric form of SAMHD1 is detected at a size of ∼250 kDa, dimer at ∼150 kDa, monomer at 71 kDa, and GAPDH at 37 kDa. (B) Curve shows tetramer/monomer ratio in crosslinked in JVM-2vector and JVM-2iSOX11 with different concentrations of DSG (related to panel A). Data are represented as mean ± SEM of 3 independent biological repeats. P value (2-tailed, 2-way ANOVA) is indicated on the curve. (C) Dose response curve for ara-C in Granta-519, JeKo-1, and JVM-2 treated for 72 hours by CellTiter MTS assay. The values on the y-axis represent the relative viability values, which were calculated by normalizing 100% values to respective untreated controls. Data are represented as mean ± SEM of 3 independent experiments. (D) Western blot showing the depleting efficiency of SAMHD1 by Vpx in the 3 cell lines compared to nontargeting dX. One representative western blot out of 3 is shown. Cells were treated with dX or Vpx for 3 hours before ara-C treatment and cultured thereafter for 72 hours before harvesting. SAMHD1 was detected at 71 kDa and GAPDH at 37 kDa. (E-G) Dose response curves for ara-C determined in JVM-2 (E), JeKo-1 (F) and Granta-519 (G) with Vpx or dX for 3 hours before ara-C treatment. Viability was measured by CellTiter MTS assay after 72 hours of ara-C treatment. The values on the y-axis represent the relative viability values which were calculated by normalizing absorbance value at each dose of ara-C for each condition to respective untreated controls. Data are represented as mean ± SEM of 3 independent biological replicates. P (2-tailed) was calculated using the 2-way ANOVA. ∗∗∗∗P < .0001. (H) Western blot showing the efficiency of SOX11 silencing in Granta-519 and JeKo-1 by siRNA for 48 hours. One representative western blot out of 2 is shown. SOX11 was detected at 74 kDa and GAPDH at 37 kDa. (I-J) Dose response curve for 72 hours of ara-C treatment in nontargeting control siRNA- and SOX11 siRNA-transfected Granta-519 (I) and JeKo-1 (J). ara-C treatment was applied 8 hours after transfection. Viability was measured using Celltiter MTS assay after 72 hours of ara-C treatment. Data are represented as mean ± SEM of 2 independent biological replicates. P (2-tailed) was calculated using 2-way ANOVA. ∗∗P < .01; ∗∗∗∗P < .0001.
SOX11 impairs tetrameric configuration of SAMHD1 and confers ara-C sensitivity. (A) Representative western blot of native gel electrophoresis performed using disuccinimidyl glutarate (DSG)-crosslinked in JVM-2vector and JVM-2iSOX11 96 hours after treatment with 0.1 μM doxycycline. The tetrameric form of SAMHD1 is detected at a size of ∼250 kDa, dimer at ∼150 kDa, monomer at 71 kDa, and GAPDH at 37 kDa. (B) Curve shows tetramer/monomer ratio in crosslinked in JVM-2vector and JVM-2iSOX11 with different concentrations of DSG (related to panel A). Data are represented as mean ± SEM of 3 independent biological repeats. P value (2-tailed, 2-way ANOVA) is indicated on the curve. (C) Dose response curve for ara-C in Granta-519, JeKo-1, and JVM-2 treated for 72 hours by CellTiter MTS assay. The values on the y-axis represent the relative viability values, which were calculated by normalizing 100% values to respective untreated controls. Data are represented as mean ± SEM of 3 independent experiments. (D) Western blot showing the depleting efficiency of SAMHD1 by Vpx in the 3 cell lines compared to nontargeting dX. One representative western blot out of 3 is shown. Cells were treated with dX or Vpx for 3 hours before ara-C treatment and cultured thereafter for 72 hours before harvesting. SAMHD1 was detected at 71 kDa and GAPDH at 37 kDa. (E-G) Dose response curves for ara-C determined in JVM-2 (E), JeKo-1 (F) and Granta-519 (G) with Vpx or dX for 3 hours before ara-C treatment. Viability was measured by CellTiter MTS assay after 72 hours of ara-C treatment. The values on the y-axis represent the relative viability values which were calculated by normalizing absorbance value at each dose of ara-C for each condition to respective untreated controls. Data are represented as mean ± SEM of 3 independent biological replicates. P (2-tailed) was calculated using the 2-way ANOVA. ∗∗∗∗P < .0001. (H) Western blot showing the efficiency of SOX11 silencing in Granta-519 and JeKo-1 by siRNA for 48 hours. One representative western blot out of 2 is shown. SOX11 was detected at 74 kDa and GAPDH at 37 kDa. (I-J) Dose response curve for 72 hours of ara-C treatment in nontargeting control siRNA- and SOX11 siRNA-transfected Granta-519 (I) and JeKo-1 (J). ara-C treatment was applied 8 hours after transfection. Viability was measured using Celltiter MTS assay after 72 hours of ara-C treatment. Data are represented as mean ± SEM of 2 independent biological replicates. P (2-tailed) was calculated using 2-way ANOVA. ∗∗P < .01; ∗∗∗∗P < .0001.
Because a reduction of tetrameric SAMHD1 levels suggested a reduction of SAMHD1’s enzymatic activity, we were prompted to investigate the functional consequences of SOX11-SAMHD1 interaction on ara-C efficacy in MCL using adenosine triphosphate release–based cell proliferation inhibition assays. Although comparisons across different cell lines are inherently difficult, SOX11− JVM-2 cells exhibited an up to ∼60-fold higher 50% inhibitory concentration (IC50) (5 μM) for ara-C than SOX11+ JeKo-1 (0.08 μM) and Granta-519 (0.12 μM) (Figure 2C). Because all 3 cell lines express SAMHD1 (Figure 2D), these results suggest a SOX11-mediated SAMHD1 inhibition. Next, we examined the effect of SAMHD1 depletion on ara-C sensitivity by delivering simian immunodeficiency virus protein (Vpx) using noninfectious VLPs to target SAMHD1 for ubiquitin-mediated proteasomal degradation17 (Figure 2D). SAMHD1 ablation significantly sensitized SOX11− JVM-2 to ara-C and shifted the IC50 for ara-C by a factor of ∼20 compared with that of control treatment with VLPs lacking Vpx (dX) (Figure 2E; P < .0001). However, SAMHD1 depletion had no significant impact on the response to ara-C in SOX11+ JeKo-1 (P = .15) or Granta-519 (P = .32) (Figure 2F and G respectively). These findings support the notion that the catalytic activity of SAMHD1 is impaired by SOX11.
SOX11 sensitizes MCL to ara-C by inhibiting SAMHD1
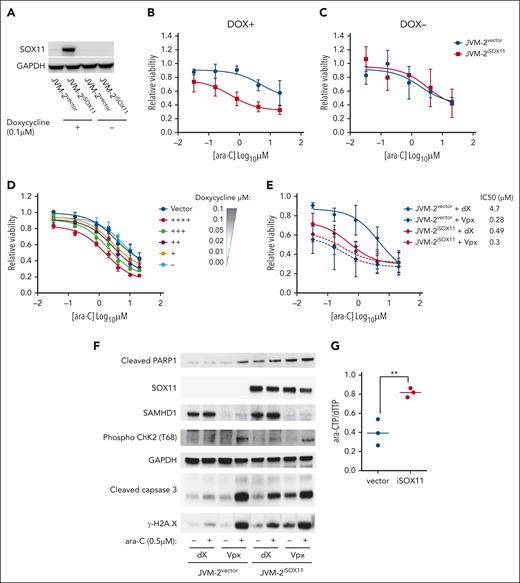
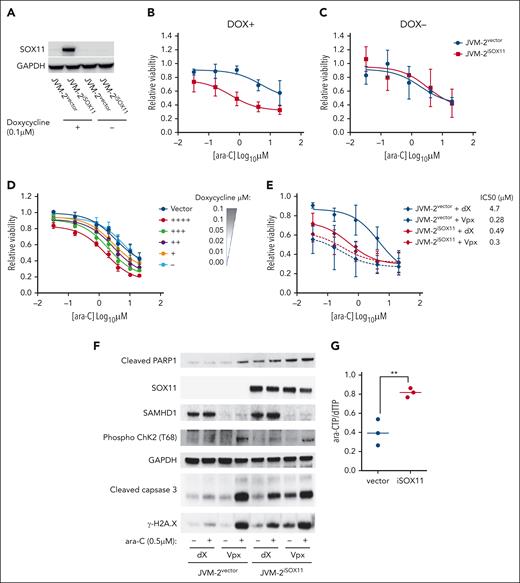
Transient downregulation of SOX11 by RNA interference conferred partial ara-C resistance in Granta-519 and JeKo-1 with an increase of the IC50 approximately fivefold and ∼20-fold, respectively (Figure 2H-J). Conversely, doxycycline-induced SOX11 overexpression in JVM-2iSOX11 significantly sensitized cells to ara-C and reduced the IC50 ∼10-fold from 5 to 0.53 μM (P < .0001), whereas no effect was seen in JVM-2 vector control cells or noninduced JVM-2iSOX11 (Figure 3A-C). Moreover, doxycycline titrations revealed that the extent of ara-C sensitization was dependent on the protein expression level of SOX11 (Figure 3D; supplemental Figures 4 and 5A). Given that ara-C is an S phase–specific drug,41 we wished to rule out indirect effects of SOX11 on cell cycling and thus monitored cell cycle distribution and proliferation. However, apart from a transient increase of the proportion of G1 cells after 24 hours (P = .02; supplemental Figure 5B-C), no significant effects on proliferation or cell cycle distribution were observed upon SOX11 (supplemental Figure 5D). Similarly, primary MCL cells with low SOX11 expression showed a 1.5-fold higher IC50 value than MCL cells with high SOX11 expression (supplemental Figure 6A-C).
SOX11 expression sensitizes MCL cells to ara-C through impairing ara-CTPase activity of SAMHD1. (A) Representative western blot showing SOX11 expression patterns in JVM-2vector and JVM-2iSOX11 in presence and absence of 0.1 μM doxycycline for 96 hours. One representative western blot out of 6 replicates is shown. SOX11 was detected at 74 kDa and GAPDH at 37 kDa. (B-C) Dose response curve for ara-C treatment for 72 hours in JVM-2vector and JVM-2iSOX11 in presence (B, DOX+), and absence (C, DOX−) of doxycycline (DOX). ara-C treatment was applied 24 hours after doxycycline (0.1 μM) treatment. Data are represented as mean ± SEM of 6 independent biological replicates. (D) Dose response curve for 72 hours of treatment with ara-C in JVM-2vector and JVM-2iSOX11 cultured in the indicated concentrations of doxycycline. ara-C treatment started 24 hours after doxycycline-induced SOX11 expression. Viability was measured using CellTiter-Glo Luminescent Cell Viability Assay after 72 hours of ara-C treatment. The values on the y-axis represent the relative viability values, which were calculated by normalizing luminescence value at each dose of ara-C for each condition to respective untreated controls. Data were represented as mean ± SEM of 4 independent biological replicates. (E) Dose response curve for ara-C determined in dX- or Vpx-treated JVM-2vector and JVM-2iSOX11 that were induced by 0.1 μM doxycycline. After 24 hours of culturing in doxycycline-supplemented media, cells were treated with dX or Vpx for 3 hours, followed by ara-C treatment for 72 hours. Viability was measured using CellTiter MTS assay after 72 hours of treatment. The values on the y-axis represent the relative viability values, which were calculated by normalizing absorbance values at each dose of ara-C for each condition to respective untreated controls. Data are represented as mean ± SEM for 5 independent biological replicates. (F) Western blot shows the effect of treatment of ara-C at sublethal dose (0.5 μM) on cleaved PARP1 was detected at 89 kDa, phospho-ChK2 (T68) (∼62 kDa), cleaved caspase-3 (17 kDa), and γ-H2A.X (14 kDa) in dX- or Vpx-treated JVM-2vector and JVM-2iSOX11. ara-C treatment was applied after 3 hours of treatment with either dX or Vpx and treated cells were harvested after 72 hours of ara-C treatment, as explained in panel A. One representative experiment out of 3 is shown. (G) Intracellular ara-CTP levels normalized to the canonical dTTP, determined using HPLC-MS/MS. Both JVM-2vector and JVM-2iSOX11 were treated with 10 μM ara-C for 24 hours. Circles and error bars correspond to individual values, mean ± SEM of at 3 independent experiments. Analyses were performed using unpaired 2-tailed t tests; ∗∗P < .01.
SOX11 expression sensitizes MCL cells to ara-C through impairing ara-CTPase activity of SAMHD1. (A) Representative western blot showing SOX11 expression patterns in JVM-2vector and JVM-2iSOX11 in presence and absence of 0.1 μM doxycycline for 96 hours. One representative western blot out of 6 replicates is shown. SOX11 was detected at 74 kDa and GAPDH at 37 kDa. (B-C) Dose response curve for ara-C treatment for 72 hours in JVM-2vector and JVM-2iSOX11 in presence (B, DOX+), and absence (C, DOX−) of doxycycline (DOX). ara-C treatment was applied 24 hours after doxycycline (0.1 μM) treatment. Data are represented as mean ± SEM of 6 independent biological replicates. (D) Dose response curve for 72 hours of treatment with ara-C in JVM-2vector and JVM-2iSOX11 cultured in the indicated concentrations of doxycycline. ara-C treatment started 24 hours after doxycycline-induced SOX11 expression. Viability was measured using CellTiter-Glo Luminescent Cell Viability Assay after 72 hours of ara-C treatment. The values on the y-axis represent the relative viability values, which were calculated by normalizing luminescence value at each dose of ara-C for each condition to respective untreated controls. Data were represented as mean ± SEM of 4 independent biological replicates. (E) Dose response curve for ara-C determined in dX- or Vpx-treated JVM-2vector and JVM-2iSOX11 that were induced by 0.1 μM doxycycline. After 24 hours of culturing in doxycycline-supplemented media, cells were treated with dX or Vpx for 3 hours, followed by ara-C treatment for 72 hours. Viability was measured using CellTiter MTS assay after 72 hours of treatment. The values on the y-axis represent the relative viability values, which were calculated by normalizing absorbance values at each dose of ara-C for each condition to respective untreated controls. Data are represented as mean ± SEM for 5 independent biological replicates. (F) Western blot shows the effect of treatment of ara-C at sublethal dose (0.5 μM) on cleaved PARP1 was detected at 89 kDa, phospho-ChK2 (T68) (∼62 kDa), cleaved caspase-3 (17 kDa), and γ-H2A.X (14 kDa) in dX- or Vpx-treated JVM-2vector and JVM-2iSOX11. ara-C treatment was applied after 3 hours of treatment with either dX or Vpx and treated cells were harvested after 72 hours of ara-C treatment, as explained in panel A. One representative experiment out of 3 is shown. (G) Intracellular ara-CTP levels normalized to the canonical dTTP, determined using HPLC-MS/MS. Both JVM-2vector and JVM-2iSOX11 were treated with 10 μM ara-C for 24 hours. Circles and error bars correspond to individual values, mean ± SEM of at 3 independent experiments. Analyses were performed using unpaired 2-tailed t tests; ∗∗P < .01.
It should be noted that primary MCL cells do not proliferate in culture, and given that ara-C targets DNA replication in cycling cells, the mode of action of ara-C in nondividing cells could be different.
To gather further evidence that SOX11-mediated ara-C sensitization is dependent on SAMHD1, we addressed the effect of SOX11 overexpression with and without concomitant Vpx-mediated SAMHD1 depletion in the SOX11-inducible JVM-2 system. Reproducibly, SAMHD1 depletion in SOX11− JVM-2vector cells reduced the IC50 of ara-C by a factor of ∼15 (Figure 3E). Induction of SOX11 in JVM-2iSOX11 treated with control VLPs (dX) led to a ∼10-fold reduction of the IC50 of ara-C (Figure 3E; supplemental Figure 6D). The enhanced cytotoxicity of ara-C treatment after Vpx-mediated SAMHD1 depletion in JVM-2iSOX11 or JVM-2vector was recapitulated by increased DNA damage responses as evidenced by increased levels of cleaved poly(adenosine diphosphate-ribose) polymerase 1 (PARP1), phosphorylated checkpoint kinase 2 (p-ChK2), cleaved caspase-3, and γ-H2A.X compared with their control VLP-treated counterparts (Figure 3F). Similar results were observed for ara-C treatment of SOX11-induced JVM-2iSOX11 without SAMHD1 depletion, albeit to a lesser extent, which might be explained by an incomplete induction of SOX11. Consistent with this notion, SOX11 was induced in ∼40% of JVM-2iSOX11 cells upon treatment with 0.1 μM doxycycline (supplemental Figure 4C-E), whereas Vpx treatment led to complete ablation of SAMHD1 protein. SAMHD1 depletion equally sensitized JVM2vector and JVM-2iSOX11 to ara-C, indicating that SOX11-mediated ara-C sensitization is SAMHD1 dependent (Figure 3E; supplemental Figure 6D). In line with this, the effect of ara-C on apoptotic and DNA damage markers in SAMHD1 depleted JVM-2vector and JVM-2iSOX11 cells were very similar (Figure 3F). Taken together, these results indicated that SOX11-mediated reduction of tetrameric SAMHD1 translates into inhibition of SAMHD1 ara-CTPase activity.
Because ara-C efficacy is directly correlated to intracellular accumulation of ara-CTP that can be reduced by SAMHD1 ara-CTPase activity,14 we hypothesized that induction of SOX11 in JVM-2iSOX11 would lead to an increase in ara-CTP. As predicted, ara-CTP levels increased when SOX11 was induced (Figure 3G). Because levels of dNTPs were lower in JVM2iSOX11 than in vector cells (supplemental Figure 7B-C), we normalized ara-CTP levels to dNTPs, resulting in significant increase of ara-CTP-to-dTTP ratios by a factor of 1.5 (P = .0076) in the presence of SOX11 compared with SOX11− vector control cells after 24 hours of treatment with ara-C (Figure 3G; supplemental Figure 7A).
SOX11 enhances ara-C sensitivity of MCL to ara-C in vivo
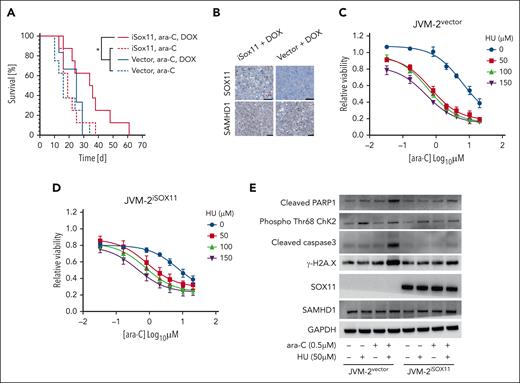
To validate the relevance of SOX11-mediated SAMHD1 inhibition in vivo, we xenotransplanted JVM-2iSOX11 or JVM-2vector cells subcutaneously into NMRI nude mice, supplementing doxycycline in the drinking water to induce SOX11 expression (supplemental Figure 8A). When the subcutaneous tumors reached the threshold volume of 150 mm3 the mice received once daily intraperitoneal injections of 100 mg/kg ara-C i.p. for 5 consecutive days. Median survival time was significantly prolonged in mice with JVM-2iSOX11 tumors supplemented with doxycycline and treated with ara-C (35 days) compared with their counterparts without doxycycline (19 days) (Figure 4A; P = .04). The increase of survival was dependent on the presence of inducible SOX11, because doxycycline-supplemented mice with JVM-2vector tumors treated with ara-C had a significantly shorter median survival (24 days) (Figure 4A; P = .04). These results are mirrored in the tumor volumes, which were significantly lower in JVM-2iSOX11 mice with doxycycline treated with ara-C vs either JVM-2iSOX11 mice without doxycycline with ara-C (supplemental Figure 8B; P < .0001) or JVM-2vector with doxycycline and ara-C (supplemental Figure 8C; P = .01). Posthumous immunohistochemical staining of tumors confirmed the presence of SOX11 in doxycycline-treated JVM-2iSOX11 tumors but not in JVM-2vector, whereas SAMHD1 was expressed under all conditions (Figure 4B).
SOX11 sensitizes MCL to ara-C treatment in vivo and HU mimics SOX11-mediated sensitization to ara-C in SOX11− MCL cell lines. (A) Kaplan-Meier analysis of NOD/SCID mice injected with JVM-2vector or JVM-2iSOX11 that received ara-C (100 mg/kg) after 5 days of injection with cells vs untreated controls; n = 8 per group. (B) Immunohistochemistry revealing SOX11 and SAMHD1 staining in formalin-fixed paraffin-embedded (FFPE) tumor tissue from mice injected with either JVM-2vector or JVM-2iSOX11 treated with doxycycline; scale bar, 50 μm. (C-D) Dose response curves for cytarabine when combined to the indicated concentrations of HU (on the right side of the curves) in JVM-2vector and JVM-2iSOX11, respectively. Cells were treated with 0.1 μM doxycycline for 24 hours before combined treatment with ara-C and HU, which lasted for 72 hours until viability was measured using the CellTiter-Glo Luminescent Cell Viability Assay. Data of 3 independent experiments are represented as mean ± SEM. (E) Western blot analysis of apoptosis and DNA damage markers upon single treatment of ara-C (0.5 μM) or HU (50 μM) or their combination vs the respective untreated controls in JVM-2vector and JVM-2iSOX11. After 24 hours of 0.1 μM doxycycline treatment, combined or single treatments were performed for 24 hours. The blot is a representative out of 3 independent biological replicates. Protein sizes: cleaved PARP1 (89 kDa), SOX11 (74 kDa), SAMHD1 (71 kDa), phospho-ChK2 (T68) (∼62 kDa), GAPDH (37 kDa), cleaved caspase-3 (17 kDa), and γ-H2A.X (14 kDa).
SOX11 sensitizes MCL to ara-C treatment in vivo and HU mimics SOX11-mediated sensitization to ara-C in SOX11− MCL cell lines. (A) Kaplan-Meier analysis of NOD/SCID mice injected with JVM-2vector or JVM-2iSOX11 that received ara-C (100 mg/kg) after 5 days of injection with cells vs untreated controls; n = 8 per group. (B) Immunohistochemistry revealing SOX11 and SAMHD1 staining in formalin-fixed paraffin-embedded (FFPE) tumor tissue from mice injected with either JVM-2vector or JVM-2iSOX11 treated with doxycycline; scale bar, 50 μm. (C-D) Dose response curves for cytarabine when combined to the indicated concentrations of HU (on the right side of the curves) in JVM-2vector and JVM-2iSOX11, respectively. Cells were treated with 0.1 μM doxycycline for 24 hours before combined treatment with ara-C and HU, which lasted for 72 hours until viability was measured using the CellTiter-Glo Luminescent Cell Viability Assay. Data of 3 independent experiments are represented as mean ± SEM. (E) Western blot analysis of apoptosis and DNA damage markers upon single treatment of ara-C (0.5 μM) or HU (50 μM) or their combination vs the respective untreated controls in JVM-2vector and JVM-2iSOX11. After 24 hours of 0.1 μM doxycycline treatment, combined or single treatments were performed for 24 hours. The blot is a representative out of 3 independent biological replicates. Protein sizes: cleaved PARP1 (89 kDa), SOX11 (74 kDa), SAMHD1 (71 kDa), phospho-ChK2 (T68) (∼62 kDa), GAPDH (37 kDa), cleaved caspase-3 (17 kDa), and γ-H2A.X (14 kDa).
HU sensitizes SOX11− MCL to ara-C in vitro
We have previously reported that noncompetitive inhibitors of ribonucleotide reductase including hydroxyurea (HU) inhibit SAMHD1 ara-CTPase activity, thereby potentiating sensitivity to ara-C in AML.36,42 Given the inhibitory effects of SOX11 on SAMHD1 ara-CTPase, we hypothesized that SOX11− MCL might disproportionately benefit from the recently identified pharmacological inhibitors of SAMHD1 compared with SOX11+ MCL cells.36 To test this, we treated JVM2vector and JVM-2iSOX11 cells with increasing concentrations of ara-C and HU. HU reduced the IC50 of ara-C in JVM-2vector in a dose-dependent manner by up to 15-fold (Figure 4C). The sensitizing effect of HU was less pronounced in JVM-2iSOX11 (Figure 4D), in which 40% of the cells express SOX11 (supplemental Figure 4D). Drug-drug interaction analyses calculating ZIP confirmed a substantially higher synergy of HU and ara-C in JVM-2vector than JVM-2iSOX11 (supplemental Figure 9A-B). Addition of HU to ara-C compared with ara-C alone led to a more pronounced increase in DNA damage responses in JVM-2vector than in JVM-2iSOX11 (supplemental Figure 9C-F). The reduced synergy of HU/ara-C combinations in the presence of SOX11 were consistent with SOX11-mediated SAMHD1 inhibition (Figure 4E).
Regulation of SAMHD1 expression in MCL
We have previously shown that there is a weak positive correlation of SOX11 and SAMHD1 expression based on immunohistochemistry (N = 62; Spearman correlation coefficient, 0.27; P = .036).19 To further investigate this, we analyzed gene expression data of 44 previously published MCL cases43 and confirmed a positive correlation of SAMHD1 and SOX11 expression (Spearman rank correlation R = 0.37; P = .013; supplemental Figure 10A). However, the correlation was mainly driven by lower SAMHD1 expression in nonnodal MCL (nnMCL) (supplemental Figure 10C) and lost when restricting the analysis to cMCL (supplemental Figure 10B). Consistently, silencing of SOX11 in SOX11+ MCL cell lines19 or induction of SOX11 in SOX11− JVM-2 (Figure 3F; supplemental Figure 10D) did not affect SAMHD1 expression. Analyses of SAMHD1 histone marks and DNA methylation together with SAMHD1 messenger RNA expression in 5 published MCL cases (2 cMCL and 3 nnMCL) in comparison with normal B cells43,44 did not further reveal evidence of epigenetic regulation of differential SAMHD1 expression in MCL (supplemental Figure 10E). Looking at the expression of SAMHD1 measured by RNAseq in these 5 MCL cases, 2 cMCL and 2 nnMCL, showed similar levels, and 1 nnMCL displayed lower expression (supplemental Figure 10F). However, all 5 cases showed a similar epigenomic profile, and therefore, SAMHD1 expression differences in MCL could be a consequence of other changes not related to epigenetic regulation.
Discussion
Throughout the past decade, understanding of MCL pathobiology has witnessed remarkable progress, with respect to both intrinsic cellular anomalies and tumor microenvironment.4,45 This has led to promising therapeutic approaches to overcome refractoriness to therapy and relapse in MCL, including the use of noncovalent Bruton tyrosine kinase inhibitors, immunomodulatory agents, bispecific antibodies, and next generation cell-based therapies.3,45 However, rituximab-based immunochemotherapy remains the backbone strategy for MCL treatment.5,6,46 The Nordic regimen R-CHOP (cyclophosphamide, doxorubicin, vincristine, and prednisone plus rituximab) coupled to high-dose ara-C improved MCL outcomes.6,7 High-dose ara-C has been shown to effectively prolong time to treatment failure in patients with MCL who received R-CHOP followed by ASCT.5,9 It is therefore incumbent to adequately understand the regulatory underpinnings of ara-C response in MCL.
Here, we provide a novel mechanistic insight into how ara-C response is regulated by SAMHD1 in MCL. Unbiased coimmunoprecipitation of SOX11 revealed SAMHD1 as the top significant binding-partner of SOX11 in MCL cell lines. The SOX11-SAMHD1 interaction was validated by proximity-ligation assays and cellular thermal shift assays. Direct binding of the SOX11 HMG domain with SAMHD1 was demonstrated by MST. In situ crosslinking revealed that SOX11 binding to SAMHD1 reduced SAMHD1 tetramerization. Consequently, this interaction triggered inhibition of ara-CTPase activity, leading to higher intracellular ara-CTP accumulation and sensitization of in vitro and in vivo MCL models to ara-C treatment. In vitro studies also showed that pharmacological inhibition of SAMHD1 by HU can mimic the ara-C–sensitizing effect of SOX11 in SOX11− MCL. Altogether, these findings substantiate the negative regulatory effect of SOX11 on SAMHD1’s ara-CTPase activity through physical binding, without affecting SAMHD1 gene expression. Recently, we demonstrated that SAMHD1 expression levels show no association to survival in patients with MCL receiving ara-C.19 In line with this, Roider et al showed that SAMHD1 expression and mutation status did not correlate with failure-free survival or complete remission rate in patients with MCL who received ara-C treatment.18 Because most cases of MCL included in clinical studies are of the conventional subtype and thus SOX11+21,22 (in contrast to the more indolent, nonnodal leukemic MCL variant that is SOX11 negative23), it can be inferred that SAMHD1 is inherently inhibited by SOX11. Our ex vivo functional studies showed that primary MCL with low expression of SOX11 showed higher IC50 in response to ara-C than primary cells derived from SOX11-high MCL cases. The present work appears to be able to explain the lack of correlation between SAMHD1 levels and ara-C efficacy by intrinsic SOX11-mediated inhibition of SAMHD1 in MCL. Consistently, in a study from the European MCL Network with patients treated with ara-C containing regimens, cases with low SOX11 expression (<10% of SOX11+ tumor cells) had a shorter time-to-treatment failure and shorter overall survival than SOX11+ cases.8 Similar results have been reported in the Nordic MCL 2/3 cohort.47 This could be ascribed to the lack of SOX11-mediated sensitization to ara-C as indicated by our findings. It could also be suggested that HU could be a promising strategy to increase ara-C sensitivity in SOX11− or -low MCL as recently shown for AML.17 However, it should be noted that other features of SOX11 negative MCL, such as frequent TP53 aberrations8,48,49 might also contribute to different outcomes.
Two previous studies reported a SAMHD1 mutation rate in MCL of ∼8%, but no significant correlation with SAMHD1 gene expression could be identified18,50 Whether these mutations affect the binding to SOX11 or the response to ara-C in MCL is currently not known. Further biochemical studies are needed to define the SAMHD1-SOX11 binding interface more precisely and to explore whether SOX11 modulates other functions of SAMHD1 and, in extension, the pathobiology of MCL.
We conclude that SAMHD1 ara-CTPase activity is intrinsically inhibited by SOX11 in MCL, which could explain the efficacy of ara-C containing regimens in younger and older patients with MCL.10 It is therefore tempting to speculate that SOX11 expression level could be used to stratify MCL treatment. It is also appealing to investigate SOX11 and SAMHD1 expression in parallel to define cutoff levels of SOX11 sufficient to overcome SAMHD1-mediated ara-C resistance at clinically relevant doses.
Acknowledgments
This work was supported by the Swedish Cancer Society (21 1478 Pj) (B.S.), The Swedish Research Council (2019-01705) (B.S.), and The Cancer Society in Stockholm (201323) (B.S.). This research was further supported by grants from the Cathrine Everts Foundation (I.L.), the Stockholm region (FoUI-974942) (N.H.), the Swedish Childhood Cancer Foundation (PR2020-0077) (N.H.), the Swedish Cancer Society (1494 Pj) (N.H.) and (20 1269 PjF) (J.L.), the funds at Radiumhemmet (211143) (N.H.), and the Swedish Research Council (2020-01184) (N.H.) and (2019-04830) (J.L.), the Swedish Medical Association (SLS-961737) (N.H.) and the Francis Crick Institute (I.A.T. and D.S.) which receives its core funding from Cancer Research UK (CC2029 and CC2106), the UK Medical Research Council (CC2029 and CC2106), and the Wellcome Trust (CC2029 and CC2106). V.A. and E.C. are supported by the Ministry of Science and Innovation (PID2021-124048OB-100) (V.A.) and (PID2021-123054OB-I00) (E.C.), the Generalitat de Catalunya Suport Grups de Recerca (AGAUR-Consolidated Research Group) (2021-SGR-01274) (V.A.) and (2021-SGR-01172) (E.C.) and Fundació la Marató de TV3 (201901-30) (V.A.). This work was also supported by the National Institute of Allergy and Infectious Diseases, National Institutes of Health (grants AI162633 and AI136581) (B.K.) and the National Institute of Mental Health, National Institutes of Health (MH116695) (R.F.S).
Authorship
Contribution: M.H.A.M., M.L., B.C., N.H., and B.S. contributed to study design and planning; V.A., N.T., E.C., and N.H. provided reagents and cell lines; M.H.A.M., I.L., M.L., B.C., M.M., A.M.W., D.S., and I.A.T. performed experiments; I.L., M.W., and A.L.S. performed in vivo studies; M.S.-G. contributed to generation of inducible JVM-2 cell lines: I.L. performed synergy analysis; M.H.A.M., M.L., H.J.J., M.M., A.M.W., G.Z.R., B.C., I.L., N.H., and B.S. contributed to data analysis and interpretation; H.J.J. performed proteomic analysis; nucleotide pool measurement experiments were designed by N.H., I.L., and M.H.A.M.; samples were prepared by M.H.A.M. and I.L.; subsequent analysis were performed by S.T. under the supervision of B.K. and R.F.S.; secondary analysis of publicly available data performed by B.G.-T. and J.I.M.-S.; and all authors contributed to writing and approval of the final version.
Conflict-of-interest disclosure: The authors declare no competing financial interests.
Correspondence: Mohammad Hamdy Abdelrazak Morsy, Karolinska Institutet, Laboratory Medicine, Alfred Nobels Allé 8B, 141 52 Stockholm, Sweden; email: mohammad.morsy@ki.se.
References
Author notes
N.H. and B.S. shared last authorship.
The MS data have been deposited in the ProteomeXchange database (accession code PXD030976). During review the data can be accessed at https://repository.jpostdb.org/preview/2072219057649edcd204bc8 (access key: 9780).
Data will be available upon reasonable request from the corresponding author, Mohammad Hamdy Abdelrazak Morsy (mohammad.morsy@ki.se).
The online version of this article contains a data supplement.
The publication costs of this article were defrayed in part by page charge payment. Therefore, and solely to indicate this fact, this article is hereby marked “advertisement” in accordance with 18 USC section 1734.

