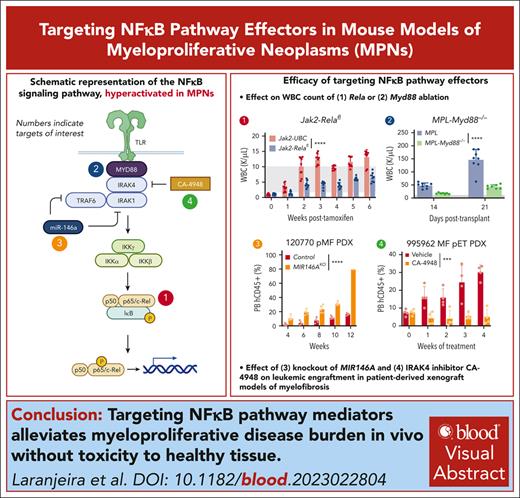
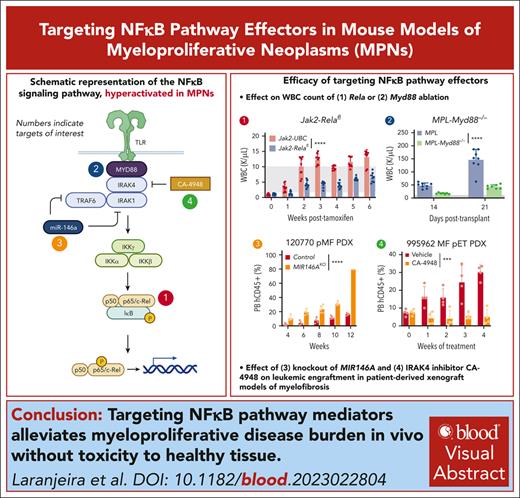
Abrogation of RelA, Myd88, and IRAK4 consistently suppressed disease hallmarks of leukocytosis, splenomegaly, and bone marrow dysfunction.
IRAK4 inhibitor CA-4948 effectively reduced leukemic engraftment of PDX models of myelofibrosis.
Visual Abstract
Hyperactivation of the NF-κB cascade propagates oncogenic signaling and proinflammation, which together augments disease burden in myeloproliferative neoplasms (MPNs). Here, we systematically ablate NF-κB signaling effectors to identify core dependencies using a series of primary samples and syngeneic and patient–derived xenograft (PDX) mouse models. Conditional knockout of Rela attenuated Jak2V617F- and MPLW515L-driven onset of polycythemia vera and myelofibrosis disease hallmarks, respectively. In PDXs, RELA knockout diminished leukemic engraftment and bone marrow fibrosis while extending survival. Knockout of upstream effector Myd88 also alleviated disease burden; conversely, perturbation of negative regulator miR-146a microRNA induced earlier lethality and exacerbated disease. Perturbation of NF-κB effectors further skewed the abundance and distribution of hematopoietic multipotent progenitors. Finally, pharmacological targeting of interleukin-1 receptor–associated kinase 4 (IRAK4) with inhibitor CA-4948 suppressed disease burden and inflammatory cytokines specifically in MPN without inducing toxicity in nondiseased models. These findings highlight vulnerabilities in MPN that are exploitable with emerging therapeutic approaches.
Introduction
The JAK-STAT–driven myeloproliferative neoplasms (MPNs) are a heterogenous group of myeloid malignancies that includes polycythemia vera (PV), essential thrombocythemia (ET), and myelofibrosis (MF).1 JAK-STAT signaling intertwined with a hyperactive parallel NF-κB cascade act as a fulcrum in the initiation and progression of MPN and other myeloid neoplasms.2-5 Indeed, circulating cytokines are excessively produced in patients with MPN but largely remain abnormally elevated after treatment with JAK2 inhibitors including ruxolitinib, further underscoring a critical role of NF-κB driving associated inflammation.6-8
Multilevel regulation of NF-κB activation exist in response to microenvironmental cues. Activation of toll-like receptors (TLRs) and interleukin-1 (IL-1) receptor by their cognate ligands propagate signals through interleukin-1 receptor–associated kinase 1 (IRAK1), IRAK4, and tumor necrosis factor receptor–associated factor 6 (TRAF6) leading to phosphorylation of the inhibitor of NF-κB (IκB) kinase (IKK) complex, RELA/p65 and IκBα, of which hyperactivity has been identified in MPN.9 The microRNA miR-146a also imposes distinct regulation of NF-κB signaling by silencing expression such as TRAF6 and IRAK1, overall repressing NF-κB signaling.10,11 Promising efforts targeting the NF-κB cascade include pevonedistat, an inhibitor of NEDD8-activating enzyme, which prevents IκBα degradation. Pevonedistat efficacy has been observed across hematological malignancies, including in MPN,12 however, failure to meet the primary end points in the phase 3 PANTHER trial combining pevonedistat with azacitidine vs azacitidine alone resulted in termination of further clinical development.13
Other emerging pharmacological strategies indirectly targeting NF-κB activation, such as against ribosomal S6 kinase A1 (PMD-026), bromodomain and extra-terminal domain family proteins (pelabresib), and IRAK1/4 (pacritinib, CA-4948) have demonstrated potent antileukemia effects across preclinical and clinical models.14-17 However, it remains poorly understood whether modulation of NF-κB signaling via different entry points would yield similar disease attenuation phenotypes particularly in the context of MPN.
Here, we functionally assess the impact of targeting the NF-κB cascade hierarchy of RelA, Myd88, miR-146a, and IRAK4 using various mouse models of MPN and further highlight their specific and crucial dependency in pathogenesis.
Methods
Mouse models
Jak2 V617F mouse model
Jak2 V617F–knockin mice18 were a generous gift from Ann Mullally (Harvard Medical School). Human ubiquitin C (UBCh-Cre-ERT2 or Relaflox/flox-UBC-Cre-ERT219 were crossed with CD45.2 Jak2 V617F–knockin mice. Bead-enriched CD45.2 Kit+ cells were transplanted via tail-vein into CD45.1 lethally irradiated (2 separate doses of 550 cGy) recipient mice. After stable engraftment, mice were injected with tamoxifen (70 mg/kg) by intraperitoneal injection every day for 5 consecutive days to induce Rela excision and Jak2 V617F expression. Peripheral blood (PB) was collected, and hematological parameters were measured by flow cytometry and Hemavet on a scheduled basis. Bone marrow (BM) was collected at end point. Spleens were weighed at end point and normalized to mouse body weights.
For paired control experiments, whole BM was harvested from UBC-Cre-ERT2 or Relaflox/flox-UBC-Cre-ERT2 CD45.2 donor mice and Kit+ cells were transplanted into CD45.1 lethally irradiated mice. Experiments were then conducted following aforementioned protocol.
MPL W515L retrovirus mouse model
Whole BM was harvested from UBC-Cre-ERT2 or Relaflox/flox-UBC-Cre-ERT2 CD45.2 donor mice and Kit+ cells were retrovirally transduced with MPL W515L–green fluorescent protein (GFP). Transduction efficiency was validated by flow cytometry for GFP, and Kit+ cells were transplanted via tail-vein into CD45.1 lethally irradiated recipient mice. After transplant, mice were injected with tamoxifen (70 mg/kg) by intraperitoneal injection every day for 5 consecutive days to induce Rela excision. PB was collected weekly and hematological parameters were evaluated by flow and Hemavet. Survival was monitored daily, and moribund mice were humanely euthanized. Spleens were weighed at end point and normalized to mouse body weight at end point. The BM and spleen were collected and processed for hematoxylin and eosin, and reticulin staining. BM fibrosis was blindly scored.
For paired control experiments, whole BM was harvested from UBC-Cre-ERT2 or Relaflox/flox-UBC-Cre-ERT2 CD45.2 donor mice and Kit+ cells were transduced with a GFP vector. Two sets of experiments were then conducted following aforementioned protocol with 2 end points: 5 weeks after tamoxifen, and 10 weeks after tamoxifen treatment.
Similar transplant and experiment methodology was performed in the generation of MPL W515L-Myd88−/− mouse models. Myd88−/− mice (The Jackson Laboratory) and hematopoietic parameters have been described previously.20
PDX model
NOD-scid-Il2rg-null-3/GM/SF (NSGS) mice were obtained from The Jackson Laboratory. Patient–derived xenograft (PDX) models were performed as described previously.21,22 In brief, CD34+ cells were isolated using magnetic enrichment (Miltenyi Biotec, catalog no. 130-100-453) and cultured overnight in serum-free expansion medium II (SFEMII) media (STEMCELL Technologies, Vancouver, Canada, catalog no. 09605) supplemented with penicillin/streptomycin (50 U/mL), human stem cell factor (50 ng/mL), human thrombopoietin (50 ng/mL), and human Fms-related tyrosine kinase 3 ligand (50 ng/mL). For genetic perturbation, CD34+ cells were nucleofected with CRISPR–associated protein 9/ribonucleoprotein complexed with target single-guide RNAs (sgRNAs) or adeno-associated virus integration site 1 (AAVS1) control. Forty-eight hours after nucleofection, 1 × 10⁵ cells were transplanted into sublethally irradiated NSGS mice via intratibial injection under anesthetics. For CA-4948 treatment, mice with engraftment were treated with 12.5 mg/kg CA-4948 or vehicle, 5 days on, 2 days off, for 4 consecutive weeks. At end point, the BM was collected and analyzed by flow cytometry and the spleens were weighed and normalized to mouse body weight. The BM and spleens were collected and processed for hematoxylin and eosin, and reticulin staining.
Validation of gene excision and qRT-PCR
Total genomic DNA was isolated from mice 1 week before and after treatment with tamoxifen to assess Rela excision, or from primary cells after genetic perturbation.
Quantitative reverse transcription polymerase chain reaction (RT-qPCR) was performed on CD14+ bead-sorted (Miltenyi Biotec, Bergisch Gladbach, Germany) monocytes. Sequences for guides and primers are provided in supplemental Table 2, available on the Blood website.
Colony formation assay
CD34+ cells were seeded in triplicate at 1000 cells per mL in Methocult H4034 (STEMCELL Technologies, Vancouver, Canada) after genetic perturbation, or with the indicated inhibitors. Colonies were enumerated after 10 to 14 days.
RNA sequencing
RNA from transduced CD34+ primary cells was extracted using the RNeasy Mini Kit (Qiagen, Hilden, Germany) with DNase treatment. Complementary DNA synthesis was performed using Clontech SMARTer sequenced by Illumina NovaSeq 6000. Data processing, differential gene expression analysis, and gene set enrichment analyses were then performed following published protocols.23 Gene set enrichment analysis was then performed, as described previously.24
Flow cytometry
Cells were run on a BD FACSCanto II cell analyzer, and downstream analysis was performed with FlowJo (Ashland, OR).
Mass cytometry (CyTOF)
Experiments were performed following previous protocol and validated antibody panel.23 In brief, primary samples were thawed and treated with IL-1β and/or CA-4948 for 4 hours in the presence of protein transport inhibitor cocktail (eBioscience, San Diego, CA). Cells were then fixed, permeabilized, stained, and resuspended in a DNA IR-intercalator before being run on a CyTOF2 (cytometry by Time-of Flight) mass cytometer (Fluidigm, South San Francisco, CA).
Statistical analysis and figure schematics
Statistical analysis was performed using GraphPad Prism version 9 (La Jolla, CA). ∗P < .05, ∗∗P < .01, ∗∗∗P < .001, and ∗∗∗∗P < .0001. Figure schematics were created with BioRender.com.
MPN primary samples were obtained according to a protocol approved by the Washington University Human Studies Committee (WU no. 01-1014). In vivo procedures were conducted in accordance with the Institutional Animal Care and Use Committee of Washington University (no. 20-0463).
Results
RelA essentiality in syngeneic MPN mouse models of PV and MF
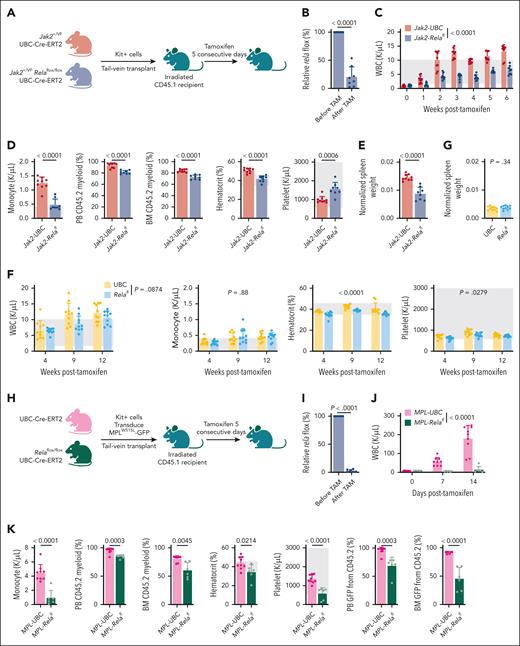
We first examined the impact of Rela abrogation by crossing UBC-Cre-ERT2 with 2 conditional models: Jak2 V617F knockin that exemplifies PV, and Rela knockout (Figure 1A). After engraftment of Kit+ cells, treatment of mice with tamoxifen induced Rela excision (Figure 1B). Suppression of leukocytosis was observed within a week of Rela excision and sustained across 6 weeks until end point. (Figure 1C-D). Monocyte counts were significantly diminished as were CD45.2 myeloid cells in both the PB and BM (Figure 1D). Elevated hematocrit was also suppressed in Jak2-Relafl mice, whereas platelet counts were increased (Figure 1D). Although there were no changes to total BM hematopoietic stem cells (HSCs), we observed increased LSK (Lin−Sca1+Kit+) cells and skewing of multipotent progenitors (MPPs; supplemental Figure 1A-B). Finally, Jak2-Relafl mice had significant reduction of splenomegaly (Figure 1E), another hallmark of MPN.
Rela has been described to regulate normal hematopoiesis, stem cell development, and differentiation.19 Thus, we performed experiments in which we transplanted Kit+ cells from UBC control or Relafl mice into recipients. After tamoxifen administration, we observed a near-significant trend of decreased white blood cell (WBC) counts in Relafl animals compared with control mice (Figure 1F). No changes in monocyte counts were observed. There were decreases to hematocrit and platelet counts, however both values remained within the normal reference ranges. Spleen weights were also unchanged (Figure 1G). Overall, although Rela perturbation did result in a mild but evident effect on normal hematopoiesis, stronger suppression of disease features was observed in the Jak2 V617F model of PV.
We then adopted a second MPN model in which MPL W515L retroviral expression produces a phenotype resembling MF indicated by leukocytosis, splenomegaly, and BM fibrosis.25 Kit+ cells from CD45.2 UBC-Cre-ERT2 or Relaflox/flox UBC-Cre-ERT2 mice were transduced with MPL W515L-GFP and transplanted into recipient mice and treated with tamoxifen (Figure 1H-I; supplemental Figure 1C). Consistent reduction of pathologic myeloid cells was observed in MPL-Relafl mice (Figure 1J-K) as in Jak2-Relafl mice. Rela ablation also reduced hematocrit, platelet counts, and CD45.2 GFP+ cells (Figure 1K), suggesting inhibition of oncogenic cells. Importantly, we observed a significant attenuation of disease hallmarks with a decrease of spleen weight and dysmegakaryopoiesis, enhanced survival, and reduction of BM reticulin deposition (Figure 1L-N). Together, these data support the crucial dependency of Rela in mediating MPN pathogenesis.
We adopted similar control models via empty vector transduction of Kit+ cells isolated from UBC control or Relafl mice. We conducted 2 sets of experiments, the first with a follow-up period of 5 weeks after tamoxifen (denoted as “brief time course”), which is in line with the duration of the MPL W515L experiment, and a second set in which animals were followed-up for a longer duration of 10 weeks after tamoxifen (denoted as “extended time course”). Our findings in these experiments were similar to control models used for Jak2 animals, namely a mild but statistically significant reduction to hematopoietic parameters that remained within normal limits (supplemental Figure 1D-E). Nonetheless, Rela ablation more potently alleviated features of MF in pathogenic MPL mouse models.
Conserved RELA dependency in patient-derived MPN mouse models
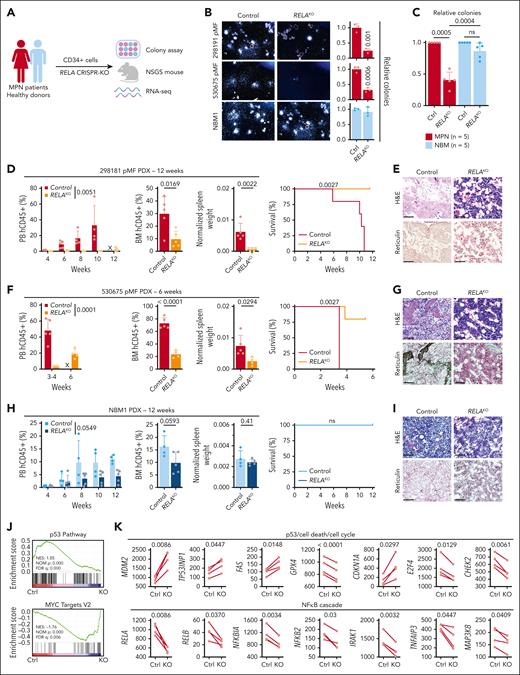
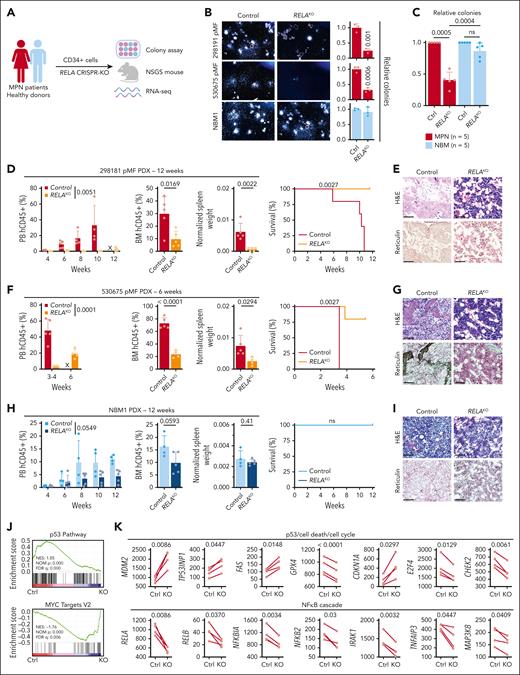
Next, we used a PDX humanized mouse model that maintains genetic hierarchy and disease features of the engrafted donors.21 Purified CD34+ cells from patients with MF and healthy BM donors (NBM) were transduced with an sgRNA targeting RELA or AAVS1 as a control and used for downstream experiments (Figure 2A; supplemental Figure 1F). RELA ablation significantly decreased colony formation of cells from MF patients but not healthy donors (Figure 2B-C), reiterating specific RELA dependency. In parallel, RELA-knockout cells were engrafted into NSGS mice and followed-up for 6 to 12 weeks. In the MF 298191 PDX (mutations in JAK2, TET2, and SRSF2), there was near elimination of leukemic cells in the PB and significant reduction in the BM (Figure 2D). Furthermore, RELA abrogation led to significantly reduced spleen weights and prolonged survival, with subsequent BM histology revealing improved sclerosis and dysmegakaryopoiesis (Figure 2D-E). Consistent reduction of disease hallmarks was observed in a second MF 530575 PDX (mutations in MPL, TET2, KRAS, CBL, and BCORL1) with further evident reduction of fibrosis (Figure 2F-G). In contrast, NSGS mice engrafted with NBM CD34+ cells did not yield disease symptoms nor did RELA targeting in healthy cells significantly affect hematopoiesis or measured disease hallmarks, albeit a similar mild degree of leukocyte suppression was observed in these healthy animals as seen with syngeneic control mouse models (Figure 1M-N).
Conserved RELA dependency in patient-derived MPN mouse models. (A) Schematic of the primary sample models and downstream assays after RELA perturbation. (B) Colony assay of CD34+ cells after RELA knockout (KO). Representative images (left). Relative numbers (right, n = 3 biological replicates). Statistics were assessed by 2-tailed Student’s t test. (C) Relative colony numbers after RELA knockout from additional unique patients with MPN (n = 5) and NBM donors (n = 5). Statistics were assessed by 2-tailed Student’s t test comparing MPN and NBM after taking an average of each 3 biological replicates per sample. (D-I) Leukemic engraftment in the PB, BM at end point, normalized spleen weights, survival curves, and BM histology in the 298181 primary MF (D-E; n = 5 mice per group), 530675 primary MF (F-G; n = 5 mice for control, n = 4 for RELAKO), and NBM1 (H-I; n = 4 mice for control, n = 5 for RELAKO) PDX models. PB human CD45+ (hCD45+) cells statistics assessed by 2-way ANOVA. BM hCD45+ and normalized spleen weights statistics assessed by 2-tailed Student t test. Survival curves assessed by log-rank test. Scale bar = 75 μm. (J) Gene set enrichment analysis scores after RNA sequencing analysis of 4 paired MPN samples after RELA knockout. (K) Expression of pertinent genes from RNA sequencing data after RELA knockout. Statistics assessed by Wilcoxon matched-pairs signed rank test. ns, nonsignificant; X, no data.
Conserved RELA dependency in patient-derived MPN mouse models. (A) Schematic of the primary sample models and downstream assays after RELA perturbation. (B) Colony assay of CD34+ cells after RELA knockout (KO). Representative images (left). Relative numbers (right, n = 3 biological replicates). Statistics were assessed by 2-tailed Student’s t test. (C) Relative colony numbers after RELA knockout from additional unique patients with MPN (n = 5) and NBM donors (n = 5). Statistics were assessed by 2-tailed Student’s t test comparing MPN and NBM after taking an average of each 3 biological replicates per sample. (D-I) Leukemic engraftment in the PB, BM at end point, normalized spleen weights, survival curves, and BM histology in the 298181 primary MF (D-E; n = 5 mice per group), 530675 primary MF (F-G; n = 5 mice for control, n = 4 for RELAKO), and NBM1 (H-I; n = 4 mice for control, n = 5 for RELAKO) PDX models. PB human CD45+ (hCD45+) cells statistics assessed by 2-way ANOVA. BM hCD45+ and normalized spleen weights statistics assessed by 2-tailed Student t test. Survival curves assessed by log-rank test. Scale bar = 75 μm. (J) Gene set enrichment analysis scores after RNA sequencing analysis of 4 paired MPN samples after RELA knockout. (K) Expression of pertinent genes from RNA sequencing data after RELA knockout. Statistics assessed by Wilcoxon matched-pairs signed rank test. ns, nonsignificant; X, no data.
We also performed RNA sequencing on CD34+ cells from 4 patients with MPN after RELA abrogation (supplemental Table 1). Gene set enrichment analysis revealed an augmented “p53 Pathway” and diminished “MYC Target V2” pathway in RELA-targeted cells compared with control (Figure 2J). Pertinent genes whose expression was consistently altered in knockout settings included those that (1) regulate survival and proliferative pathways: MDM2, TP53INP1, and FAS; (2) major ferroptosis mediator GPX4; and (3) cell cycle regulators CDKN1A (p21), E2F4, and CHEK2 (Figure 2K). There was also downregulation of NF-κB cascade effectors including RELB, NFKBIA, and NFKB2, in addition to IRAK1, TNFAIP3, and MAP3K8, indicating on-target effects. Overall, these findings indicate multiple crucial parallel pathways affected by loss of RELA, which support reduced leukemic hallmarks observed in PDX models.
Myd88 ablation alleviates MPN disease burden
A multitude of regulatory inputs mediate NF-κB activation, including the inflammatory transducer MYD88 (Figure 3A). To assess whether upstream effector Myd88 played a similar role in MPN pathogenesis, we transduced Kit+ cells from Myd88-null mice with MPL W515L (Figure 3B). As observed in Rela-knockout-MPL animals, Myd88 deficiency in the MPL setting also diminished pathogenic WBC and monocyte count upsurgence, inhibited the accumulation of BM CD45.2 myeloid cells, and reduced spleen weights (Figure 3C-E). Of hematopoietic progenitors, Myd88-null-MPL mice exhibited reduced LSK cells and increased hematopoietic stem/progenitor cell subsets with further skewing toward the MPP1 population from MPP2/3/4 (Figure 3F-G). The rapid lethality governed by mutant MPL was also delayed upon Myd88 loss, consistent with reduced pathology in the spleen and BM sections (Figure 3H-I). Previous work characterizing the hematopoietic compartments of Myd88-knockout mice revealed no alterations including numbers of long-term and short-term HSCs, MPPs, or common myeloid progenitors at homeostasis.20 Thus, abolishment of Myd88, similar to Rela/RELA, reduces overall disease severity and represent core dependencies specific to MPN pathogenesis.
Myd88 ablation alleviates MPN disease burden. (A) Schematic of TLR-mediated NF-κB signaling cascade. (B) Schematic of the Myd88−/−MPLW515L mouse model. (C) WBC counts of MPL (n = 8) and MPL-Myd88−/− (n = 8) mice. Statistics were assessed by 2-way ANOVA. Light gray regions indicate the normal reference range. (D) Monocyte, BM CD45.2 myeloid cells, hematocrit, and platelet counts at end point (MPL [n = 8], MPL-Myd88−/− [n = 7]). Statistics were assessed by 2-tailed Student t test. (E) Normalized spleen weight at end point. Statistics were assessed by 2-tailed Student t test. (F) Percentage of HSCs of BM cells. (G) Distribution of hematopoietic progenitor populations at end point. Statistics were assessed by 2-tailed Student t test. (H) Kaplan-Meier survival curve. Statistics were assessed by log-rank test. (I) Histology of the spleen and BM at end point. Scale bar = 75 μm. Histology of the spleen and BM at end point. Scale bar = 75 μm. BM fibrosis was scored from 3 mice in each group.
Myd88 ablation alleviates MPN disease burden. (A) Schematic of TLR-mediated NF-κB signaling cascade. (B) Schematic of the Myd88−/−MPLW515L mouse model. (C) WBC counts of MPL (n = 8) and MPL-Myd88−/− (n = 8) mice. Statistics were assessed by 2-way ANOVA. Light gray regions indicate the normal reference range. (D) Monocyte, BM CD45.2 myeloid cells, hematocrit, and platelet counts at end point (MPL [n = 8], MPL-Myd88−/− [n = 7]). Statistics were assessed by 2-tailed Student t test. (E) Normalized spleen weight at end point. Statistics were assessed by 2-tailed Student t test. (F) Percentage of HSCs of BM cells. (G) Distribution of hematopoietic progenitor populations at end point. Statistics were assessed by 2-tailed Student t test. (H) Kaplan-Meier survival curve. Statistics were assessed by log-rank test. (I) Histology of the spleen and BM at end point. Scale bar = 75 μm. Histology of the spleen and BM at end point. Scale bar = 75 μm. BM fibrosis was scored from 3 mice in each group.
Suppression of NF-κB repressor miR-146a exacerbates MPN pathogenesis
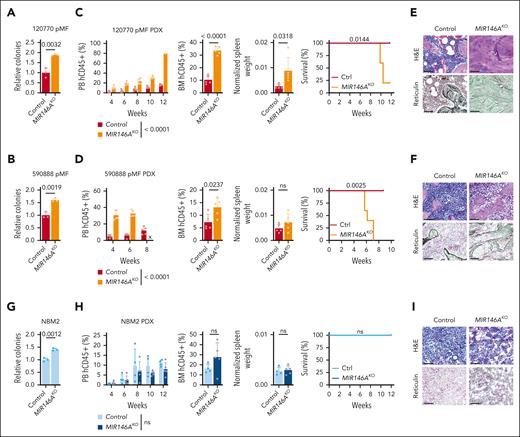
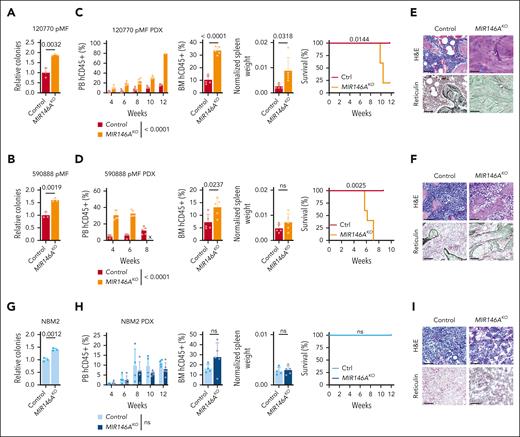
Although Myd88 and Rela/RELA activate NF-κB, the microRNA miR-146a is a repressor (Figure 3A), and its knockout has been described to induce myelodysplastic syndrome (MDS) or myeloproliferative disease development in a subset of mice.11,26-28 We then investigated whether similar regulation existed in context of MPN PDX models and performed knockout of MIR146A in CD34+ HSCs using a previously validated sgRNA.29 We observed enhanced ex vivo colony formation potential, leukemic engraftment, larger spleens, earlier lethality, and BM sclerosis or fibrosis across both MF PDXs (MF 120770, mutations in JAK2; MF 590888, mutations in MPL, ASXL1; Figure 4A-F). In contrast, MIR146A-KO in normal BM cells did not significantly induce myeloproliferative disease in vivo, although enhanced colony formation potential was observed ex vivo (Figure 4G-I). These findings further reinforce a greater disease-specific dependency on NF-κB signaling in MPN.
Suppression of NF-κB repressor miR-146a exacerbates MPN pathogenesis. (A-I) Colony assay, leukemic engraftment in the PB, BM at end point, normalized spleen weights, survival curves, and BM histology in the 120770 pMF (A,C,E), 590888 pMF (B,D,F), and NBM2 (G-I) PDX models (n = 5 mice per group). PB human CD45+ (hCD45+) cells statistics assessed by 2-way ANOVA. Relative colony numbers (n = 3 biological replicates), BM hCD45+ and normalized spleen weights statistics assessed by 2-tailed Student t test. Survival curves assessed by log-rank test. Scale bar = 75 μm. x, no data.
Suppression of NF-κB repressor miR-146a exacerbates MPN pathogenesis. (A-I) Colony assay, leukemic engraftment in the PB, BM at end point, normalized spleen weights, survival curves, and BM histology in the 120770 pMF (A,C,E), 590888 pMF (B,D,F), and NBM2 (G-I) PDX models (n = 5 mice per group). PB human CD45+ (hCD45+) cells statistics assessed by 2-way ANOVA. Relative colony numbers (n = 3 biological replicates), BM hCD45+ and normalized spleen weights statistics assessed by 2-tailed Student t test. Survival curves assessed by log-rank test. Scale bar = 75 μm. x, no data.
Inhibition of IRAK4 with inhibitor CA-4948 alleviates disease burden
Although perturbation of NF-κB pathway effectors RelA/RELA, Myd88, and MIR146A resulted in robust phenotypes, their specific modulation is still currently lacking in the clinical setting. In contrast, small molecule compounds targeting IRAK1 and/or IRAK4 have been approved or are under clinical investigation across a wide spectrum of myeloid malignancies.14 In phase 1/2a trials of relapsed/refractory acute myeloid leukemia (AML) and MDS, the specific IRAK4 inhibitor, CA-4948 (also known as emavusertib), demonstrated tolerance and efficacy with no dose-limiting myelosuppression.30 We thus evaluated whether CA-4948 would have potential as a therapeutic for the treatment of MPN.
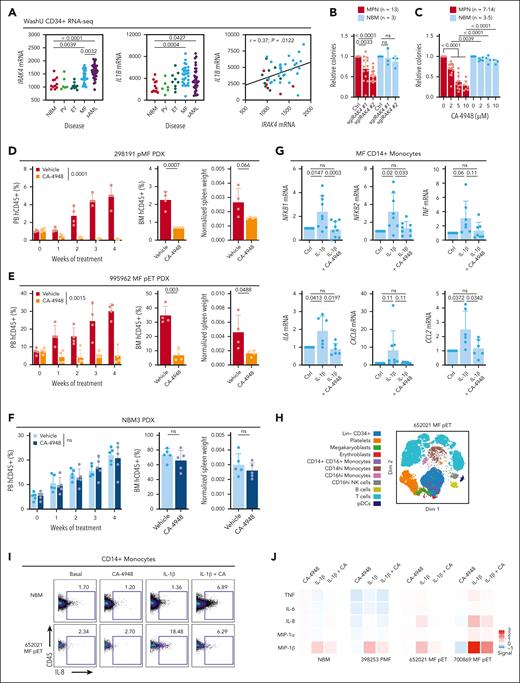
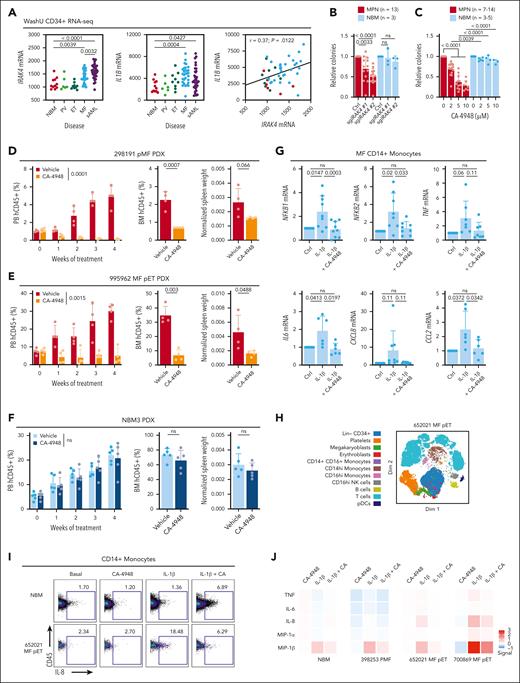
In our Washington University (WashU) cohort16 of RNA sequencing of CD34+ samples encompassing the spectrum of MPN and secondary AML with NBM controls, MF and secondary AML had significant upregulation of IRAK4 and IL1B compared with NBM, and correlation in MPN (Figure 5A), overall suggesting potential dependency and providing further rationale of targeting IRAK4 in this myeloid disorder. IRAK4 knockout using 2 unique sgRNAs significantly reduced CD34+ cell colony formation capacity of patients with MPN but not NBM donors (Figure 5B; supplemental Figure 2A). Similarly, we observed dose-dependent colony formation inhibition upon CA-4948 treatment of MPN samples but not NBM (Figure 5C). Of note, CA-4948 has demonstrated efficacy in diseases preferentially expressing a heightened ratio of the long isoform of IRAK4 (IRAK4-L) to short isoform (IRAK4-S). IRAK4-L was highly expressed (supplemental Figure 2B) and followed the pattern of average IRAK4 expression (Figure 5A), whereas IRAK4-S was minimally detected in our data set. We also assessed whether dual suppression of IRAK4 and JAK2 could have improved therapeutic benefit. Treatment with CA-4948 and low concentrations of ruxolitinib led to further reduction in colony counts than single agent in MPN samples and with minimal toxicity to CD34+ cells from healthy donors (supplemental Figure 2C).
Inhibition of IRAK4 with inhibitor CA-4948 alleviates disease burden. (A) IRAK4 and IL1B messenger RNA expression from the WashU cohort CD34+ RNA sequencing encompassing 90 primary samples representative of PV (n = 6), ET (n = 9), MF (n = 30), secondary AML (sAML, n = 34), and NBM (n = 11). Statistics assessed by 2-tailed Student t test. Pearson correlation noted. (B) Relative colony numbers after IRAK4 knockout from additional unique patients with MPN (n = 13) and NBM donors (n = 3). Statistics were assessed by 2-tailed Student t test comparing MPN and NBM after taking an average of each 3 biological replicates per sample. (C) Relative colony numbers after CA-4948 treatment from unique patients with MPN (n = 7-14 across various doses) and NBM donors (n = 3-5). Statistics were assessed by 2-tailed Student t test comparing MPN and NBM after taking an average of each 3 biological replicates per sample. (D-F) Leukemic engraftment in the PB, BM at end point, and normalized spleen weights in the (D) 298191 pMF (n = 4 mice per group), (E) 995962 MF pET (n = 4 mice per group), and (F) NBM3 (n = 5 mice per group) PDX models. PB human CD45+ (hCD45+) cells statistics assessed by 2-way ANOVA. BM hCD45+ and normalized spleen weight statistics assessed by 2-tailed Student t test. (G) qRT-PCR of genes of interest after 6 hours IL-1β (10 ng/mL) and CA-4948 (2 μM) treatment ex vivo in unique CD14+ MF monocytes (n = 6-9 patients). (H) Dimensionality plot of cell populations from 652021 MF pET from CyTOF analysis. (I) CD14+ monocyte IL-8 expression after ex vivo treatment with IL-1β (10 ng/mL) treatment and CA-4948 (2 μM) by CyTOF analysis. (J) Expression heat map of proinflammatory effectors in CD14+ monocytes in additional MPN and NBM samples. Median arcsinh signals are presented and were normalize to the control treatment group.
Inhibition of IRAK4 with inhibitor CA-4948 alleviates disease burden. (A) IRAK4 and IL1B messenger RNA expression from the WashU cohort CD34+ RNA sequencing encompassing 90 primary samples representative of PV (n = 6), ET (n = 9), MF (n = 30), secondary AML (sAML, n = 34), and NBM (n = 11). Statistics assessed by 2-tailed Student t test. Pearson correlation noted. (B) Relative colony numbers after IRAK4 knockout from additional unique patients with MPN (n = 13) and NBM donors (n = 3). Statistics were assessed by 2-tailed Student t test comparing MPN and NBM after taking an average of each 3 biological replicates per sample. (C) Relative colony numbers after CA-4948 treatment from unique patients with MPN (n = 7-14 across various doses) and NBM donors (n = 3-5). Statistics were assessed by 2-tailed Student t test comparing MPN and NBM after taking an average of each 3 biological replicates per sample. (D-F) Leukemic engraftment in the PB, BM at end point, and normalized spleen weights in the (D) 298191 pMF (n = 4 mice per group), (E) 995962 MF pET (n = 4 mice per group), and (F) NBM3 (n = 5 mice per group) PDX models. PB human CD45+ (hCD45+) cells statistics assessed by 2-way ANOVA. BM hCD45+ and normalized spleen weight statistics assessed by 2-tailed Student t test. (G) qRT-PCR of genes of interest after 6 hours IL-1β (10 ng/mL) and CA-4948 (2 μM) treatment ex vivo in unique CD14+ MF monocytes (n = 6-9 patients). (H) Dimensionality plot of cell populations from 652021 MF pET from CyTOF analysis. (I) CD14+ monocyte IL-8 expression after ex vivo treatment with IL-1β (10 ng/mL) treatment and CA-4948 (2 μM) by CyTOF analysis. (J) Expression heat map of proinflammatory effectors in CD14+ monocytes in additional MPN and NBM samples. Median arcsinh signals are presented and were normalize to the control treatment group.
In PDX experiments, CA-4948 treatment effectively reduced leukemic engraftment and spleen weights of 2 MF models (MF 298191, mutations in JAK2, TET2, and SRSF2; MF post-essential thrombocythemia (pET) 995962, mutations in CALR, SF3B1, and IDH2; Figure 5D-E). No toxicity of CA-4948 treatment was observed in the NBM PDX (Figure 5F), consistent with specific potency of IRAK4 targeting as observed in colony formation assays.
Lastly, given that IL-1β is a canonical agonist of IRAK signaling and NF-κB activation, and that monocytes are a major contributor to proinflammatory cytokine production in MPN, we assessed whether CA-4948 treatment would dampen inflammatory cytokine production and signaling. Indeed, IL-1β stimulation led to increased transcription of NFKB1 and NFKB2, in addition to TNF, IL-6, CXCL8 (IL-8), and CCL2, and this induction was diminished by CA-4948 (Figure 5G). We also performed mass cytometry (CyTOF) experiments of primary samples treated ex vivo with IL-1β and/or CA-4948. In CD14+ monocytes, CA-4948 suppressed IL-1β–induced production of proinflammatory effectors including tumor necrosis factor, IL-6, IL-8, macrophage inflammatory protein-1α (MIP-1α/CCL3), and MIP-1β/CCL4 (Figure 5H-J). These findings demonstrate that targeting of IRAK4 with CA-4948 is efficacious in reducing MPN pathology in a disease-specific manner, and highlight a promising therapeutic avenue for the treatment of MPN.
Discussion
NF-κB hyperactivity and its functional induction of inflammation are hallmarks of many myeloid malignancies including myeloproliferative neoplasms. Here, we demonstrate that genetic or pharmacologic alteration of positive regulators Rela/RELA, Myd88, and IRAK4 led to potent inhibition of disease in relevant syngeneic and PDX MPN mouse models, whereas conversely, suppression of negative regulator MIR146A led to pathogenic exacerbation.
The hematopoietic roles of Rela have been described by Stein and Baldwin, with Rela deletion resulting in deficits in stem cell repopulating activity and altered myeloid differentation.19 The authors observed an increase of total WBC, in particular, granulocytes, in Vav-Cre p65hem−/− animals, without significant alteration to red blood cells or platelet counts examined 20 weeks after transplantation. In our tamoxifen-inducible UBC-Cre-ERT2 models of Rela perturbation, we observe mild suppression of WBCs, hematocrit, and platelets across both shorter and longer term animals who had received transplantation, although counts remained within the healthy normal range. In addition, mild hematopoietic effects were observed in our PDX model in which RELA knockout was performed in healthy donor BM. It is plausible that these phenotypical differences in hematopoiesis may be because of, at least in part, differences in the specific mouse models used (eg, tamoxifen-inducible system vs Vav-Cre). Nonetheless, potent suppression of MPN disease after Rela excision was evident, particularly in the aggressive MPL model. Prior studies demonstrated that Myd88 deletion alone does not significantly affect HSC compartments.20 However, diminished progenitor expansion was observed in response to acute trauma with emergency hematopoiesis being impaired, overall highlighting an important role of an IL-1/MyD88/G-CSF pathway.20 Indeed, in our inflammatory MPN disease models, Myd88 knockout also demonstrated profound effects on reduction of disease burden and reduction in total LSK cells. Although RelA perturbation suppressed WBCs across both mutant MPL and Jak2 models, platelets were reduced in the MPL model and increased in the Jak2 model. These differences may be related to downstream signaling mediated by mutant JAK2 vs MPL, as reflected by their overlapping but distinct clinical associations (ie, JAK2 V617F found in PV, ET, and MF; MPL W515L restricted to ET and MF).31
These murine studies highlight the critical dependency of NF-κB signaling in diseased models. As such, therapeutic prowess of several preclinical and clinical grade inhibitors that co-target NF-κB signaling are currently under investigation and across multiple myeloid malignancies. Among these include small molecules targeting IRAK1 and/or IRAK4, including emerging compounds NCGC1481, R289, and CA-4948.14 Here, we provide promising preclinical efficacy of CA-4948 for the treatment of MPN across patient samples and PDX models. As a targeting rationale, the elevated expression of the long isoform of IRAK4 in CD34+ cells across high-grade disease of MF and post-MPN secondary AML relative to normal donors provide further evidence that heightened inflammation could be governing disease transformation. This elevated expression may also underly the observed preferential sensitivity to IRAK4 inhibition through genetic and pharmacological means and minimal toxicity to normal cells.
Potent antileukemic efficacy was observed with CA-4948 monotherapy, although the addition of low-dose ruxolitinib further suppressed colony formation across primary samples ex vivo. As such, further exploration of combinational therapy of JAK2 and IRAKs targeting may hold merit, particularly in clinical evaluation. Pacritinib is an US Food and Drug Administration–approved JAK2 inhibitor, which also has affinity in cotargeting FLT3 and IRAK1. We previously demonstrated that pacritinib was most potent in the inhibition of colony formation and proinflammatory cytokines, and reduction of leukemic engraftment in MPN PDX models compared with other approved JAK2 inhibitors including ruxolitinib (JAK1/2), fedratinib (JAK2/FLT3), and momelotinib (JAK2/ACVR1).22 Further dissection of the relative contributions of JAK2 and IRAK targeting, either via a single agent (eg, pacritinib) or via a combination approach (with selective inhibitors) requires further evaluation. Recently, the TakeAim Leukemia study evaluating CA-4948 has established a recommended phase-2 dose of 300 mg twice a day treatment for patients with R/R AML and MDS, and continues ongoing clinical evaluation.32
Taking these results together, we propose that targeting dependent pathways beyond JAK2 such as NF-κB could be equally, if not more, efficacious for patients with MPN with the potential to mitigate hematological toxicities.
Acknowledgments
The authors thank Diane Bender, Roderick Lin, and Kristin Link for assistance with mass cytometry experiments. The authors are grateful to Ross Levine (Memorial Sloan Kettering Cancer Center) for providing the MPL W515L retroviral construct and Ann Mullally (Dana-Farber Cancer Institute) for the Jak2 V617F knockin mice.Technical support was provided by the Alvin J. Siteman Cancer Center Tissue Procurement Core Facility, Flow Cytometry Core, Barnes-Jewish Hospital, Institute of Clinical and Translational Sciences, Barnard Cancer Institute, and Immunomonitoring Laboratory, which are supported by grants from the National Institutes of Health (NIH), National Center for Advancing Translational Sciences (UL1 TR002345), NIH, National Cancer Institute (P30CA91842), and by the Andrew M. and Jane M. Bursky Center for Human Immunology and Immunotherapy Programs.
Authorship
Contribution: A.B.A.L., T.K., M.C.F., and D.A.C.F. performed experiments and/or data analysis; M.C.F. and D.T.S. provided technical support; A.B.A.L., and S.T.O. designed and supervised the experiments; A.B.A.L., T.K., and S.T.O. wrote the manuscript; and all authors read and approved the manuscript.
Conflict-of-interest disclosure: S.T.O. has served as a consultant for Kartos Therapeutics, CTI BioPharma, Celgene/Bristol Myers Squibb, Disc Medicine, Protagonist Therapeutics, blueprint Medicines, Cogent, PharmaEssentia, Constellation, Geron, AbbVie, Sierra Oncology, and Incyte. D.T.S. serves on the scientific advisory board at Kurome Therapeutics; is a consultant for and/or received funding from Kurome Therapeutics, Captor Therapeutics, Treeline Biosciences, and Tolero Therapeutics; and has equity in Kurome Therapeutics. The remaining authors declare no competing financial interests.
Correspondence: Stephen T. Oh, Washington University School of Medicine, 660 S. Euclid Ave, Campus Box 8125, St. Louis, MO 63110; email: stoh@wustl.edu.
References
Author notes
A.B.A.L. and T.K. contributed equally to this study.
Mass cytometry and sequencing data are available upon request from the corresponding author, Stephen T. Oh (stoh@wustl.edu); RNA sequencing data are provided in supplemental Table 1.
The online version of this article contains a data supplement.
There is a Blood Commentary on this article in this issue.
The publication costs of this article were defrayed in part by page charge payment. Therefore, and solely to indicate this fact, this article is hereby marked “advertisement” in accordance with 18 USC section 1734.

![Myd88 ablation alleviates MPN disease burden. (A) Schematic of TLR-mediated NF-κB signaling cascade. (B) Schematic of the Myd88−/−MPLW515L mouse model. (C) WBC counts of MPL (n = 8) and MPL-Myd88−/− (n = 8) mice. Statistics were assessed by 2-way ANOVA. Light gray regions indicate the normal reference range. (D) Monocyte, BM CD45.2 myeloid cells, hematocrit, and platelet counts at end point (MPL [n = 8], MPL-Myd88−/− [n = 7]). Statistics were assessed by 2-tailed Student t test. (E) Normalized spleen weight at end point. Statistics were assessed by 2-tailed Student t test. (F) Percentage of HSCs of BM cells. (G) Distribution of hematopoietic progenitor populations at end point. Statistics were assessed by 2-tailed Student t test. (H) Kaplan-Meier survival curve. Statistics were assessed by log-rank test. (I) Histology of the spleen and BM at end point. Scale bar = 75 μm. Histology of the spleen and BM at end point. Scale bar = 75 μm. BM fibrosis was scored from 3 mice in each group.](https://ash.silverchair-cdn.com/ash/content_public/journal/blood/143/23/10.1182_blood.2023022804/2/m_blood_bld-2023-022804-gr3.jpeg?Expires=1769097715&Signature=MEY9JR5CyLCv6Y3F4wi8hAS03PUCj5DLFAUEtxaXDM~gWc5usFweXQboL0xwTYawRhIowa9OC--YkdkmkFTCiZNIL8hB5YzB9-qANqkw5RnpeyMlhX6M9bcuRe1FEG-fmzHYCJWNGjYDfcyn6hQB0fBPm0rOyIyCYowEIip-up7HiIbCD4Eoz4bYTg0lcPp9Y0MG9luYa5lLY7c~sbfoGuIji85-oqlj0Y3xsGeQgcBk-jN7SHxMzip~-dKRhaBWtIGL2sE7AHc1PGvp7~eU9rBaUIKIMZN~M-6uhKnqwRudXBDpfd-eEEcP8RFXYnvh5lfvxhU2Os4n95J7JprItQ__&Key-Pair-Id=APKAIE5G5CRDK6RD3PGA)


![Myd88 ablation alleviates MPN disease burden. (A) Schematic of TLR-mediated NF-κB signaling cascade. (B) Schematic of the Myd88−/−MPLW515L mouse model. (C) WBC counts of MPL (n = 8) and MPL-Myd88−/− (n = 8) mice. Statistics were assessed by 2-way ANOVA. Light gray regions indicate the normal reference range. (D) Monocyte, BM CD45.2 myeloid cells, hematocrit, and platelet counts at end point (MPL [n = 8], MPL-Myd88−/− [n = 7]). Statistics were assessed by 2-tailed Student t test. (E) Normalized spleen weight at end point. Statistics were assessed by 2-tailed Student t test. (F) Percentage of HSCs of BM cells. (G) Distribution of hematopoietic progenitor populations at end point. Statistics were assessed by 2-tailed Student t test. (H) Kaplan-Meier survival curve. Statistics were assessed by log-rank test. (I) Histology of the spleen and BM at end point. Scale bar = 75 μm. Histology of the spleen and BM at end point. Scale bar = 75 μm. BM fibrosis was scored from 3 mice in each group.](https://ash.silverchair-cdn.com/ash/content_public/journal/blood/143/23/10.1182_blood.2023022804/2/m_blood_bld-2023-022804-gr3.jpeg?Expires=1769179595&Signature=B8gXwZ~aDVKw5VFf08dXVZ3UH9VwZQRHH6QtHWamzo6VzdF~~gEO-vfSgGMD7-NXZoU8EYAIuGjVEcTbfMbULP4uqVWzB83-JTM~NqBmbLwqUdnTBjOvkRTX457psBS00vD6iHbOb57z54b1xvCmnkNO57sr6IdKsxbcF-IauzRDB3Ne00Gq1wbPR3OoL1cTvDxW0xzMP8iyKfpa6hn9~7pYoUGwcNotQTc8EaL0CaMHOJdk4gWnbK~ghJAS3R~HxRZ-SvtV4H-3BIiFoRhRMcBSiqMhlofR5tuxy2JMsnSFtMryqNy2~bc2AQCu~SXC5BRzZq5A1jI~w6GJhp1Zew__&Key-Pair-Id=APKAIE5G5CRDK6RD3PGA)
