Key Points
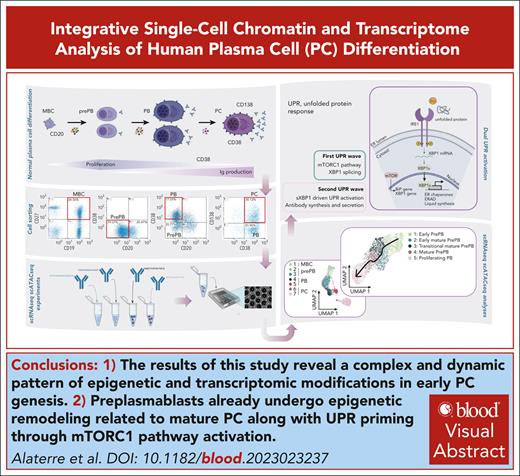
Our results illustrate a complex and dynamic pattern of epigenetic and transcriptomic modifications in early PC genesis.
Preplasmablasts already undergo epigenetic remodeling related to mature PC together with unfolded protein response priming through mTORC1 pathway activation.
Visual Abstract
Plasma cells (PCs) are highly specialized cells representing the end stage of B-cell differentiation. We have shown that PC differentiation can be reproduced in vitro using elaborate culture systems. The molecular changes occurring during PC differentiation are recapitulated in this in vitro differentiation model. However, a major challenge exists to decipher the spatiotemporal epigenetic and transcriptional programs that drive the early stages of PC differentiation. We combined single cell (sc) RNA sequencing (RNA-seq) and assay for transposase-accessible chromatin with high throughput sequencing (scATAC-seq) to decipher the trajectories involved in PC differentiation. ScRNA-seq experiments revealed a strong heterogeneity of the preplasmablastic and plasmablastic stages. Among genes that were commonly identified using scATAC-seq and scRNA-seq, we identified several transcription factors with significant stage specific potential importance in PC differentiation. Interestingly, differentially accessible peaks characterizing the preplasmablastic stage were enriched in motifs of BATF3, FOS and BATF, belonging to activating protein 1 (AP-1) transcription factor family that may represent key transcriptional nodes involved in PC differentiation. Integration of transcriptomic and epigenetic data at the single cell level revealed that a population of preplasmablasts had already undergone epigenetic remodeling related to PC profile together with unfolded protein response activation and are committed to differentiate in PC. These results and the supporting data generated with our in vitro PC differentiation model provide a unique resource for the identification of molecular circuits that are crucial for early and mature PC maturation and biological functions. These data thus provide critical insights into epigenetic- and transcription–mediated reprogramming events that sustain PC differentiation.
Introduction
Plasma cells (PCs) are highly specialized cells representing the end stage of B-cell differentiation. They play an important role in humoral immunity.1 On the transcriptional level, the differentiation of B cells into PCs is associated with substantial and coordinated changes.2-5
Several in vitro models of human B to PC differentiation (PCD) were reported.6-11 These systems could be used for functional interrogation in human cells related to the different stages of B to PC differentiation and are suited to high-throughput molecular characterization and experiments.2,3,12-14 We have shown that PC generation can be modeled using multistep culture systems where various combinations of activation molecules and cytokines are subsequently applied in order to reproduce the sequential cell differentiation occurring in the different organs/tissues in vivo. In this model, memory B cells (MBCs) differentiate into preplasmablasts (prePBs), plasmablasts (PBs), early PCs and, finally, into long-lived PCs, which may survive and produce continuously high amounts of immunoglobulins for months in vitro.8 The phenotype of in vitro-generated PBs is similar to the phenotype of the few PBs detected in the peripheral blood.6-8 Moreover, the molecular events occurring during differentiation of B cells into PCs are recapitulated in this in vitro differentiation model.2,6,8,15
Recently, we used next-generation sequencing technology to generate a comprehensive transcriptome database encompassing human in vitro PCD. Our results reveal 8419 differentially expressed genes classified into 4 temporal gene expression patterns2. Additionally, our analysis revealed numerous novel transcriptional regulators and helicases (BATF2, BHLHA15/MIST1, EZH2, WHSC1/MMSET, BLM and MYB) with consistent stage-specific overexpression and potential importance in PCD. Furthermore, our analysis revealed the upregulation of epigenetic factors at the prePB stage, a critical step during which cells actively proliferate and start secreting immunoglobulins. Finally, we have experimentally validated a role of for the BLM helicase and the histone methytransferase EZH2 in regulating cell survival, proliferation and maturation in PCD.16,17 However, a major challenge exists to decipher the spatiotemporal epigenetic and transcriptional programs that drive the early stages of PCD.18,19
In this study, we combined single cell (sc) RNA sequencing (RNA-seq) and assay for transposase-accessible chromatin with high throughput sequencing (scATAC-seq) to decipher the trajectories involved in PCD. Our analyses reveal considerable transcriptional and epigenetic heterogeneity during the preplasmablastic stage of human PCD. Epigenetic analysis of the different stages suggests that BATF3-target genes may represent a key transcriptional node involved in PCD. Integration of transcriptome and epigenetic data at the single cell level showed that some prePBs already had an epigenetic profile similar to that of PCs in association with endoplasmic reticulum priming.
Materials and methods
Cell cultures
Peripheral blood cells from healthy donors were purchased from the French Blood Center (Toulouse, France) and CD19+CD27+ MBCs were purified as described.6 From purified peripheral blood MBCs, prePB, PB, and PCs were generated using a three-step in vitro model as reported.6,7 Standard culture conditions comprised 21% O2, 5% CO2, and 37°C and cells were cultured in Iscove’s modified Dulbecco medium (Invitrogen, Waltham, MA) supplemented with 10% fetal bovine serum (Eurobio, Les Ulis, France). MBCs (1.5 × 10⁵ cells per mL) were doubly activated for 4 days by CpG oligodeoxynucleotide and CD40 ligand using a cocktail comprising 10 μg/mL of phosphorothioate CpG oligodeoxynucleotide 2006 (Sigma-Aldrich, St. Louis, MO), 50 ng/mL of histidine tagged sCD40L (R&D Systems, Minneapolis, MN) and 5 μg/mL of anti-poly-histidine monoclonal antibody (mAb; R&D systems) with interleukin 2 (IL-2) (400 U/mL) (R&D systems), IL-10 (50 ng/mL) (R&D systems) and IL-21 (100 ng/mL) (PeproTech, Cranbury, NJ) cytokines in six-well culture plates. PBs were generated from prePBs (2.5 × 10⁵ cells per mL) by removing activating molecules and changing cytokine cocktail composed of IL-2 (400 U/mL), IL-6 (50 ng/mL) (PeproTech), IL-10 (50 ng/mL) and IL-15 (10 ng/mL) (PeproTech). Finally, PBs (5.0 × 10⁵ cells per mL) were differentiated into PCs adding IL-6 (50 ng/mL), IL-15 (10 ng/mL) and IFN-α (500 U/mL) (R&D Systems).
Flow cytometry and cell sorting
PrePBs, PBs, and PCs were respectively purified at day (D) 4, D7, and D10 using FACS Aria cell sorter (Becton Dickinson, Franklin Lakes, NJ) with a purity >95% as well as peripheral blood MBCs. MBCs were sorted using allophycocyanin (APC)–conjugated anti-CD19 mAb and PE-conjugated anti-CD27 (BD Biosciences, no. 555415 and no. 555441, respectively). Cells produced in the culture system during differentiation were sorted using fluorescein (FITC)-conjugated anti-CD20, PE-conjugated anti-CD38 and APC–conjugated anti-CD138 mAbs (Beckman Coulter, Brea; no. 6602381, no. A07779 and no. B49219, respectively) for D4 prePBs (CD20−CD38−), D7 PBs (CD20−CD38+CD138−), D10 PCs (CD20−CD38+CD138+).
Supplemental information concerning methodology are included in supplemental Experiment procedures, available on the Blood website.
Results
Transcriptional features of stages during normal B to PC differentiation
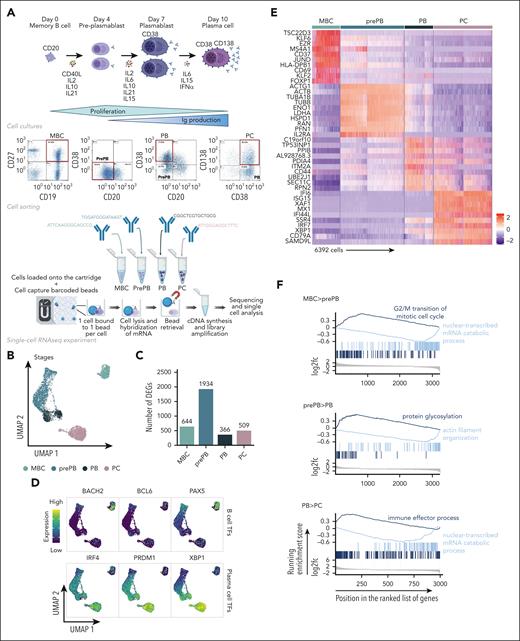
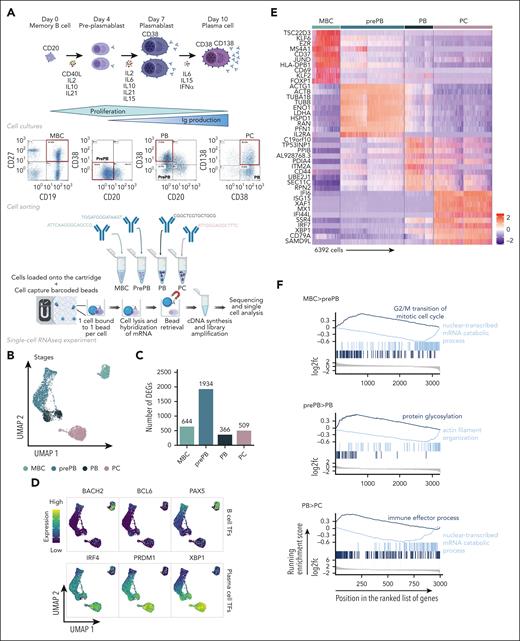
The experimental strategy applied to obtain single-cell RNA-seq profiles on the 4 populations generated during B to normal PCD is illustrated in Figure 1A. The uniform manifold approximation and projection (UMAP) of the 6392 cells showed 3 distinct compartments composed of MBCs, PCs, and prePB/PB cells (Figure 1B). This projection revealed a highly specific transcriptomic profile for MBCs and PCs, and a strong heterogeneity of the prePB and PB without a clear distinction between the 2 populations. There was no distinction between the replicates of cells generated with MBCs from the 2 healthy donors (supplemental Figure 1). Each stage exhibited more than 300 differentially expressed genes that helped clearly distinguish the stages (Figure 1C). When we compared each stage with the rest of the data set, the prePB stage presented the most differentially expressed genes with almost 2000 differentially expressed genes (DEGs) showing that the most important changes take place during this stage. As expected, B-cell transcription factors (TFs) (PAX5, BCL6 and BACH2) were expressed in MBCs, whereas the PC TFs (IRF4, PRDM1 and XBP1) were strongly expressed in PCs (Figure 1D). The heat map of the top 10 DEGs of the 4 stages showed dynamic changes during B to normal PCD (Figure 1E). We then focused on genes that are differentially regulated during transitions, from MBCs to prePB, after B-cell activation; from prePB to PB, when cells start to secrete antibody; and from PB to PCs. Gene set enrichment analysis of these deregulated genes validated the results previously reported using bulk RNA-seq analyses (Figure 1F; supplemental Table 1).7,20
Single-cell transcriptomics analysis of MBCs, prePBs, plasmablasts and PCs during B to PC differentiation. (A) Schematic representation of the in vitro model of B to PC differentiation. MBCs from human peripheral blood were purified and cultured with activating molecules, sCD40L and oligodeoxynucleotides, and cytokines, IL-2, IL-10, and IL-21 to obtain prePBs at day 4. Cells were then cultured with IL-2, IL-6, IL-10, IL-15, and IL-21 cytokines to obtain PBs at day 7. Finally, PBs were cultured with IL-6, IL-15, and IFNα until day 10 to obtain PCs. Flow cytometry gating of CD19+/CD27+ MBCs at day 0, CD20−/CD38− prePBs at day 4, CD20−/CD38+ PBs at day 7 and CD38+/CD138+ PCs at day 10. Schematic representation of the BD Rhapsody single-cell analysis system used in this study. MBC, prePB, PB, and PC were thawed and tagged with 4 different tags to associate, after sequencing, each read to 1 stage. The 4 populations (almost 10 000 cells) were pooled and loaded onto a cartridge composed of more than 200 000 wells. Unique barcoded beads were added in excess and after washing, each cell was associated to a unique bead, allowing the association of each read to a unique cell. Then, cells were lysed and messenger RNA (mRNA) was hybridized on the beads. To finish, beads were recovered to synthetize complementary DNA and amplify libraries prior to sequence. (B) UMAP representation of the 4 stages identified using tags and demultiplexing. (C) Number of positive differentially expressed genes identified for the 4 stages using pairwise comparisons (one stage vs all other cells). (D) mRNA expression of B-cell TFs: BACH2, BCL6 and PX5; and PC TFs: IRF4, PRDM1 and XBP1. (E) Heat map of the top 10 genes upregulated of each stage. (F) Gene ontology enrichment analysis showing both pathways enriched in upregulated and downregulated genes during transitions: from MBC to prePB, from prePB to PB and from PB to PC.
Single-cell transcriptomics analysis of MBCs, prePBs, plasmablasts and PCs during B to PC differentiation. (A) Schematic representation of the in vitro model of B to PC differentiation. MBCs from human peripheral blood were purified and cultured with activating molecules, sCD40L and oligodeoxynucleotides, and cytokines, IL-2, IL-10, and IL-21 to obtain prePBs at day 4. Cells were then cultured with IL-2, IL-6, IL-10, IL-15, and IL-21 cytokines to obtain PBs at day 7. Finally, PBs were cultured with IL-6, IL-15, and IFNα until day 10 to obtain PCs. Flow cytometry gating of CD19+/CD27+ MBCs at day 0, CD20−/CD38− prePBs at day 4, CD20−/CD38+ PBs at day 7 and CD38+/CD138+ PCs at day 10. Schematic representation of the BD Rhapsody single-cell analysis system used in this study. MBC, prePB, PB, and PC were thawed and tagged with 4 different tags to associate, after sequencing, each read to 1 stage. The 4 populations (almost 10 000 cells) were pooled and loaded onto a cartridge composed of more than 200 000 wells. Unique barcoded beads were added in excess and after washing, each cell was associated to a unique bead, allowing the association of each read to a unique cell. Then, cells were lysed and messenger RNA (mRNA) was hybridized on the beads. To finish, beads were recovered to synthetize complementary DNA and amplify libraries prior to sequence. (B) UMAP representation of the 4 stages identified using tags and demultiplexing. (C) Number of positive differentially expressed genes identified for the 4 stages using pairwise comparisons (one stage vs all other cells). (D) mRNA expression of B-cell TFs: BACH2, BCL6 and PX5; and PC TFs: IRF4, PRDM1 and XBP1. (E) Heat map of the top 10 genes upregulated of each stage. (F) Gene ontology enrichment analysis showing both pathways enriched in upregulated and downregulated genes during transitions: from MBC to prePB, from prePB to PB and from PB to PC.
Single-cell chromatin accessibility reveals an overrepresentation of AP-1 TFs in the prePB stage
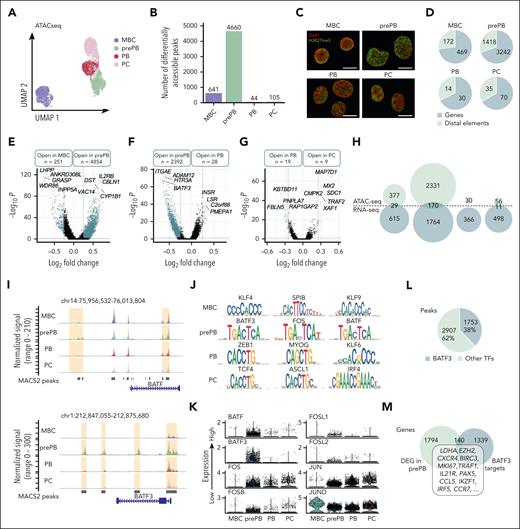
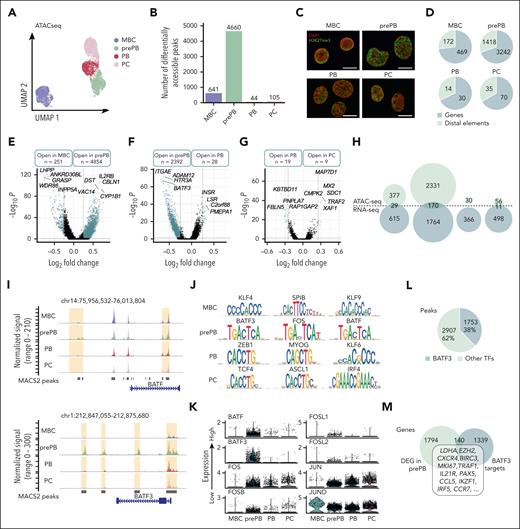
To determine the variations in chromatin opening accompanying B to PCD, we applied scATAC-seq, profiling in total 7721 individual cells. PrePB, PB and PC stages were clearly separated from the MBC stage on the UMAP representation using peaks identified using model-based analysis of chromatin immunoprecipitation sequence 2 (MACS2; Figure 2A).21 The number of differentially accessible peaks was higher in prePB (4660) than in other stages (MBC: 641; PB: 44; PC: 105) (Figure 2B). A fraction of cells at the prePB, PB, and PC was characterized by very similar ATAC-seq profiles, highlighting a strong similarity in chromatin structure even if prePB and PB cells are very different from PC at the transcriptomic level (Figure 1B). Interestingly, we observed a clear-cut chromatin decompaction at the prePB stage (Figure 2C), which is associated with a large number of ATAC-seq peaks (Figure 2B). Moreover, the number of differentially accessible regions identified in each stage using scATAC-seq strongly correlated with the number of differentially expressed genes identified using scRNA-seq (R2 = 0.9949; P < .001) (supplemental Figure 2). The annotation of these differentially accessible peaks in each stage revealed a higher proportion of peaks localized on genes than on distal elements (Figure 2D). Pairwise comparisons between MBC and prePB, prePB, and PB, and PB vs PC showed that the greatest chromatin changes were observed between MBC and prePB (251 open peaks in MBC and 4854 in prePB) after B-cell activation (Figure 2D-G). We also observed significant changes between prePB and PB. Among genes that were differentially expressed at the transcriptome level, 29 genes for MBC, 170 genes for prePB and 11 genes for PC presented also chromatin remodeling (Figure 2H). These results revealed that B-cell activation led to major epigenetic and transcriptomic remodeling. Among genes that were commonly identified using ATAC-seq and RNA-seq, we identified TFs such as FOXP1 and PAX5 for MBC; ARID3A, BATF, BATF3, E2F4, ETS1, IKZF1, IRF2, MYB, SOX4, SPIB, SREBF2, STAT3, TFDP1 and ZNF511 for prePB; and finally, PRDM1 for PC (Table 1). Motif enrichment analysis using JASPAR and CIS-BP databases revealed a significant enrichment of motifs related to all the TF identified in the study and listed in Table 1 except ZNF511 (supplemental Resource 1). BATF and BATF3 had differentially accessible peaks localized on the core gene and on distal elements (Figure 2I). Interestingly, differentially accessible peaks characterizing the prePB stage were enriched in motifs of BATF3, FOS and BATF belonging to the AP-1 TF family19 (Figure 2J). In MBC, we found peaks enriched in KLF4, SPIB and KLF9 TF motifs, whereas, an enrichment in TCF4, ASCL1 and IRF4 motifs was identified in PCs. At the single cell level, the majority of prePB had a medium to high expression of AP-1 TF family (BATF, BATF3, FOS, FOSB, FOSL1, FOSL2, JUN and JUND)19 (Figure 2K). Moreover, among the differentially accessible peaks in the prePB stage, 38% presented BATF3 motif (Figure 2L) corresponding to 1479 genes potentially regulated by BATF3 TF (Figure 2M). Among these genes, we identified 140 genes also upregulated in prePB, including LDHA, EZH2, CXCR4, BIRC3, MKI67, TRAF1, IL21R, PAX5, CCL5, IKZF1, IRF5 and CCR7. The significant overexpression of BATF3 TF was validated at protein level in prePB (supplemental Figure 3A-B). Because BATF3 TF was previously identified operating in short impulse manner at the prePB stage,2 BATF3 target genes may represent a key transcriptional node involved in PCD.
Single-cell chromatin accessibility of MBCs, prePBs, plasmablasts, and PCs during B to PC differentiation. (A) UMAP representation of the 4 stages analyzed separately and then merged together. Peaks detected with MACS2 peak calling were used for UMAP representation. (B) Number of differentially accessible peaks identified for the 4 stages using pairwise comparisons (one stage vs all other cells). (C) Cells were fixed with 4% paraformaldehyde for 10 minutes at different time points: MBCs (day 0), PrePBs (day 4), PBs (day 7), and PCs (day 10). Immunofluorescence to detect H3K27me3 levels (green) was performed with an anti-H3K27me3 antibody. DNA was stained with DAPI (4′,6-diamidino-2-phenylindole) (red). Scale bar, 10 μm. (D) Proportion of peaks localized on genes (in blue) and distal elements (in green) for each stage. (E-G) Volcano plots of differentially accessible peaks identified during transitions: from MBC to prePB, from prePB to PB, and from PB to PC, respectively. Peaks identified as significantly accessible were colored in blue (P value <.05 and log2(fold change) > 0.25). (H) Venn diagrams representing genes that were upregulated in RNA-seq data set (in blue) and/or associated with more open chromatin in ATAC-seq data set (in green). (I) Peak tracks of BATF and BATF3 revealing differentially accessible peaks on BATF and BATF3 genes and on distal elements. (J) TF motif enrichment of differentially accessible peaks for each stage. (K) mRNA expression of TFs belonging to the AP-1 family in the 4 stages using the RNA-seq data set. (L) Proportion of differentially accessible peaks in the prePB stage enriched in BATF3 motif. (M) Venn diagram of the number of genes upregulated in the prePB stage identified using the RNA-seq data set and the number of genes associated with a more open chromatin enriched in BATF3 motif identified using ATAC-seq data set. Common genes represented potential BATF3 targets.
Single-cell chromatin accessibility of MBCs, prePBs, plasmablasts, and PCs during B to PC differentiation. (A) UMAP representation of the 4 stages analyzed separately and then merged together. Peaks detected with MACS2 peak calling were used for UMAP representation. (B) Number of differentially accessible peaks identified for the 4 stages using pairwise comparisons (one stage vs all other cells). (C) Cells were fixed with 4% paraformaldehyde for 10 minutes at different time points: MBCs (day 0), PrePBs (day 4), PBs (day 7), and PCs (day 10). Immunofluorescence to detect H3K27me3 levels (green) was performed with an anti-H3K27me3 antibody. DNA was stained with DAPI (4′,6-diamidino-2-phenylindole) (red). Scale bar, 10 μm. (D) Proportion of peaks localized on genes (in blue) and distal elements (in green) for each stage. (E-G) Volcano plots of differentially accessible peaks identified during transitions: from MBC to prePB, from prePB to PB, and from PB to PC, respectively. Peaks identified as significantly accessible were colored in blue (P value <.05 and log2(fold change) > 0.25). (H) Venn diagrams representing genes that were upregulated in RNA-seq data set (in blue) and/or associated with more open chromatin in ATAC-seq data set (in green). (I) Peak tracks of BATF and BATF3 revealing differentially accessible peaks on BATF and BATF3 genes and on distal elements. (J) TF motif enrichment of differentially accessible peaks for each stage. (K) mRNA expression of TFs belonging to the AP-1 family in the 4 stages using the RNA-seq data set. (L) Proportion of differentially accessible peaks in the prePB stage enriched in BATF3 motif. (M) Venn diagram of the number of genes upregulated in the prePB stage identified using the RNA-seq data set and the number of genes associated with a more open chromatin enriched in BATF3 motif identified using ATAC-seq data set. Common genes represented potential BATF3 targets.
Integrating scRNA-seq and scATAC-seq reveals a more mature subpopulation of prePB characterized by an epigenetic profile of PC
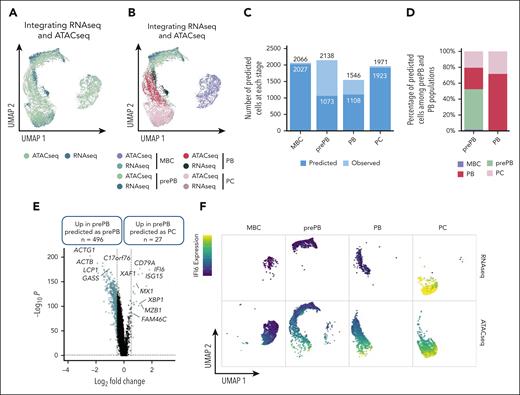
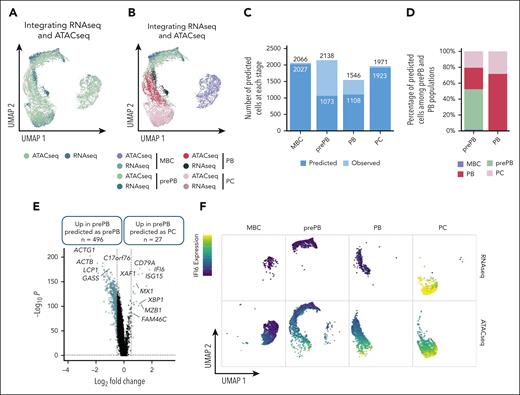
To integrate scRNA-seq and scATAC-seq datasets, we used the top 50 differentially expressed genes from each stage identified with scRNA-seq data set to find anchors and predict cell stage of scATAC-seq data set. For the scATAC-seq data set, a gene activity matrix was calculated using the number of reads localized within genes. UMAP representation of transferred data showed a good superposition of scRNA-seq and scATAC-seq datasets, in particular for MBC and PC stages (Figure 3A-B). Almost half of the prePB from the ATAC-seq data set were not predicted as prePB and almost a quarter of the PB were not predicted as PB (Figure 3C). Interestingly, the remaining prePB were predicted as PB and PC and the remaining PB were predicted as PC (Figure 3D), revealing that some prePB and PB were characterized by a more mature epigenetic profile. Pairwise comparison between prePB predicted as prePB and prePB predicted as PC revealed key marker genes of PC including XBP1, FAM46C,20MZB122 or BTG212 (Figure 3E; supplemental Table 2). These data underline that a subpopulation of prePBs had already undergone epigenetic remodeling related to PC profile. Using RNA-seq data, the PC cell genes, such as IFI6, associated with open chromatin in prePB are still not expressed compared with mature PC (Figure 3F). To validate these results, we performed ChIP-seq of the histone marks H3K4me3, H3K27ac and H3K36me3. H3K36me3 is associated with transcriptional elongation in the gene body, H3K27ac with active regulatory elements including enhancers and promoters, and H3K4me3 with active/promiscuous promoters. The PC genes FAM46C, XBP1, MZB1 and IFI6 already showed active chromatin marks in prePB cells (supplemental Figure 4). These results suggested that a population of prePB is already committed to generating antibody-secreting cells.
Integration of scRNA-seq and scATAC-seq data sets. (A-B) UMAP representation of scRNA-seq and scATAC-seq merged data set. First, using the top 50 differentially expressed genes of each stage from the scRNA-seq data set and the number of reads within genes of interest from the scATACseq data set, a gene activity matrix was calculated for scATAC-seq data set to find and set anchors. Gene expression values of scATAC-seq data set were predicted using the global gene expression values of scRNA-seq data set and identified anchors. Both scRNA-seq and scATAC-seq gene expression matrixes were finally merged. (C) Number of cells predicted using the gene activity matrix vs actual number of observed cells at each stage (MBC, prePB, PB, and PC). (D) Percentage of prePB and PB predicted as MBC, prePB, PB, and PC. (E) Volcano plot showing differentially expressed genes (using the gene activity matrix) between the prePB predicted as prePB and the prePB predicted as PC. Genes identified as significantly differentially expressed were colored in blue (P value <.05 and log2(fold change) >0.25). (F) IFI6 expression observed in MBC, prePB, PB, and PC using scRNA-seq (top) and scATAC-seq (bottom) data sets. High and low expression were represented in dark blue and in yellow, respectively.
Integration of scRNA-seq and scATAC-seq data sets. (A-B) UMAP representation of scRNA-seq and scATAC-seq merged data set. First, using the top 50 differentially expressed genes of each stage from the scRNA-seq data set and the number of reads within genes of interest from the scATACseq data set, a gene activity matrix was calculated for scATAC-seq data set to find and set anchors. Gene expression values of scATAC-seq data set were predicted using the global gene expression values of scRNA-seq data set and identified anchors. Both scRNA-seq and scATAC-seq gene expression matrixes were finally merged. (C) Number of cells predicted using the gene activity matrix vs actual number of observed cells at each stage (MBC, prePB, PB, and PC). (D) Percentage of prePB and PB predicted as MBC, prePB, PB, and PC. (E) Volcano plot showing differentially expressed genes (using the gene activity matrix) between the prePB predicted as prePB and the prePB predicted as PC. Genes identified as significantly differentially expressed were colored in blue (P value <.05 and log2(fold change) >0.25). (F) IFI6 expression observed in MBC, prePB, PB, and PC using scRNA-seq (top) and scATAC-seq (bottom) data sets. High and low expression were represented in dark blue and in yellow, respectively.
Pseudotemporal analysis of prePB and PB subpopulations by single-cell transcriptomic analysis
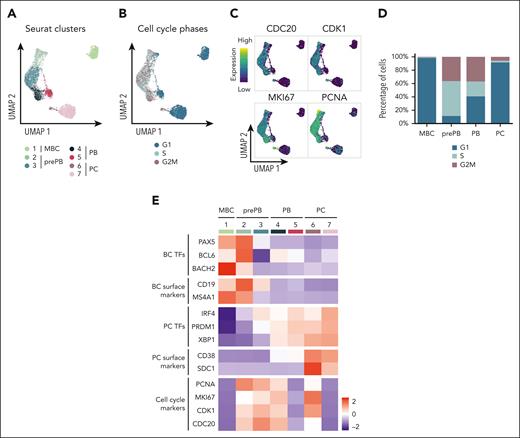
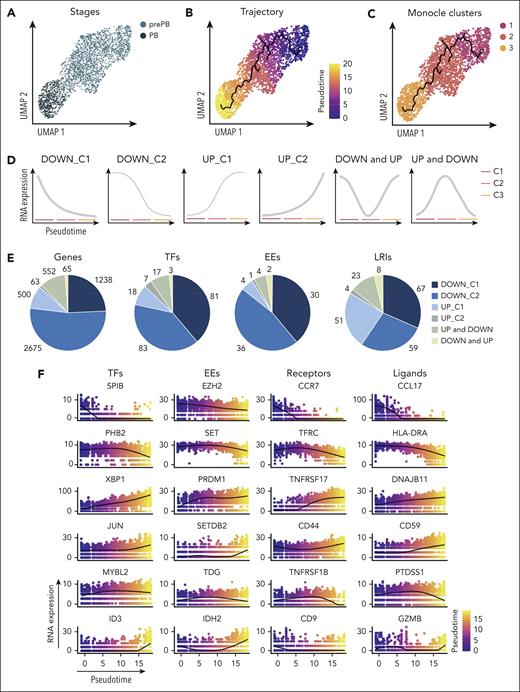
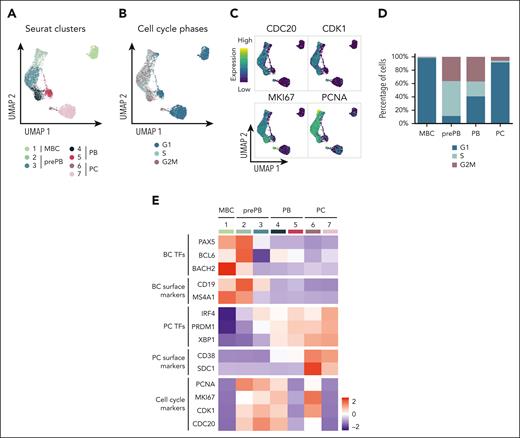
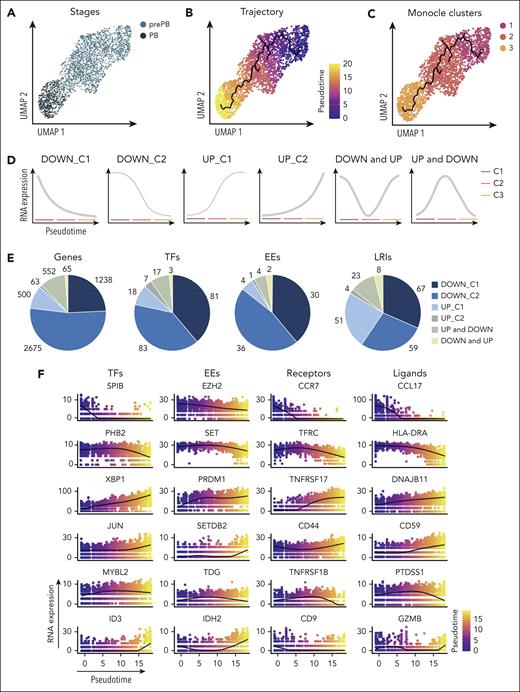
K-nearest neighbors-based clustering revealed 7 subpopulations including MBC in cluster 1, prePB in clusters 2 and 3, PB in clusters 4 and 5, and PC in clusters 6 and 7 (Figure 4A; supplemental Figure 5A). Approximately 40% of the analyzed cells displayed a transcriptional profile associated with S-G2-M stages of the cell cycle (Figure 4B-C; supplemental Figure 5B) represented mainly by prePB and PB6 (Figure 4D-E). We selected only prePB and PB associated to S-G2-M stages to focus on the processes occurring during the transition from prePB to PB, while minimizing biases from cell-cycle states (Figure 5A). To unravel potential differentiation trajectories and understand the progression between stages, cells were computationally ordered along pseudotime computed using Monocle 3 (Figure 5B-C). We focused on genes differentially regulated along this trajectory, in particular genes coding TFs, epigenetic regulators and proteins involved in ligand/receptor interactions (supplemental Table 3). We identified 6 groups of deregulated genes: genes downregulated in cluster 1 (early prePB), genes downregulated in cluster 2 (mature prePB), genes upregulated in cluster 1, genes upregulated in cluster 2, genes first downregulated and then upregulated (impulsed down) and the opposite (impulsed up) (Figure 5D). The majority of differentially expressed genes are downregulated (78.8%), and mostly in C2 (52.5%) (Figure 5E). Among TFs, BATF3, IRF5, RUNX3, SPIB, PAX5, STAT5A, AHR, JUNB, STAT6 and KLF6 were downregulated in the first instance, and PHB2, TFAM, ETS1, TFDP1, YY1, E2F4, ZNF146, TP53, MAX and CEBPZ were downregulated in C2 (Figure 5F; supplemental Table 4). Concerning the epigenetic components, AICDA, EZH2, EED, PRMT2 and NCOA4 were downregulated during the transition from early to mature prePB stages, whereas PCNA, PRMT1, SET, MBD2 and HDAC1 were downregulated during the transition from prePB to PB. The expression of AID in prePB along with a significant induction of 53BP1 and γH2AX, which characterize the presence of DNA strand breaks, was validated at protein level (supplemental Figure 3). Investigating genes involved in ligand/receptor interactions, we found that IL2RA, IL21R and CD40 are downregulated in the first instance after B-cell activation (early prePB). The B-cell markers CD19, CD22, CD83, CCR7, CCL17 and CCL222,6,7 are downregulated in C1 (Figure 5F; supplemental Figure 6; supplemental Table 4). TACI expression was downregulated in C2. PC surface markers CD27, CD38, SLAMF7, BCMA and ITGA4 were upregulated in C1 together with IL-6R, IL-6ST and INSR (Figure 5F; supplemental Figure 6; supplemental Table 4).
Identification of subpopulations within the different stages of B to PC differentiation. (A) Seurat k-nearest neighbors clustering identified 7 clusters: 1 cluster corresponding to MBC and 2 clusters for each stage of prePB, PB, and PC. (B) Identification of quiescent cells (G1) and proliferative cells (S and G2M) using the Seurat cell-cycle scoring. (C) mRNA expression of CDC20, CDK1, MKI67 and PCNA involved in cell cycle. High and low expression were represented in dark blue and in yellow, respectively. (D) Cell-cycle distribution of each stage. (E) Heat map displaying the average expression of selected genes in clusters identified in panel A.
Identification of subpopulations within the different stages of B to PC differentiation. (A) Seurat k-nearest neighbors clustering identified 7 clusters: 1 cluster corresponding to MBC and 2 clusters for each stage of prePB, PB, and PC. (B) Identification of quiescent cells (G1) and proliferative cells (S and G2M) using the Seurat cell-cycle scoring. (C) mRNA expression of CDC20, CDK1, MKI67 and PCNA involved in cell cycle. High and low expression were represented in dark blue and in yellow, respectively. (D) Cell-cycle distribution of each stage. (E) Heat map displaying the average expression of selected genes in clusters identified in panel A.
Pseudotemporal analysis of prePB and PB subpopulations. (A) UMAP representation of proliferative prePB and PB. (B) UMAP projection colored by normalized pseudotime analysis. (C) Clusters identified using the Monocle 3 package and used to define trajectories. (D) Temporal gene expression patterns from prePB to PB. (E) Proportion of genes coding TFs, epigenetic enzymes (EEs) and proteins involved in ligand/receptor interactions deregulated along the trajectory according to the expression patterns defined in panel D. (F) Plots of the expression of top differentially expressed genes coding for TFs, EEs, ligands and receptors in function of pseudotime.
Pseudotemporal analysis of prePB and PB subpopulations. (A) UMAP representation of proliferative prePB and PB. (B) UMAP projection colored by normalized pseudotime analysis. (C) Clusters identified using the Monocle 3 package and used to define trajectories. (D) Temporal gene expression patterns from prePB to PB. (E) Proportion of genes coding TFs, epigenetic enzymes (EEs) and proteins involved in ligand/receptor interactions deregulated along the trajectory according to the expression patterns defined in panel D. (F) Plots of the expression of top differentially expressed genes coding for TFs, EEs, ligands and receptors in function of pseudotime.
Subclustering of prePB and PB stages by single-cell transcriptomic analysis
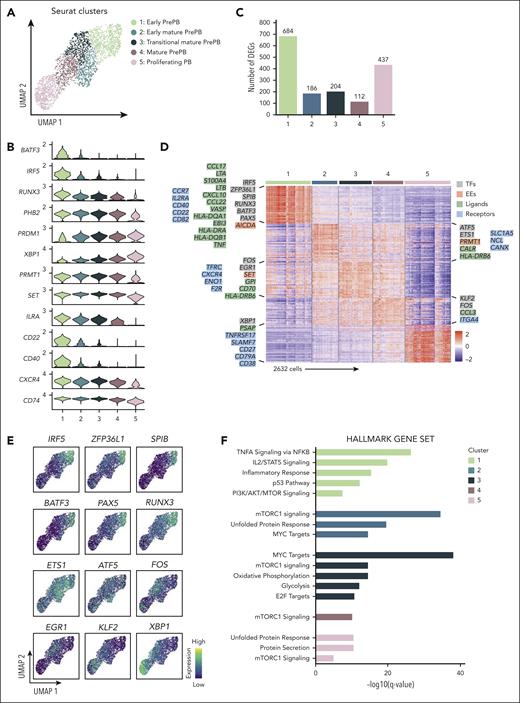
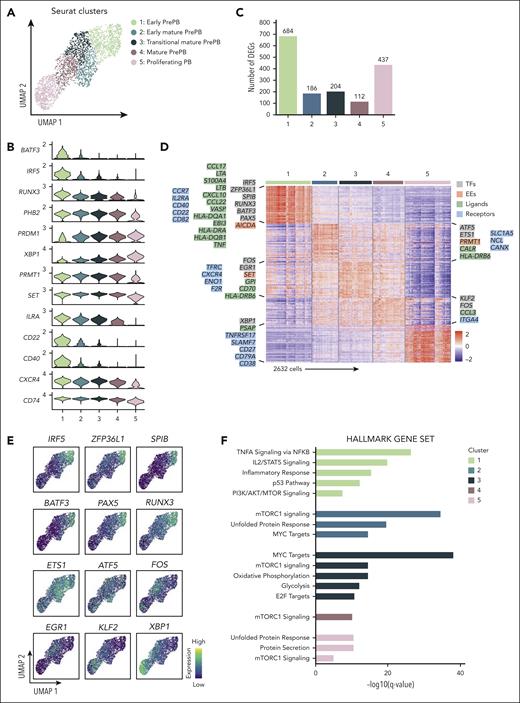
The heterogeneity of the prePB stage encouraged us to increase the number of clusters to identify new transitional subpopulations of prePB. We obtained 5 clusters composed of 4 clusters of prePB and a unique cluster of PB (Figure 6A). Genes deregulated along differentiation process and identified using pseudotime analysis (Figure 5F; supplemental Table 4) were used to order clusters in particular clusters 2, 3, and 4, corresponding to more mature prePB (Figure 6B). Pairwise comparisons revealed a larger variation of gene expression observed during the first phases (cluster 1: 684 DEG) and at the end (cluster 5: 437 DEG) of the differentiation (Figure 6C; supplemental Table 5). The heat map of the top 50 differentially expressed genes revealed very specific transcriptomic profiles for cluster 1, the early prePB, and cluster 5, the PB (Figure 6D). In cluster 1 (early prePB), we found several ligands and receptors strongly expressed after B-cell activation (Figure 6D). This cluster was also characterized by an overexpression of B-cell TFs (IRF5, ZFP36L1, SPIB, BATF3, RUNX3 and PAX5) (Figure 6E) and AICDA. The cluster 5 (PB) was notably represented by an overexpression of PC receptors, such as TNFRSF17 (BCMA), SLAMF7 (CS1), CD27, CD79A and CD38, the PC TF XBP1 and the PSAP ligand. Mature prePB were divided in 3 clusters (cluster 2: early mature prePB, cluster 3: transitional mature prePB and cluster 4: mature prePB; Figure 6D) and expressed specific markers like the ETS1 and ATF5 TFs overexpressed in early mature prePB (cluster 2). ATF5 is a TF involved in the survival pathway CREB3L2-ATF5-MCL1.17 ETS1 was shown to mediate the transcriptional upregulation of MCL1 antiapoptotic factor and recruit AID to DNA sequence from the immunoglobulin heavy-chain gene (IGH) locus.23EGR1 and FOS are expressed later in transitional mature prePB (cluster 3). EGR1 TF participates in PCD program.24KLF2 is expressed in mature prePB (clusters 4) and PB (cluster 5) (Figure 6E). KLF2 is involved in the control of PC homing in the bone marrow by controlling the expression of β7-integrin.25 The clusters of mature prePB were also distinguished by the expression of some genes coding ligands and receptors, respectively CALR, HLA-DRB6 and SLC1A5, NCL, CANX for cluster 2, GPI, CD70, HLA-DRB6 and TFRC, CXCR4, ENO1, F2R for cluster 3, CCL3 and ITGA4 for cluster 4. Gene set enrichment analysis revealed that cluster 1 is enriched in genes regulated by NF-κB and STAT5, respectively in response to TNF and IL-2 stimulation (Figure 6F; supplemental Table 6). This cluster was also enriched in genes involved in inflammatory response and p53 pathway. We also found genes upregulated by the activation of the phosphoinositide 3-kinase (PI3K)/serine-threonine protein kinase (AKT)/mammalian target of rapamycin (mTOR) signaling in cluster 1 and genes upregulated through the activation of mTOR complex 1 (mTORC1) in all other clusters with a greater enrichment in cluster 2. In parallel, in this cluster, we observed an enrichment in genes involved in unfolded protein response (UPR) and MYC targets. This gene set was also found in cluster 3 in addition to genes involved in oxidative phosphorylation and glycolysis, and targets of E2F TF involved in cell cycle. Cluster 5 was enriched in genes involved in UPR in association with protein secretion.
Identification of new subpopulations of prePB and PB stages. (A) Seurat k-nearest neighbors clustering identified 5 clusters, including 4 clusters for prePB and 1 cluster for PB. (B) Violin plots representing the expression of top marker genes identified using the pseudotime analysis for each cluster. (C) Number of positive differentially expressed genes identified in the 5 clusters using pairwise comparisons (one cluster vs all other cells). (D) The heat map showed the top 50 genes upregulated in each cluster. Keys genes coding TFs, EEs, ligands, and receptors were indicated and colored in gray, red, green, and blue, respectively. (E) Expression levels of TFs identified in panel D. High and low expression were represented in dark blue and in yellow, respectively. (F) Gene set enrichment analysis of the whole genes upregulated in each cluster.
Identification of new subpopulations of prePB and PB stages. (A) Seurat k-nearest neighbors clustering identified 5 clusters, including 4 clusters for prePB and 1 cluster for PB. (B) Violin plots representing the expression of top marker genes identified using the pseudotime analysis for each cluster. (C) Number of positive differentially expressed genes identified in the 5 clusters using pairwise comparisons (one cluster vs all other cells). (D) The heat map showed the top 50 genes upregulated in each cluster. Keys genes coding TFs, EEs, ligands, and receptors were indicated and colored in gray, red, green, and blue, respectively. (E) Expression levels of TFs identified in panel D. High and low expression were represented in dark blue and in yellow, respectively. (F) Gene set enrichment analysis of the whole genes upregulated in each cluster.
Dual activation of UPR during prePB and PB transition
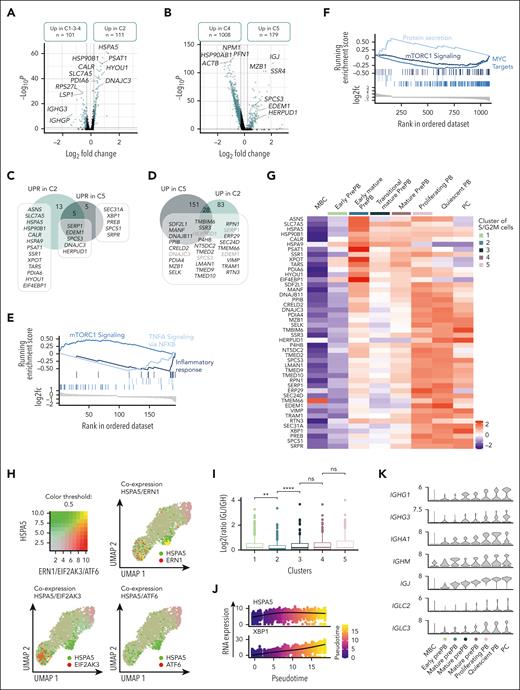
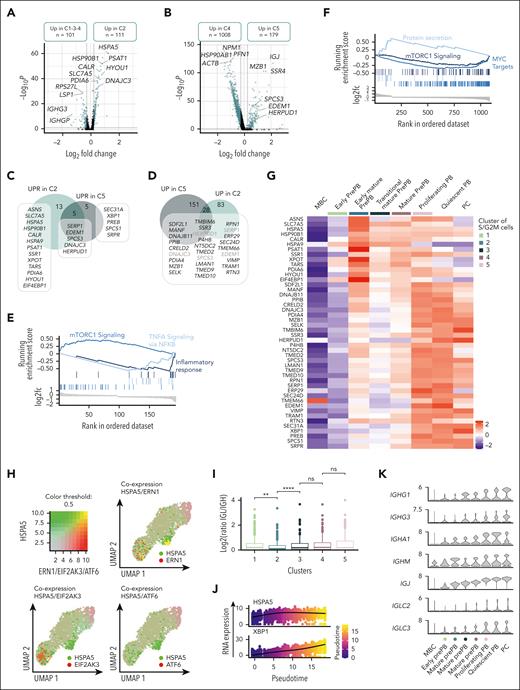
We decided to focus on the dual activation of the endoplasmic reticulum stress observed in the first cluster of more mature prePB and later in PB. Pairwise comparison between cluster 2 and clusters 1, 3 and 4 corresponding to nearest clusters showed that 111 genes were overexpressed in cluster 2, including 19 genes (ASNS, SLC7A5, HSPA5, HSP90B1, CALR, HSPA9, SERP1, PSAT1, SSR1, EDEM1, XPOT, TARS1, SPCS3, DNAJC3, PDIA6, HYOU1, EIF4EBP1 and HERPUD1) involved in UPR (Figure 7A-C; supplemental Table 7). The cluster 5 overexpressed 179 genes compared with the cluster 4 including 10 genes involved in endoplasmic reticulum stress. Among them, 5 genes were commonly found in clusters 2 and 5, whereas 5 genes were specific to the cluster 5 (Figure 7B-C; supplemental Table 7). We also compared the genes upregulated in clusters 2 and 5 to identify other genes potentially involved in the UPR (Figure 7D). As reported in mice,26 the first activation of UPR, in prePB, is associated with an overexpression of genes involved in mTORC1 signaling whereas the second activation was associated with a downregulation of mTORC1 signaling genes and an overexpression of genes involved in protein secretion (Figure 7E-F). The heat map of the genes involved in the UPR showed a clear distinction between the first activation occurring in early mature prePB (cluster 2) and the second activation associated with protein secretion in PB and PCs (Figure 7G). Early UPR activation was associated to a strong expression of ASNS, SLC7A5, HSPA5, PSAT1, XPOT, and EIF4EBP1, whereas the second activation was characterized by a strong expression of TMBIM6, HERPUD1, VIMP, and XBP1 in PCs. Interestingly, HSPA5 coding a member of the heat shock protein (HSP) 70 family named binding immunoglobulin protein (BiP) was only coexpressed with one of the 3 transmembrane endoplasmic reticulum stress sensors in cluster 2 (Figure 7H). Interestingly, in cluster 2 we observed an imbalance in the ratio of reads corresponding to immunoglobulin light and heavy chains (Figure 7I), with a higher number of reads corresponding to IGH compared with immunoglobulin light chain gene (IGL; supplemental Figure 7A-B) that could explain the release of BiP, firstly described as an immunoglobulin heavy chain-binding protein,27 from its luminal domain at this specific moment. In cluster 2, only the Ire1 pathway was activated, known to splice XBP-1 (sXBP-1) to produce a highly active TF.28 Moreover, the ligase responsible for the ligation of sXBP1 was also coexpressed in cluster 2 (supplemental Figure 8A) and pseudotime analysis showed that HSPA5 was first expressed, followed by a strong expression of XBP1 (Figure 7J; supplemental Figure 8B). We also detected some sXBP1 reads confirming that the splicing of XBP-1 occurred after the first UPR activation in early mature prePB (supplemental Figure 9). The expression of BiP in prePBs together with the induction of XBP1 splicing was validated at the protein level (supplemental Figure 3). To investigate the role of mTORC1-mediated UPR activation in PCD, we used rapamycin, which is an acute inhibitor of mTORC1. The drug was added from day 2 to day 4 or from day 2 to day 7, to investigate the effect in prePB. When used from day 2 to day 4, rapamycin treatment significantly affected the proliferation after activation of MBCs (supplemental Figure 10A). At days 4, 7, and 10, global cell counts were significantly decreased by 51%, 75%, and 56%, respectively (supplemental Figure 10A). Rapamycin did not significantly affect cell viability at days 4, 7, and 10 (supplemental Figure 10B). At the cellular level, the percentage of prePBs at day 4 was not affected by rapamycin (supplemental Figure 10C). Conversely, at day 7, the percentage of prePBs was significantly increased whereas the percentage of PBs was significantly decreased under mTORC1 inhibition compared with control (supplemental Figure 10C). At day 10, the percentage of mature PCs was significantly reduced (supplemental Figure 10C). When used from day 2 to day 7, rapamycin treatment induced the same effects, resulting in inhibition of PCD (supplemental Figure 10A-B,D). The PI3K inhibitor idelalisib was used as a control. PI3K inhibition significantly affected proliferation without significantly affecting PCD (supplemental Figure 10A-D).
Dual activation of UPR during prePB and PB stages. (A-B) Volcano plots showing differentially expressed genes between the cluster 2 (C2) vs clusters 1, 3 et 4 (C1-3-4) and cluster 5 (C5) vs cluster 4 (C4), respectively. Genes identified as significantly differentially expressed were colored in blue (P value <.05 and log2(fold change) >0.25). (C) Venn diagram representing genes involved in UPR and upregulated in C2 and/or C5. (D) Venn diagram of genes upregulated in C2 and/or C5. Common genes were potentially involved in UPR. (E-F) Gene set enrichment analysis showing both pathways enriched in upregulated and downregulated genes in C2 and C5 compared with C1-3-4 and C4, respectively. (G) Heat map displaying the expression of genes involved in UPR and upregulated in C2 and/or C5 for each cluster of proliferating prePB and PB, as well as quiescent MBC, PB, and PC. (H) Visualization of cells simultaneously coexpressing HSPA5 (in green) and ERN1, EIF2AK3, or ATF6 (in red) genes. Yellow dots correspond to the coexpression of the 2 genes. (I) Boxplots representing the log2 ratio of IGL and IGH read counts per cell in each cluster. (J) Plots of HSPA5 and XBP1 mRNA expression in function of pseudotime. (K) Violin plots of the main immunoglobulin genes expressed in PCs for each cluster of proliferating prePB and PB, as well as quiescent MBC, PB, and PC.
Dual activation of UPR during prePB and PB stages. (A-B) Volcano plots showing differentially expressed genes between the cluster 2 (C2) vs clusters 1, 3 et 4 (C1-3-4) and cluster 5 (C5) vs cluster 4 (C4), respectively. Genes identified as significantly differentially expressed were colored in blue (P value <.05 and log2(fold change) >0.25). (C) Venn diagram representing genes involved in UPR and upregulated in C2 and/or C5. (D) Venn diagram of genes upregulated in C2 and/or C5. Common genes were potentially involved in UPR. (E-F) Gene set enrichment analysis showing both pathways enriched in upregulated and downregulated genes in C2 and C5 compared with C1-3-4 and C4, respectively. (G) Heat map displaying the expression of genes involved in UPR and upregulated in C2 and/or C5 for each cluster of proliferating prePB and PB, as well as quiescent MBC, PB, and PC. (H) Visualization of cells simultaneously coexpressing HSPA5 (in green) and ERN1, EIF2AK3, or ATF6 (in red) genes. Yellow dots correspond to the coexpression of the 2 genes. (I) Boxplots representing the log2 ratio of IGL and IGH read counts per cell in each cluster. (J) Plots of HSPA5 and XBP1 mRNA expression in function of pseudotime. (K) Violin plots of the main immunoglobulin genes expressed in PCs for each cluster of proliferating prePB and PB, as well as quiescent MBC, PB, and PC.
The second UPR activation starting in cluster 5 is clearly associated to immunoglobulin gene expression (Figure 7K). Altogether, these data indicate that prePB already prime the UPR through mTORC1 pathway activation for Knn-based clustering to prepare for PC function. XBP1-driven UPR activation will then be coordinated in PB to cope with the increase in antibody synthesis.
To validate our results, we used the large human tonsil atlas data set29 (supplemental Figure 11A). Among the 209 786 cells constituting the human tonsil atlas data set, we selected the germinal center B cells and PC in S and G2/M phases (supplemental Figure 11B-D). We identified a subpopulation of prePB characterized by low levels of MS4A1 and CD38 together with high expression of BATF, BATF3, EZH2, MYB, BLM, AICDA, NSD2, and PCNA (supplemental Figure 11E-G). These prePB presented a significant enrichment in MYC target genes, E2F target genes, mTORC1 signaling, oxidative phosphorylation, glycolysis, inflammatory response (supplemental Figure 11I) already identified in the PrePB of our in vitro PCD model (Figure 6F). Taken together, these results demonstrate the identification of transitional prePB cells in the human tonsil as previously reported.6
Discussion
Herein, using scRNA-seq and scATAC-seq of an in vitro PCD model, we provide direct evidence for epigenetic and transcriptional transition during preplasmablastic stage associated with PC genesis. Integration of chromatin accessibility and transcriptomic data revealed a more mature population of preplasmablastic cells characterized by open chromatin in PC genes without significant expression. Among them, we identified MZB1, FAM46C and XBP1. MZB1 is required for differentiation of PB and PC. MZB1 depletion resulted in deregulation of BLIMP1 target genes. Furthermore, MZB1 is required for the trafficking and maintenance of bone marrow PCs in mice.22 FAM46C plays a role in sustaining ER biogenesis and secretory capacity in PC.20 XBP1 is essential to support the UPR response and adaptation to immunoglobulin secretion.16 Pseudotemporal analyses identified maturation trajectories in prePB with early prePB characterized by downregulation of B-cell markers and B-cell TFs together with upregulation of PC markers, adhesion molecules and growth factor receptors. The transition from early prePB to more mature prePB is associated with downregulation of AICDA and of PRC2 complex subunits. We previously reported that EZH2 is upregulated in prePB to repress B-cell and PC transcriptional programs and sustain a transient prePB immature proliferative state that support their amplification.12 Furthermore, the observed coregulation of AICDA and PRC2 complex genes support the reported role of EZH2 in DNA damage response inhibition to stimulate the survival of activated B cells during AID–mediated somatic hypermutation of immunoglobulin genes.30 In mature prePB, we could identify a significant heterogeneity with sequential early activation of UPR followed by EGR1 and FOS activation and PC homing control mediated by KLF2. The first wave of the UPR activation is associated with the mTORC1 pathway.31,32 This mTORC1 mediated UPR activation was recently reported in murine activated B cells driving PC priming26,33 before XBP1 gene expression. Among the UPR genes commonly identified in murine activated B cells and human PrePB of our model, XPOT, ASNS asparagine synthetase, SLC7A5 amino acid transporter and PSAT1 metabolic enzyme were identified. SLC7A5 and ASNS are involved in protein synthesis. HSPA5, HSP90B1 and HSPA9, genes coding chaperones, and facilitator of disulfide bond formation PDIA6 were also induced in prePB early UPR wave. Concomitantly, activation of MCL1–mediated PC-survival pathway was induced in these prePB with ETS1 and ATF5 overexpression.17,23 This pathway is known to be activated in light-zone GC B cells that differentiate into PCs.18 Transitional prePB overexpress EGR1, FOS, CXCR4, and TFRC. C-FOS/AP-1 positively regulates BLIMP1 expression and terminal PCD19,34 and in malignant PCs.35TFRC coding CD71 is regulated by BLIMP1 in PCD and is known to modulate mTORC1.22 In mice, EGR1 depletion in B cells inhibits PCD in vitro and in vivo.36 CXCR4 overexpression promotes PC migration and maintenance in the bone marrow (BM).36 Mature prePB overexpress KLF2 that participates in BM PC homing through the control of β7-integrin expression together with ITGA4, driving PC motility through VCAM-1 gradient37 and interaction with stromal cells.38 In human, MBCs are known to induce PCs faster and with reduced input signals compared with other B cells.39 Our results revealed that a population of prePBs already undergone epigenetic remodeling related to PC profile together with UPR activation and are committed to differentiate in PC. We could confirm the presence of transitional prePBs in a large human tonsil atlas data set.29 A major challenge is to determine the functional contribution of identified epigenetic and transcriptional changes involved in PC generation. The human PCD models developed by several groups6,8-11,18 and the data generated during their characterization2,3,12,40,41 may be of particular importance for future functional validation studies using CRISPR-Cas9–mediated deletion.13,42
No significant association could be defined between gene expression signature in the transitional prePB stages reported and malignant PC counterpart associated with multiple myeloma cancer. Among the differentially expressed genes identified in the 5 clusters of prePB and PB, high expression of ETS1,43NCL, SET, TFRC44 and ENO145 belonging to early and transitional mature PrePB were associated with significantly poor outcome in multiple myeloma (supplemental Figure 12A-B). However, high expression of CD40,46CD82,47CD22, CALR, SLAMF7,48 and CD2749 belonging to early prePB, early mature prePB and PB were associated to good prognosis (supplemental Figure 13A-B).
In sum, our results illustrate a complex and dynamic pattern of epigenetic and transcriptomic modifications in early PC genesis. These results and the supporting data generated provide a resource for the identification of molecular circuits that are crucial for early and mature PC biological function and survival. These data thus provide critical insights into epigenetic- and transcription–mediated reprogramming events that sustain PCD.
Acknowledgments
The Jérôme Moreaux research group was supported by grants from INCA PLBIO19 FATidique, PLBIO22 PIC-ASO, ANR-18-CE15-0010-01 PLASMADIFF-3D, SIRIC Montpellier Cancer (INCa-DGOS-INSERM- ITMO Cancer_ 18004), ARC foundation PGA EpiMM3D, ARC foundation PGA RF20180207070 BAR-B cells, Institut Carnot CALYM, Labex EpiGenMed, Fondation Française pour la Recherche contre le Myélome et les Gammapathies monoclonales (AAP-FFRMG-2021), the European Union (Project 101097094—ELMUMY), INSERM PCSI 2020 Smooth-MM, AAP ECOPHYTO–PELYCANO (this action is led by the Ministries for Agriculture and Food Sovereignty, for an Ecological Transition and Technical Cohesion, for Health and Prevention, and for Higher Education and Research, with the financial support of the French Office for Biodiversity, as part of the call for projects on the Ecophyto II+ plan "Phytosanitary products: from exposure to impacts on human health and ecosystems towards an integrated "one health" approach," with the fees for diffuse pollution coming from the Ecophyto II+ plan), MUSE LabUM Epigenmed, MSDAVENIR EpiMuM-3D, AAP READYNOV, and Institut Universitaire de France. S.O. is supported by a grant from Fondation de France.
Authorship
Contribution: E.A. and S.O. performed research and participated in the writing of the manuscript; C.B., M.E., M.C., T.F., J.I.M.-S., G.C., and P.M. participated in the research and in the writing of the manuscript; D.S. and R.F.P. participated in the bioinformatic analyses; L.D. participated in the research; and J.M. supervised the research and wrote the manuscript.
Conflict-of-interest disclosure: The authors declare no competing financial interests.
Correspondence: Jérôme Moreaux, Department of Biological Hematology, Laboratory for Monitoring Innovative Therapies, Hôpital Saint-Eloi–CHRU de Montpellier, Institute of Human Genetics, CNRS UMR-UM 9002, 80, Av. Augustin Fliche, 34295 Montpellier Cedex 5, France; email: jerome.moreaux@igh.cnrs.fr.
References
Author notes
E.A. and S.O. contributed equally to this study.
Data are available on request from the corresponding author, Jérôme Moreaux (jerome.moreaux@igh.cnrs.fr).
The online version of this article contains a data supplement.
There is a Blood Commentary on this article in this issue.
The publication costs of this article were defrayed in part by page charge payment. Therefore, and solely to indicate this fact, this article is hereby marked “advertisement” in accordance with 18 USC section 1734.


