Abstract
The effect of chronic expression of flt3 ligand (FL) on in vivo hematopoiesis was studied. Retroviral vector-mediated gene transfer was used in a mouse model of bone marrow transplantation to enforce expression of mouse FL cDNA in hematopoietic tissues. As early as 2 weeks posttransplantation, peripheral blood white blood cell counts in FL-overexpressing recipients were significantly elevated compared with controls. With the exception of eosinophils, all nucleated cell lineages studied were similarly affected in these animals. Experimental animals also exhibited severe anemia and progressive loss of marrow-derived erythropoiesis. All of the FL-overexpressing animals, but none of the controls, died between 10 and 13 weeks posttransplantation. Upon histological examination, severe splenomegaly was noted, with progressive fibrosis and infiltration by abnormal lymphoreticular cells. Abnormal cell infiltration also occurred in other organ systems, including bone marrow and liver. In situ immunocytochemistry on liver sections showed that the cellular infiltrate was CD3+/NLDC145+/CD11c+, but B220− and F4/80−, suggestive of a mixed infiltrate of dendritic cells and activated T lymphocytes. Infiltration of splenic blood vessel perivascular spaces resulted in vascular compression and eventual occlusion, leading to splenic necrosis consistent with infarction. These results show that FL can affect both myeloid and lymphoid cell lineages in vivo and further demonstrate the potential toxicity of in vivo treatment with FL.
THE HEMATOPOIETIC system is continuously replenished throughout life by a limited set of pluripotent stem cells. The production of differentiated progeny from hematopoietic stem cells is a tightly regulated process involving positive and negative signals mediated, at least in part, through the interaction of stromal growth factors with specific plasma membrane-associated receptors. These receptors include members of the receptor tyrosine kinase (RTK) superfamily, including c-kit and flt3/flk2. The interaction of c-kit with its ligand, stem cell factor (SCF), contributes to the survival and proliferation of primitive hematopoietic progenitor or stem cells and more committed myelo-erythroid progenitors.1-4 SCF also contributes to the survival, proliferation, and differentiation of primitive lymphoid progenitors5,6 and plays a role in early B and T lymphopoiesis.7,8 The RTK flt3/flk2 is expressed on hematopoietic stem cells9,10 and on more committed lymphoid progenitors.11 12
The recent cloning of mouse13 and human14 ligands for flt3/flk2 have allowed study of its role in hematopoiesis. The in vitro hematopoietic activities of the flt3/flk2 ligand (FL) closely resemble those of SCF, including involvement in the proliferation and differentiation of early hematopoietic progenitors10,13,15 and in early B-cell lymphopoiesis.16 FL is also reported to act synergistically with other factors to support granulocyte/monocyte differentiation of hematopoietic progenitors in vitro.17 Short-term in vivo administration of Chinese hamster ovary cell-derived FL in mice showed that FL influenced the mobilization of colony-forming units-spleen and Sca-1+/c-kit+/Lin− cells into the peripheral blood and spleen and also increased the numbers of colony-forming units-granulocyte-macrophage (CFU-GM) and colony-forming units-granulocyte, erythrocyte, monocyte, megakaryocyte (CFU-GEMM) in the bone marrow, spleen, and peripheral blood of treated animals.18
The purpose of the present work was to study the hematopoietic effect(s) of chronically expressing FL in vivo. We have used retroviral vector-mediated gene transfer in a model of bone marrow transplantation to deliver the FL cDNA into the mouse hematopoietic system, as previously described.19 The data obtained are useful for elucidating the physiologic role of FL and for identifying potential toxicities that might be associated with the in vivo use of FL.
MATERIALS AND METHODS
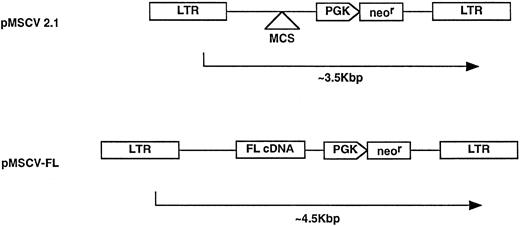
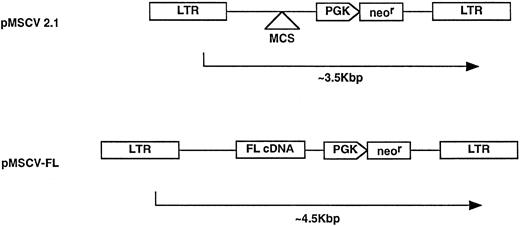
Construction and characterization of FL retroviral packaging cells.Full-length murine FL cDNA was amplified by the polymerase chain reaction (PCR) using synthetic oligonucleotides designed from the published sequence13 (sense oligo, 5′-GGGAATTCATGACAGTGCTGGCGCCAGCCTGG -3′; and antisense oligo, 5′-GCGCAATTAACCCTCACTAAAGATCTCTAGGGATGGGAGGGGAGGGG CAC-3′). The sense oligonucleotide contained a 5′- EcoRI linker, whereas the antisense oligonucleotide contained a T3 RNA polymerase promoter and a BglII linker internal to the T3 promoter. PCR products were digested with EcoRI and BglII and cloned into similarly digested parental vector (pMSCV2.1) under the transcriptional control of the viral LTR promoter. The parental MSCV vector (supplied by R. Hawley, University of Toronto, Toronto, Ontario, Canada) was derived from murine embryonic stem cell virus (MESV) and contains a neomycin phosphotransferase resistance (neor) gene driven by an internal mouse phosphoglycerate kinase (PGK) promoter, as described.20
The parental plasmid pMSCV2.1 and the pMSCV-FL plasmids were independently electroporated into the GP+E-86 packaging cell line (supplied by Dr A. Bank, Columbia University, New York, NY).21 Transient supernatants were harvested from electroporated populations and used to infect tunicamycin-treated parental GP+E-86 cells. Tunicamycin treatment relieves the block to superinfection of the parental packaging cells. G418 (0.78 mg/mL, 67% active; GIBCO Laboratories, Life Technologies, Inc, Grand Island, NY) -resistant clones were selected from each infected population and titered by infection of NIH3T3 cells. Clones with the highest G418-resistant titer were expanded and frozen as aliquots. Each bone marrow infection and transplantation experiment used aliquots from the same passage of frozen viral packaging cells. Both the parental and FL packaging cell lines were tested for the presence of (and were found to be free from) replication-competent virus using a sensitive marker rescue assay.22
Production of retroviral supernatants.Recombinant virus-producing packaging cell lines were grown in 175-cm2 tissue culture flasks in Iscove's modified Dulbecco's medium (IMDM; GIBCO) and 10% (vol/vol) fetal bovine serum (FBS) at 37°C. Subconfluent (∼60%) monolayers of cells were fed with fresh medium 24 hours before harvest of virus-containing supernatants. Viral supernatants were removed from packaging cell lines by aspiration, sterile-filtered (0.45 μm), and added directly to bone marrow cultures. Fresh aliquots of frozen packaging cell lines were thawed for use in each experiment.
Retroviral vector constructs. The FL cDNA was subcloned into the parental vector construct, pMSCV 2.1, to generate the pMSCV-FL vector, as described in Materials and Methods.
Retroviral vector constructs. The FL cDNA was subcloned into the parental vector construct, pMSCV 2.1, to generate the pMSCV-FL vector, as described in Materials and Methods.
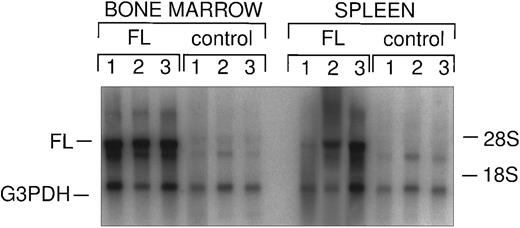
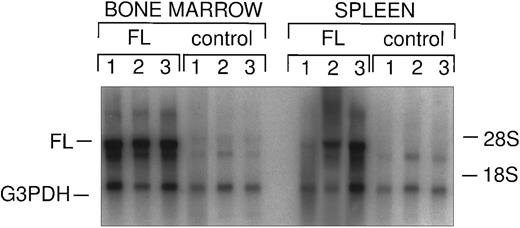
Northern analysis of in vivo FL expression. Total splenic and bone marrow RNA from FL-overexpressing and control animals was probed with FL and G3PDH, as described. Vector-derived FL message is indicated as well as endogenous G3PDH.
Northern analysis of in vivo FL expression. Total splenic and bone marrow RNA from FL-overexpressing and control animals was probed with FL and G3PDH, as described. Vector-derived FL message is indicated as well as endogenous G3PDH.
Bone marrow infection and transplantation.Eight- to 12-week-old male B6D2F1/J (C57BL6/J X DBA/2J) mice were used as bone marrow donors. Female B6D2F1/J mice were used as recipients. All mice were purchased from The Jackson Laboratory (Bar Harbor, ME) and housed under specific pathogen-free conditions in the Amgen vivarium (Amgen, Inc, Thousand Oaks, CA). Bone marrow cells were harvested from femurs and tibias of donor mice 4 days after 5-fluorouracil (Sigma Chemical Co, St Louis, MO) treatment (150 mg/kg intravenously). Bone marrow cells (6 × 10⁵/mL) were incubated in 150-mm tissue culture dishes (30 mL/dish) containing fresh viral supernatant (as described above), 15% FBS, 6 μg/mL polybrene (Sigma), 0.1% bovine serum albumin (BSA; Fraction V; Sigma), 2.5 ng/mL recombinant mouse interleukin-3 (rmIL-3), and 100 ng/mL each of recombinant human IL-6 (rhIL-6), recombinant human IL-11 (rhIL-11), and recombinant rat SCF (rrSCF). All growth factors were produced by Amgen, Inc. Culture media were replaced daily for 3 days with fresh virus-containing supernatant and growth factors.
At the end of the infection period, total nonadherent and adherent cells were washed and resuspended in 1% BSA-saline and transplanted into γ-irradiated (9.5 Gy, Cs137 ) mice. Each animal was transplanted with 2.5 × 10⁶ cells. After transplantation, peripheral blood was sampled from recipient animals by weekly retro-orbital bleeding. The 50 to 70 μL of blood sampled from each mouse was diluted (1:2) with 1% BSA-saline and analyzed on a Technicon H1E blood analyzing system (Miles Inc, Tarrytown, NY). The H1E hematology system provided complete blood cell counts, including red blood cells (RBCs), platelets, and full white blood cell (WBC) differentials.
Colony assay for estimation of infection efficiency.Bone marrow cells (2.0 to 5.0 × 10⁴/mL) from virally transduced cultures were plated in 1.0 mL IMDM plus methylcellulose containing 10% FBS; 10 mg/mL BSA; soybean lipids; iron-saturated human transferrin; insulin; 2.5 ng/mL rmIL-3; 2.5 ng/mL rhIL-1β; 100 ng/mL each of rrSCF, rhIL-6, and rhIL-11; and 2 U/mL recombinant human erythropoietin (Amgen), as previously described.23 24 Independent cultures were established in the presence or absence of 522 μg/mL active G418 (Sigma) for the determination of retrovirally infected cells. Granulocyte-macrophage or multilineage colonies were counted at day 9.
Retroviral infection efficiency was estimated as the number of colonies grown in the presence of G418 divided by the number of colonies grown in the absence of G418.
Northern analysis.Total RNA was extracted from bone marrow and spleen cells of reconstituted animals using a modification of the guanidinium/cesium chloride method.25 Briefly, cell suspensions were lysed with guanidinium isothiocyanate solution (4.5 mol/L GTCN, 50 mmol/L sodium citrate [pH 7.0], 0.5% [wt/vol] sodium sarcosyl, 5% [vol/vol] β-mercaptoethanol) on ice. Lysates were sonicated to disrupt genomic DNA. Lysates were spun through a cushion of CsCl (5.7 mol/L CsCl, 0.1 mol/L EDTA) at 65,000g for 16 hours at 13°C. RNA pellets were taken up into TES (10 mmol/L Tris [pH 7.0], 1 mmol/L EDTA, 0.1% sodium dodecyl sulfate [SDS]) and ethanol precipitated. RNAs were pelleted by centrifugation at 14,000g at 4°C for 30 minutes. Pelleted RNAs were dissolved in H2O and quantified spectrophotometrically.
Total RNA (5 μg) was size-fractionated by electrophoresis in a formaldehyde/agarose gel and transferred onto nylon membrane (Hybond-N+; Amersham, Arlington Heights, IL). Membrane was prehybridized in Stark's buffer (50% formamide, 50 mmol/L KPO4, 5× SSC, 1% SDS, 5× Denhardt's, 0.05% sarcosyl, 300 mg/mL salmon sperm DNA) at 63°C for 1 hour. Membrane was then probed with random hexamer-primed (Pharmacia, Piscataway, NJ), [α-32P] dCTP-labeled FL and glyceraldehyde-3-phosphate dehydrogenase (G3PDH) cDNA probes in Stark's buffer at 42°C overnight. Probed blots were sequentially washed to high stringency (0.1× SSC, 0.5% SDS at 50°C) and exposed to x-ray film (X-OMAT AR; Eastman Kodak Co, Rochester, NY).
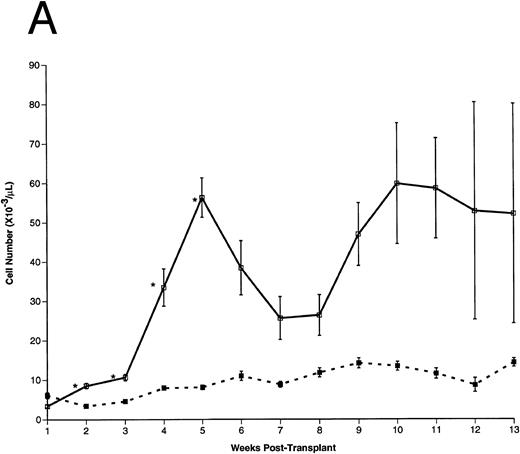
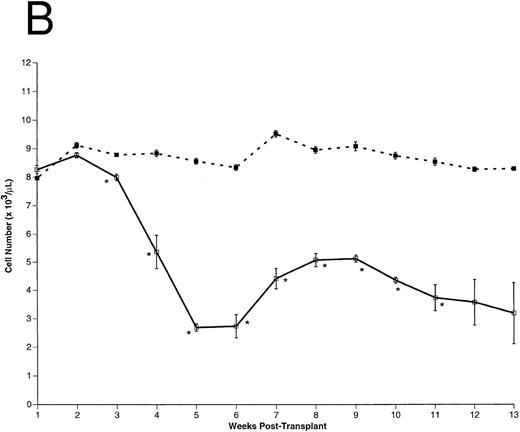
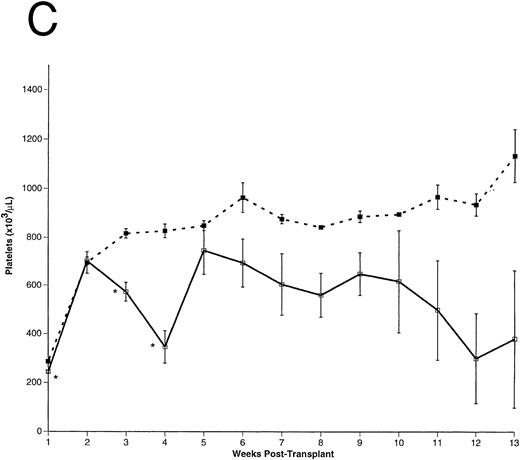
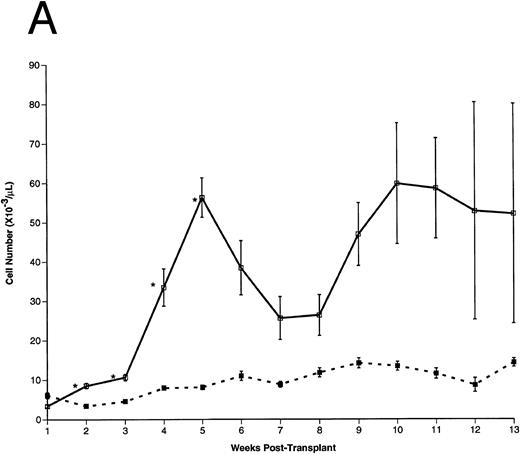
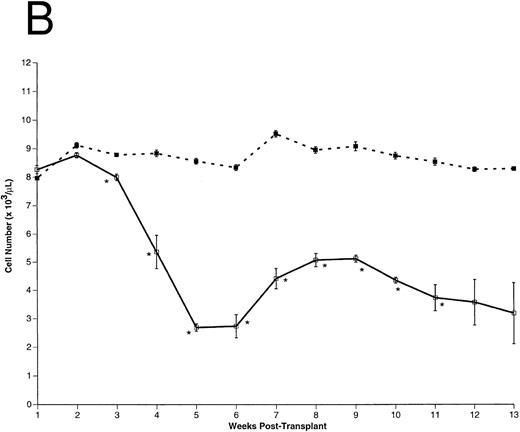
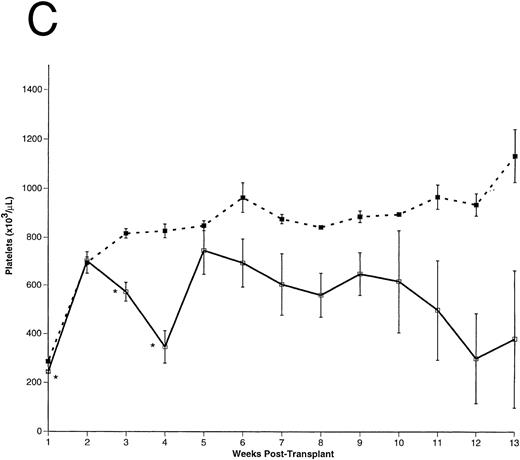
Peripheral blood cell counts. (A) Total WBCs, (B) RBCs, and (C) platelets were counted in FL-overexpressing (□) and control (▪) animals as a function of time posttransplantation, as described. Results are from a representative experiment. The number of animals analyzed (n) in this experiment is as follows: n = 10 for each group from 0 to 5 weeks posttransplantation, n = 5 in the control group for weeks 6 through 13 posttransplantation, n = 5 in the FL-overexpressing group from week 6 through 9 posttransplantation, n = 3 in the FL-overexpressing group from week 10 through 11 posttransplantation, and n = 2 in the FL-overexpressing group from week 12 through 13 posttransplantation. The data are expressed as an arithmetic mean of cell counts (±1 SEM). The significance of difference between FL-expressing and control animals at each time point was determined using the Student's t-test and is indicated: *P < .001; **.005 < P < .001.
Peripheral blood cell counts. (A) Total WBCs, (B) RBCs, and (C) platelets were counted in FL-overexpressing (□) and control (▪) animals as a function of time posttransplantation, as described. Results are from a representative experiment. The number of animals analyzed (n) in this experiment is as follows: n = 10 for each group from 0 to 5 weeks posttransplantation, n = 5 in the control group for weeks 6 through 13 posttransplantation, n = 5 in the FL-overexpressing group from week 6 through 9 posttransplantation, n = 3 in the FL-overexpressing group from week 10 through 11 posttransplantation, and n = 2 in the FL-overexpressing group from week 12 through 13 posttransplantation. The data are expressed as an arithmetic mean of cell counts (±1 SEM). The significance of difference between FL-expressing and control animals at each time point was determined using the Student's t-test and is indicated: *P < .001; **.005 < P < .001.
Histological analysis.For standard organ histology, tissues were fixed in zinc-buffered formalin. The tissues were processed using standard histologic methods to yield 3-μm paraffin sections that were subsequently stained with hematoxylin and eosin (H&E). The spleen sections were further analyzed histochemically using Masson's trichrome and Gomori's reticulum stains.26 To characterize the phenotype of cells infiltrating peripheral organs, immunohistochemistry for CD3, B220, F4/80, NLDC145, and CD11c was performed using an automated immunostainer (BioTek Solutions, Santa Barbara, CA). Briefly, formalin-fixed, paraffin-embedded sections cut at 4 μm were deparaffinized and treated with 0.1% trypsin for 30 minutes (CD3 staining), 15 minutes (B220 staining), or left untreated (F4/80, CD11c, and NLDC145 staining). Sections were quenched with 3% H2O2 in methanol (CD3, B220, CD11c, and NLDC145 staining) or water (F4/80 staining). All sections were blocked with Universal Power Block (BioGenex, San Ramon, CA). Sections were incubated with polyclonal rabbit α-human CD3 (Dako, Carpenteria, CA) at 1:200 dilution, monoclonal rat α-mouse B220 (Pharmingen, San Diego, CA) at 2 μg/mL, rat α-mouse macrophage antibody (F4/80; Harlan, Indianapolis, IN) at 1:50 dilution, hamster α-mouse CD11c (Pharmingen) at 2.5 μg/mL, or rat α-mouse dendritic cell antibody (NLDC145; BNA Biomed, Woburn, MA) at 1:50 dilution. A biotinylated goat α-rabbit IgG (BioTek), rabbit α-rat IgG (BioGenex), or mouse α-hamster IgG (Pharmingen) was used as secondary reagent relevant to each primary reagent. The tertiary reagent for all sections was horseradish peroxidase-conjugated avidin (BioTek). DAB was used as the color indicator to visualize staining reactions. All sections were lightly counter-stained with hematoxylin.
RESULTS
Vector-mediated FL expression in transplanted animals.Retroviral vector-mediated gene transfer was used to deliver and express the FL cDNA in a model of murine bone marrow transplantation, as previously described.19 Female B6D2F1/J recipient animals were transplanted with syngeneic bone marrow transduced with either FL-containing or control (parental) retrovirus (Fig 1). Retroviral vector infection efficiency was assessed by in vitro GM-CFC assay on transduced marrows, as described in Materials and Methods. The infection efficiency of granulocyte-macrophage colony-forming cells in the experiments reported here were from 65% to 89% with the control (parental) vector and from 77% to 81% for the FL vector. Expression of vector-encoded FL mRNA could be detected in the hematopoietic organs of FL-transduced animals for at least 10 weeks posttransplantation (Fig 2). Expression of the FL protein was not assayed in these experiments.
Hematopoietic recovery in transplanted animals.After transplantation, peripheral blood samples were harvested weekly for differential cell counts. As early as 2 weeks posttransplantation, total WBC counts were significantly higher (∼ sevenfold) in the FL-overexpressing animals compared with controls (Fig 3A). Total WBCs remained elevated for the duration of these experiments. RBC (Fig 3B) and platelet (Fig 3C) numbers were essentially equivalent between experimental and control groups until 2 weeks posttransplantation, but the FL-overexpressing animals became severly anemic and thrombocytopenic thereafter.
Differential analysis of peripheral blood mononuclear cells showed that, with the exception of eosinophils, all lineages (neutrophils, lymphocytes, monocytes, and basophils) were similarly affected in the FL-expressing animals (Table 1). There was no significant difference in eosinophil counts between the two groups of animals at any time posttransplantation. The automated differential analysis (H1E) also reported many large, unstained cells (LUCs) consistent with lymphoblasts in these animals. Direct microscopic examination of peripheral blood smears confirmed the differential counts obtained from the H1E analysis.
Five weeks after transplantation, all peripheral blood mononuclear cell counts decreased somewhat in the experimental animals, but recovered by 7 weeks posttransplantation. By 10 to 13 weeks posttransplantation, all FL-overexpressing animals had died, some of which also exhibited hematopoietic decline before death (data not shown). None of the control animals died before the termination of the experiment. Although it is unknown exactly why peripheral blood counts decreased around 5 weeks posttransplantation and then recovered, the histological analysis of these animals suggested a likely mechanism that is discussed later in this report.
We cultured bone marrow, thymus, and peripheral blood cells from FL-overexpressing animals and observed sustained growth in the absence of exogenous growth factors from bone marrow cells, but not thymus or peripheral blood. The autonomously growing bone marrow-derived cells exhibited a primitive phenotype (Sca-1+/Lin−), but were incapable of repopulating otherwise lethally irradiated or nonirradiated syngeneic recipients, suggesting that they were not stem cells and were not immortalized (data not shown). Some limited in vitro growth was observed from thymus-derived cells grown in the presence of IL-2, but we failed to recover sufficient cells for further analysis.
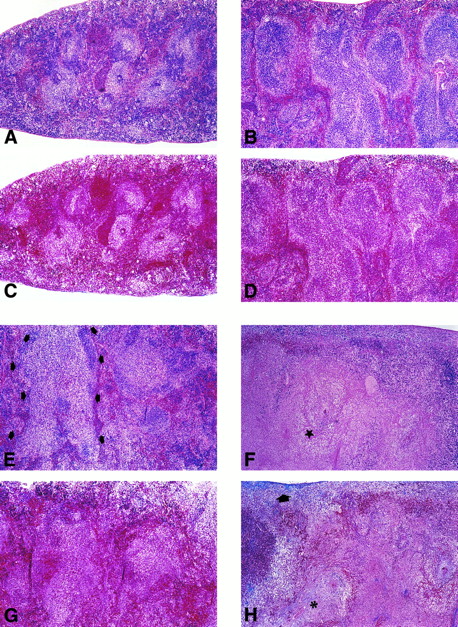
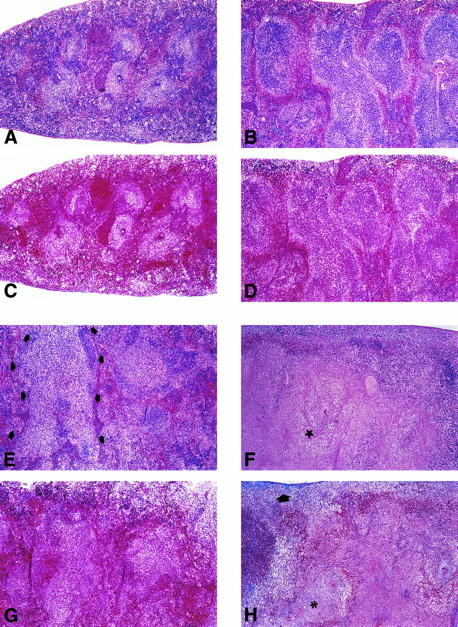
Histological examination of spleen pathology. Spleen sections from control (A through D) and FL-overexpressing (E through H) animals at 2 weeks posttransplantation (A, C, E, and G) or 6 weeks posttransplantation (B, D, F, and H) are shown. H&E-stained sections are shown in (A), (B), (E), and (F) and Masson's trichrome-stained sections are shown in (C), (D), (G), and (H). In control mice, normal splenic architecture is regained over the 6-week period posttransplantation, with no evidence of fibrosis (blue staining) demonstrated by Masson's trichrome staining. In contrast, FL-overexpressing mice develop enlarged splenic white pulp (E; arrowheads) by 2 weeks posttransplantation. No appreciable focal collagen deposition occurred by 2 weeks posttransplantation (G). By 6 weeks posttransplantation, massive splenic necrosis was evident (F; star), with evidence of fibrosis in the splenic parenchyma (H; asterisk) and adjacent to the capsule (H; broad arrow). All photomicrographs were captured with a 6× objective.
Histological examination of spleen pathology. Spleen sections from control (A through D) and FL-overexpressing (E through H) animals at 2 weeks posttransplantation (A, C, E, and G) or 6 weeks posttransplantation (B, D, F, and H) are shown. H&E-stained sections are shown in (A), (B), (E), and (F) and Masson's trichrome-stained sections are shown in (C), (D), (G), and (H). In control mice, normal splenic architecture is regained over the 6-week period posttransplantation, with no evidence of fibrosis (blue staining) demonstrated by Masson's trichrome staining. In contrast, FL-overexpressing mice develop enlarged splenic white pulp (E; arrowheads) by 2 weeks posttransplantation. No appreciable focal collagen deposition occurred by 2 weeks posttransplantation (G). By 6 weeks posttransplantation, massive splenic necrosis was evident (F; star), with evidence of fibrosis in the splenic parenchyma (H; asterisk) and adjacent to the capsule (H; broad arrow). All photomicrographs were captured with a 6× objective.
Histological analysis of transplanted animals.The first animals analyzed histologically were killed at 5 weeks posttransplantation. Upon necropsy, FL-overexpressing animals had grossly enlarged spleens (sixfold by weight) and pale femoral cavities. Bone marrow cellularity in FL-expressing animals was reduced by one third, whereas splenic cellularity was increased twofold compared with controls. Little active erythropoiesis was evident in the bone marrow of FL-overexpressing animals, but some extramedullary erythropoiesis was observed in the spleen and liver. H&E-stained sections of spleen exhibited gross infiltration with atypical lymphoreticular cells. Trichrome-stained sections of these spleens showed marked splenic fibrosis and capsular thickening (data not shown). Other organ systems, including bone marrow, liver, lung, and kidney, were also affected by abnormal cell infiltration.
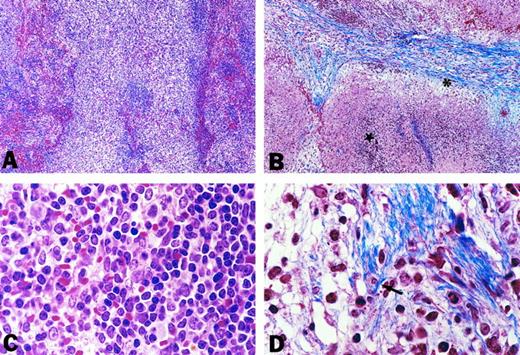
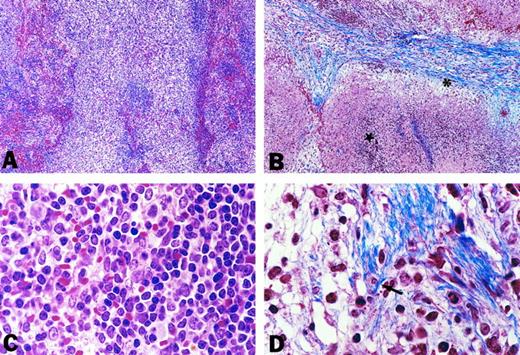
To assess the onset and progression of the splenic pathology induced by chronic expression of FL, we studied cohorts of animals histologically, as a function of time posttransplantation (Fig 4). Sections of spleens from animals transplanted with control (parental vector-infected) or FL-overexpressing bone marrow were examined. Two weeks posttransplantation, the splenic white pulp areas in FL-overexpressing animals were irregularly expanded by an infiltrate of atypical cells with large, folded nuclei and inconspicuous nucleoli (Fig 4E and Fig 5A and C). Morphologically, these were considered to be atypical lymphoid cells. Reticulin-specific stains showed reticulin fibrils in these infiltrates, whereas normal reticulin deposition was observed in the red pulp, perivascular, and capsular areas at this early time point (data not shown).
High-power views of spleen pathology. Spleen sections from FL-overexpressing animals at 2 weeks (A and C) or 6 weeks posttransplantation (B and D) are shown. H&E-stained sections (A and C) at 2 weeks posttransplantation show splenic white pulp expanded with a polymorphous cell population (C) characterized by large, open nuclei with occasional nucleoli. Masson's trichrome-stained sections (B and D) show fibrotic (asterisk) and necrotic (star) change by 6 weeks posttransplantation. At a higher power (D), mature collagen can be seen to envelop individual cells (arrow). (A) and (B) were photographed with a 10× objective, whereas (C) and (D) were photographed with a 100× objective.
High-power views of spleen pathology. Spleen sections from FL-overexpressing animals at 2 weeks (A and C) or 6 weeks posttransplantation (B and D) are shown. H&E-stained sections (A and C) at 2 weeks posttransplantation show splenic white pulp expanded with a polymorphous cell population (C) characterized by large, open nuclei with occasional nucleoli. Masson's trichrome-stained sections (B and D) show fibrotic (asterisk) and necrotic (star) change by 6 weeks posttransplantation. At a higher power (D), mature collagen can be seen to envelop individual cells (arrow). (A) and (B) were photographed with a 10× objective, whereas (C) and (D) were photographed with a 100× objective.
Examination of spleens taken at later time points suggested a pattern of progression. The infiltrates of the atypical cells expanded from the white pulp into the red pulp areas, causing both splenomegaly and displacement of the normal hematopoietic elements. By 6 weeks posttransplantation, geographic areas of fibrosis and necrosis, with fibrous thickening of the capsule, were observed (Fig 4F and H and Fig 5B and D). Accentuation of the intrasplenic arteries with fibrous tissue also occurred. Increased reticulin deposition was present adjacent to the arteries and in the areas of the atypical lymphoid infiltrates. Interestingly, infiltrates of atypical cells could be seen in the adventitia of the arteries and focally throughout the wall of splenic veins. Eventually this infiltrative process caused profound vascular compromise consistent with infarction, resulting in complete splenic necrosis.
Necrosis of the spleen in these animals coincided with the decrease in peripheral blood cell numbers and partial recovery of RBCs. It is possible that the spleen is one source of production for the peripheral blood WBCs in FL-overexpressing animals, and loss of the spleen resulted in a transient decrease in circulating cell numbers. It is also possible that the physiologic stress induced by spleen necrosis secondarily affected production of peripheral blood cell numbers through an unknown mechanism.
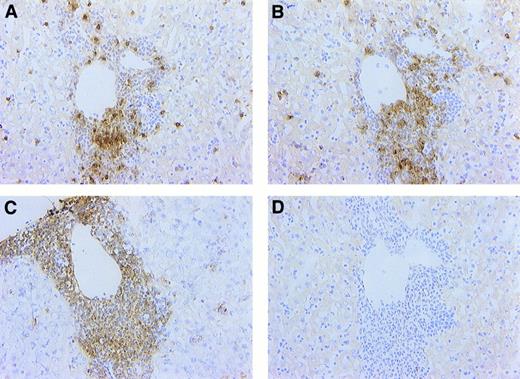
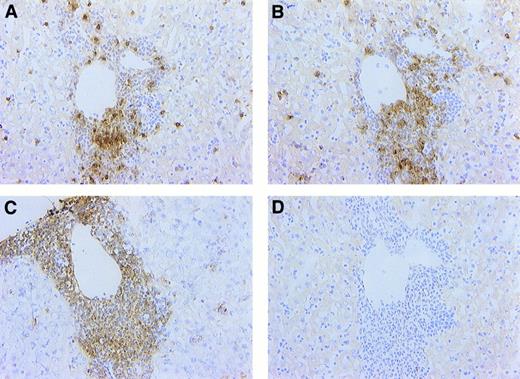
Hepatic cellular infiltrates are composed predominantly of T lymphocytes and dendritic cells. Sections from FL-overexpressing animals at 6 weeks posttransplantation were stained immunohistochemically with antibodies against CD3 (A), dendritic cell (NLDC145; B), and CD11c (C) antigens or with a negative isotype control (in this case, rabbit IgG; D), as described in Materials and Methods. Note that the cellular infiltrate is comprised largely of CD3+ or NLDC145+ cells and that most cells were CD11c+. All photomicrographs were captured with a 40× objective.
Hepatic cellular infiltrates are composed predominantly of T lymphocytes and dendritic cells. Sections from FL-overexpressing animals at 6 weeks posttransplantation were stained immunohistochemically with antibodies against CD3 (A), dendritic cell (NLDC145; B), and CD11c (C) antigens or with a negative isotype control (in this case, rabbit IgG; D), as described in Materials and Methods. Note that the cellular infiltrate is comprised largely of CD3+ or NLDC145+ cells and that most cells were CD11c+. All photomicrographs were captured with a 40× objective.
Immunohistochemistry on infiltrates.The presence of atypical cell infiltrates morphologically similar to those found in the spleen was noted in the liver in the portal zones adjacent to central veins (Fig 6). These infiltrates were observed by 2 weeks posttransplantation and progressed in size over the next 6 weeks. Additionally, extramedullary hematopoiesis was noted in the liver beginning 4 weeks posttransplantation. To better characterize the infiltrating cell population, immunohistochemistry was performed on liver and spleen sections using antibodies against CD3 (pan-T lymphocyte marker), CD45/B220 (B-lymphocyte marker), F4/80 (monocyte/macrophage marker), NLDC145 (dendritic cell marker), and CD11c (dendritic cell/activated T-cell marker). B220 or F4/80 staining on FL-induced infiltrate showed the presence of a few B220+ or F4/80+ cells, especially on the margin of the infiltrate (data not shown). It is possible that these cells were attracted to, rather than actually being part of, the infiltrate. Most of the infiltrating cells were CD3+ or NLDC145+, suggesting a mixed population of dendritic cells and T lymphocytes. Double staining with antibodies against CD3 and NLDC145 showed that the infiltrate was, in fact, a mixed population of CD3+ (T lymphocyte) and NLDC145+ (dendritic) cells (data not shown). Most of the cell infiltrate was also CD11c+, suggesting that the T lymphocytes were activated.
DISCUSSION
We report here the hematopoietic effect(s) of chronically expressing FL in mice. Our data suggest that the physiologic role of FL might include effects on multipotent hematopoietic progenitors, including progenitors of both myeloid and lymphoid cell lineages, a result consistent with that reported by others.18 Flow cytometrical analysis of the bone marrow from FL-overexpressing animals showed a slight (twofold to threefold) increase in Sca+/Kit+ cells relative to controls, suggestive of an increase in hematopoietic progenitor cells (data not shown). The increased numbers of apparently normal circulating differentiated myeloid cells suggests that, although FL might affect production of myeloid precursors, it plays no significant role in vivo with regard to their continued proliferation and/or differentiation. Although many myeloid cell lines are positive for flt3 expression,27,28 it is unknown whether primary myeloid cells express the FLT3 receptor. However, the effect on circulating basophils is of particular interest, because FL does not seem to have any effect on tissue mast cells in vitro.15 Basophils and mast cells, although ontologically distinct, exhibit notable similarities, including the presence of cytoplasmic granules and involvement in host resistance to parasitic invasion. It is unknown whether FL has any effect on activation/degranulation of basophils, and it is possible that the increase in basophils is merely a consequence of increased progenitor numbers in the FL-overexpressing animals.
The present data can be interpreted to suggest that, whereas FL might participate in the proliferation of myeloid cell precursors, its major role in vivo is in the ontogeny of lymphoid and/or dendritic cells, a result consistent with recent reports.18,29 A mixed population of T cells and dendritic cells infiltrated all organ systems studied and led to disseminated disease. The spleen was the first tissue affected by the cellular infiltration and was eventually destroyed by fibrosis and necrosis. The mechanism of fibrosis in the present model is unknown, but might involve direct tissue damage by abnormal cell infiltrates or could be the result of secondary cytokine production. Dendritic cells are perhaps the most potent antigen-presenting cells and, as such, they can provide powerful local proliferative stimuli to T cells. Dendritic cells can also produce a wide variety of cytokines, including transforming growth factor-β, which can stimulate local tissue fibrosis.30 31 The local proliferation of activated T cells and the splenic fibrosis noted in the present model might be the result of dendritic cell activity, but investigation of this role awaits future studies. Splenic necrosis was thought to occur via blood vessel compression secondary to cellular infiltration of the perivascular space, ultimately leading to occlusion and infarct. The presence of similar cellular infiltrates in the blood vessels of the liver might have resulted in similar organ pathology and could have been the eventual cause of death in the FL-overexpressing animals.
In conclusion, these studies provide data on the role of FL in hematopoiesis in vivo and also provide insight into potential toxicities of FL administration. It is important to emphasize that gross infiltration of the splenic white pulp with abnormal cells occurred within 2 weeks of FL expression, suggesting significant potential risk even in short-term administration of recombinant FL.
Address reprint requests to Frederick A. Fletcher, PhD, Department of Developmental Hematology, Amgen, Inc, 1840 Dehavilland Dr, 99-1-A, Thousand Oaks, CA 93012-1789.

