Abstract
Characterization of hematopoietic cells and measurement of their proliferative potential is critical in many research and clinical applications. Because in vivo assay of human cells is not possible and xenogeneic assays are not yet routine, in vitro assays such as the long-term culture-initiating cell (LTC-IC) assay have been widely adopted. This study investigated LTC-IC assay linearity and reproducibility and resulting implications with respect to quantitation of primitive cell expansion. Measurement of secondary colony-forming cells (2° CFCs) from 5-week cultures of bone marrow (BM) mononuclear cells (MNCs) showed that 2° CFC frequency varied with assay plating density in a nonlinear fashion. The measured 2° CFC frequency increased from 4.6 to 63.8 (per 105 MNCs) as assay plating density was decreased from 5 × 10⁵ to 2 × 10⁴ MNCs per well (P < 10−6, n = 37). In contrast, assay of CD34-enriched cells was linear within the range studied. Assays of cells obtained from expansion cultures initiated with either MNCs or CD34-enriched cells were also nonlinear. Consequently, calculated 2° CFC expansion ratios were ambiguous and dependent on the assay plating densities used. Limiting dilution analysis (LDA) results were also nonlinear, with LTC-IC frequency increasing from 8.2 to 22.4 per 105 MNCs (P < 10−4, n = 100) as assay plating densities were decreased. Despite the nonlinearity, 2° CFC and LTC-IC assay results were consistent and reproducible over time with different samples and techniques and gave a semiquantitative indication of relative primitive cell frequency. Although CD34-enriched cells gave linear assay output, purification of cells for every assay is impractical. Therefore, exposure of cells to 5-fluorouracil (5-FU) was explored for improving assay linearity. Incubation of MNCs in 250 μg/mL 5-FU for 1 to 2 hours depleted accessory cells and resulted in a cell population that gave linear 2° CFC readout. The 5-FU–resistant LTC-ICs accounted for 49% of the total LTC-IC population, adding the potential benefit of restricting assay measurement to more primitive noncycling LTC-ICs. Consequently, similar linear assay results can be obtained with either the bulk 2° CFC or LDA LTC-IC methods after 5-FU, but multiple plating densities are nevertheless still required in both methods due to the greater than 100-fold range in primitive cell frequency present in normal human donor BM.
THE HEMATOPOIETIC system is composed of many different cell types at various stages of maturity. The characterization of these cells and measurement of their proliferative potential is critical in a number of research and clinical applications. The current definition of a hematopoietic stem cell includes the ability to confer long-term repopulation of the myeloid and lymphoid lineages of an ablated host. This activity can be greatly enriched in certain purified murine cell populations, supporting the hypothesis of pluripotent stem cells.1,2 Subsequent genetic marking experiments in mice have demonstrated that long-term engraftment of both lymphoid and myeloid lineages can indeed be achieved by the progeny of a single cell,3 thereby confirming the existence of true hematopoietic stem cells. Analogous in vivo experimental evidence for clonal, pluripotent human hematopoietic stem cells is thus far lacking. Xenogeneic transplant models have suggested that human stem cells with long-term repopulating ability exist, but these in vivo assays are not yet routine and suffer from low and variable levels of human chimerism.4-7
Although human hematopoietic stem cell transplantation is widely used to rescue patients after cytoablative therapies, quantitative in vivo human assays for hematopoietic cells are neither ethical nor practical. In an attempt to predict long-term in vivo repopulating ability, human cells have been cultured to assess their longevity in vitro. For example, the high proliferative potential colony-forming cell (HPP-CFC) assay requires 4 weeks of culture and identifies a cell that is more primitive than the colony-forming unit–granulocyte-macrophage (CFU-GM).8 Cells more primitive than the HPP-CFC are measured in the long-term culture-initiating cell (LTC-IC) assay that requires from 7 to 10 weeks of culture.8,9 This concept has been carried even further in the extended (E)LTC-IC assay, in which even more primitive cells are measured after as long as 16 weeks in vitro.10 It is uncertain whether these in vitro assays are truly measuring human long-term in vivo repopulating cells. Fortunately, a correlation between long-term in vitro and long-term in vivo repopulating ability has been demonstrated for different murine cell populations,11-13 suggesting that the same may be true for human cells. Consequently, the LTC-IC assay concept has been adopted by many investigators, using either 2° CFC measurement from bulk cultures14-20 or limiting dilution analysis (LDA)9 21-25 conditions to quantitate primitive human cells.
Original reports describing the use of a long-term culture system for the quantitation of primitive human hematopoietic cells stated that the assay readout of 2° CFC was linearly related to the input number of cells over a wide range tested,9,26 and this assumption is implicit in many studies using this assay. However, recent studies focusing on the effects of bone marrow (BM) cell inoculum density in 2-week cultures on irradiated stroma with growth factor supplementation showed that the output of cells, CFU-GM, and LTC-IC were not linear over any of the range of inoculum densities tested.27 These observations prompted a detailed study into the linearity of the LTC-IC assay using different fresh and expanded BM cell populations, and the implications with respect to measurement of primitive cell expansion were addressed. The quantitative measure of 2° CFC or LTC-IC was found to be critically dependent on the removal of accessory cells through either CD34-enrichment or 5-fluorouracil (5-FU) exposure.
MATERIALS AND METHODS
Medium and cytokines.
Medium for LTC-IC assays was prepared by supplementing Iscove's modified Dulbecco's medium (IMDM) with 10% horse serum, 10% fetal bovine serum (FBS), 4 mmol/L L-glutamine, 100 U/mL penicillin and 100 μg/mL streptomycin (all from GIBCO, Grand Island, NY), and 5 μmol/L hydrocortisone (Sigma, St Louis, MO). Medium for ex vivo expansion cultures was prepared by supplementing LTC-IC assay medium with 5 ng/mL PIXY321 (Immunex, Seattle, WA), 0.1 U/mL erythropoietin (Epo; Amgen, Thousand Oaks, CA), and 10 ng/mL c-kitligand (KL; Immunex), as previously described.28
Cells and cell separation procedure.
Human BM cells were obtained with informed consent from iliac crest aspirates or from BM processing screens (Baxter Fenwal, Deerfield, IL) obtained after the harvest of BM from normal donors. Mononuclear cells (MNCs) were collected by Ficoll (1.077 g/mL; Pharmacia, Uppsala, Sweden) separation and CD34-enriched cells were collected with a MACS laboratory separation system (Miltenyi Biotec, Auburn, CA), as previously described.29
Flow cytometry analysis.
Cells to be analyzed were washed and resuspended in phosphate-buffered saline (PBS; GIBCO) containing 1% bovine serum albumin (BSA; Intergen, Purchase, NY). Tubes containing 106 cells in 0.5 mL were stained with either phycoerythrin (PE)-HPCA-2 (anti-CD34) or PE-IgG (control) monoclonal antibodies (Becton Dickinson, San Jose, CA) along with a cocktail of lineage (lin)-specific antibodies: fluorescein isothiocyanate (FITC)-Leu4 (anti-CD3), FITC-Leu12 (anti-CD20), FITC-LeuM3 (anti-CD15; all from Becton Dickinson), FITC-anti-CD11b (Serotec, Indianapolis, IN), and FITC-anti-glycophorin A (Dako, Carpinteria, CA). After 15 minutes, cells were washed and resuspended in 0.5 mL PBS/BSA for analysis on either a FACS Vantage or FACScan (Becton Dickinson) flow cytometer.
Bulk 2° CFC long-term culture assay.
Five-week 2° CFCs were determined by culture on irradiated preformed stroma using a modification29 of a previously described procedure.9 Briefly, preformed stroma was prepared by trypsinizing adherent stromal cells from 2-week-old primary human BM cultures in LTC-IC medium. Cells were irradiated with 20 cGy from a 137Cs source and were immediately plated in 24-well plates in LTC-IC medium. Preliminary experiments determined that 5 × 10⁴ stromal cells per well were sufficient and maintained a nearly confluent layer of stroma for the duration of the assay (not shown). Test cells were added to these wells at the concentrations indicated using three to six replicates each. Plates were maintained at 33°C in a fully humidified atmosphere of 5% CO2 in air, and cultures were fed weekly by replacing 0.5 mL LTC-IC medium per well. At week 5, adherent and nonadherent cells were harvested from each well as previously described.29Cells from each well were transferred into a non-tissue culture-treated 35-mm dish (Nunc, Naperville, IL) containing methylcellulose colony assay medium, composed of 0.9% methylcellulose (Sigma), 30% FBS, 1% BSA, 100 μmol/L 2-mercaptoethanol (Sigma), 2 mmol/L L-glutamine (GIBCO), 5 ng/mL PIXY321, 5 ng/mL granulocyte colony-stimulating factor (G-CSF; Amgen), and 10 U/mL Epo. Cultures were maintained for 14 days and were then scored as previously described.29 For each sample, the total number of secondary colonies was enumerated and used to calculate the frequency of 5-week 2° CFCs per 105cells used to initiate the culture assay.
LTC-IC assay by LDA.
LTC-IC were determined by LDA of cultures on irradiated preformed stroma using a modification28 of a previously described technique.9 Briefly, irradiated stromal cells were prepared as described above and were added to 96-well plates at 104per well in 100 μL LTC-IC medium. Test cells were then added to these irradiated stromal layers at four concentrations in 100 μL LTC-IC medium per well (20 replicates each). The plates were then placed at 33°C in a fully humidified atmosphere of 5% CO2 in air, and cultures were fed weekly by replacing 100 μL LTC-IC medium per well. At week 5, adherent and nonadherent cells were harvested from each well as previously described.28 Cells from each well were added directly to 0.25 mL of colony assay medium in non-tissue culture-treated 24-well plates (Falcon, Lincoln Park, NJ). After 14 days, wells were scored for colonies as described above. For each sample, the number of LTC-IC was determined through an iterative calculation procedure30 based on the maximum likelihood solution method.31
In some experiments, the murine BM-derived stromal cell line M2-10B432 (American Type Culture Collection, Rockville, MD) was compared with human stroma for use in the assay. The LDA readout on primary human stroma was fivefold higher than on M2-10B4 at week 5 and eightfold higher at week 8 (P < 10−4, not shown). This result, along with the previous observation that there was little donor-to-donor variability in the ability of irradiated stroma generated from different human BM samples to support CD34-enriched cell growth,33 supported the use of human stroma in all assays.
5-FU exposure.
Because the observed nonlinearity in the 2° CFC and LDA LTC-IC assays appeared to be due to accessory cells, the use of the chemical purging agent, 5-FU, was explored. BM MNCs were suspended at 3 × 10⁶ cells/mL in LTC-IC medium containing 20 to 1,000 μg/mL 5-FU (Sigma). After 0.5 to 24 hours of incubation at 37°C, the cells were washed and then used to set up progenitor,29CFU-F,34 and LDA assays. The percent kill of each population was determined with respect to a control that was incubated for the same period of time without 5-FU.
RESULTS
Linearity of the Bulk 2° CFC long-term culture assay.
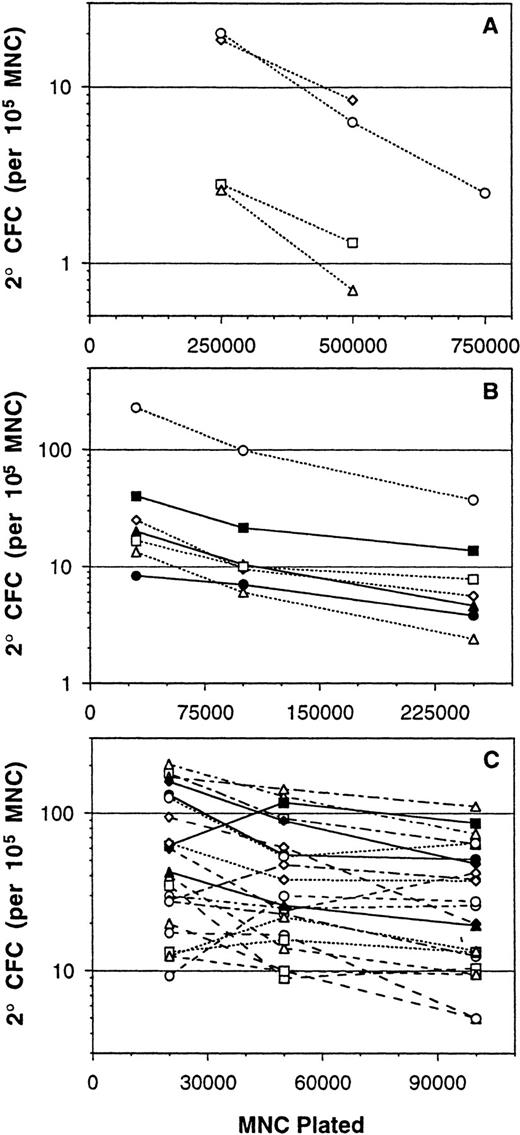
Original reports describing the use of a long-term culture system for the quantitation of primitive human hematopoietic cells stated that the assay readout of 2° CFC was linearly related to the input number of cells over a wide range tested.9,26 Consequently, bulk measurement of 2° CFC generated from a test population gave results that were similar to those obtained by LDA. The linear range for these bulk 2° CFC assays was reported to be up to 105low-density BM cells per well in 96-well plates and up to 106 cells per well in 24-well plates.9,26 Based on these published results, our laboratory had performed the bulk 2° CFC assay using a single density of 5 × 10⁵MNCs per well in 24-well plates. However, a subsequent unrelated study on the effect of inoculum density in 2-week MNC expansion cultures27 raised questions about the linearity of the bulk 2° CFC assay. Importantly, that study showed that cell and CFU-GM output from 2-week MNC expansion cultures changed little over a large range of inoculum densities.27 Furthermore, the addition of preformed stroma, which is used in 2° CFC and LTC-IC assays, caused the cell and CFU-GM output to be flat over an even larger range of MNC inoculum densities.27 These results showed that CFU-GM output from 2-week MNC expansion cultures on preformed stroma was not linearly related to the input number of cells. The implications of these results precipitated a study on the effect of plating density in the 5-week bulk 2° CFC assay. The first experiments were performed using plating densities of 2.5 × 10⁵ and 7.5 × 10⁵ cells per well in addition to our then standard 5 × 10⁵ cells per well (Fig1A). In four experiments, the measured frequency of 2° CFC (expressed per 105 cells) was significantly greater when the assay was plated at 2.5 × 10⁵ per well as compared with 5 × 10⁵ per well. The 2° CFC frequency was on average 2.8-fold greater (P < .01) when measured at the lower plating density.
Measurement of 2° CFC frequencies (expressed as number per 105 MNCs) from a series of BM MNC samples assayed over three ranges of plating densities. Bulk long-term culture assays were inoculated in 24-well plates at (A) 2.5 × 10⁵, 5 × 10⁵, and 7.5 × 10⁵cells per well (n = 4); (B) 3 × 10⁴, 105, and 2.5 × 10⁵ cells per well (n = 7); and (C) 2 × 10⁴, 5 × 10⁴, and 105 cells per well (n = 22). Each point represents the mean 2° CFC frequency from three to six replicate cultures, and lines connect the points performed with the same BM sample. A flat line with zero slope would indicate a linear assay response that is unaffected by the assay plating density.
Measurement of 2° CFC frequencies (expressed as number per 105 MNCs) from a series of BM MNC samples assayed over three ranges of plating densities. Bulk long-term culture assays were inoculated in 24-well plates at (A) 2.5 × 10⁵, 5 × 10⁵, and 7.5 × 10⁵cells per well (n = 4); (B) 3 × 10⁴, 105, and 2.5 × 10⁵ cells per well (n = 7); and (C) 2 × 10⁴, 5 × 10⁴, and 105 cells per well (n = 22). Each point represents the mean 2° CFC frequency from three to six replicate cultures, and lines connect the points performed with the same BM sample. A flat line with zero slope would indicate a linear assay response that is unaffected by the assay plating density.
The results above prompted study over a wider range of plating densities. Seven BM samples were assayed at 3 × 10⁴, 105, and 2.5 × 10⁵ cells per well (Fig1B). Again, the measured 2° CFC frequency was consistently higher from assays plated at lower densities. As compared with the values obtained at 2.5 × 10⁵ cells per well, 105cells per well gave 2.0-fold higher 2° CFC frequencies (P< .001) and 3 × 10⁴ cells per well gave 4.0-fold higher 2° CFC frequencies (P < .001). Another set of 22 BM samples was assayed at 2 × 10⁴, 5 × 10⁴, and 105 cells per well (Fig 1C), and once again, the measured 2° CFC frequencies were significantly higher at the lower plating densities. In this case, as compared with the values obtained at 105 cells per well, 5 × 10⁴cells per well gave 1.4-fold higher 2° CFC frequencies (P< .01) and 2 × 10⁴ cells per well gave 2.0-fold higher 2° CFC frequencies (P < .001).
Therefore, as the assay plating density was decreased, the measured 5-week 2° CFC frequency values increased to surprisingly high levels (Table 1). The average 2° CFC frequency measured at 5 × 10⁵ cells per well was 4.2 per 105 MNCs, whereas the average 2° CFC frequency measured at 2 × 10⁴ cells per well was 63.8 per 105 MNCs, a 15-fold difference.
Accessory cells increased nonlinearity in the 2° CFC assay.
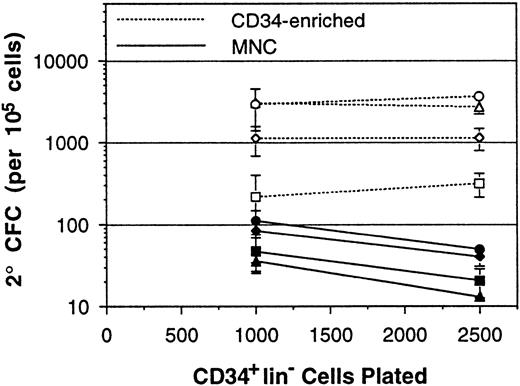
The effect of assay plating density on the measured 2° CFC frequency within BM MNC samples may have been due to the significant number of accessory cells that are present in each culture in addition to the primitive cells. To examine this hypothesis, assays were performed on CD34-enriched cells and MNCs from the same donors in parallel. CD34-enriched BM cells were plated at 1,000 and 2,500 CD34+lin− cells per well. As control, MNCs from the same donors were plated in parallel at densities to give 1,000 and 2,500 CD34+lin− cells per well, as determined by flow cytometry. Representative results from four of eight experiments are shown (Fig 2). Over the eight experiments, CD34-enriched cell assays inoculated at 1,000 CD34+lin− cells per well gave a 1.1-fold higher 2° CFC frequency readout than those inoculated at 2,500 CD34+lin− cells per well (1,787 v1,632 per 105, P = .30). In contrast, the paired MNC samples inoculated at 1,000 CD34+lin−cells per well gave a 1.7-fold higher 2° CFC frequency readout than those inoculated at 2,500 CD34+lin− cells per well (75 v 43 per 105, P = .02). Although CD34-enriched and MNC samples were inoculated to contain the same number of CD34+lin− cells per well, presumably containing the same number of LTC-IC, the assay readout from CD34-enriched samples was less influenced by plating density. Therefore, the presence of accessory cells in MNC samples increased assay nonlinearity.
Measurement of 2° CFC frequencies (per 105 cells) from a series of paired BM MNCs and CD34-enriched cell samples. Both MNCs and CD34-enriched cells were plated at densities to give 1,000 and 2,500 CD34+lin− cells per well. Each point represents the mean 2° CFC frequency (±SEM) from three to six replicate cultures, and lines connect the points performed with the same cells. Paired CD34-enriched cells and MNCs obtained from the same BM sample are indicated by use of the same plot symbol.
Measurement of 2° CFC frequencies (per 105 cells) from a series of paired BM MNCs and CD34-enriched cell samples. Both MNCs and CD34-enriched cells were plated at densities to give 1,000 and 2,500 CD34+lin− cells per well. Each point represents the mean 2° CFC frequency (±SEM) from three to six replicate cultures, and lines connect the points performed with the same cells. Paired CD34-enriched cells and MNCs obtained from the same BM sample are indicated by use of the same plot symbol.
Bulk 2° CFC assay of cells after an ex vivo expansion procedure.
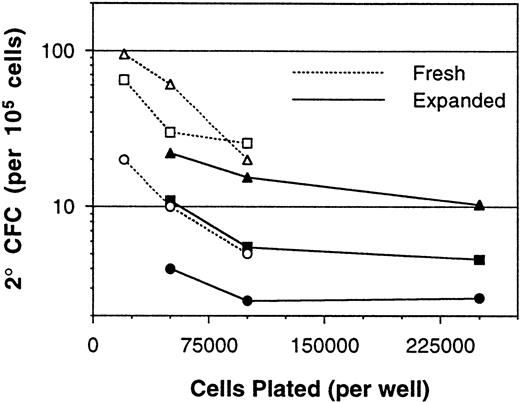
The above results demonstrated nonlinearity in the bulk 2° CFC assay, which was in part attributed to the presence of accessory cells. Because ex vivo cell expansion procedures result in cell populations that have considerable accessory cell content, the assay of cells after expansion culture was assessed next. BM MNCs expanded in 12-day perfusion cultures with PIXY321, KL, and Epo, as previously described,28 were assayed for 5-week 2° CFC content at several plating densities. These MNC samples displayed nonlinearity in the assay both before and after the expansion procedure (Fig 3). The consequences of this nonlinearity for the determination of expansion ratios were significant. In a representative experiment, using the various combinations of fresh and expanded cell assay plating densities, the 2° CFC expansion ratio was calculated to be anywhere from 0.4- to 4.2-fold (Fig 4).
Measurement of 2° CFC frequencies (per 105 cells) from a series of paired fresh and expanded BM MNC samples. Each point represents the mean 2° CFC frequency from three to six replicate cultures, and lines connect the points performed with the same cells. Paired fresh and expanded cells obtained from the same BM sample are indicated by use of the same plot symbol.
Measurement of 2° CFC frequencies (per 105 cells) from a series of paired fresh and expanded BM MNC samples. Each point represents the mean 2° CFC frequency from three to six replicate cultures, and lines connect the points performed with the same cells. Paired fresh and expanded cells obtained from the same BM sample are indicated by use of the same plot symbol.
Calculated 2° CFC expansion ratios as a function of assay plating densities. Fresh and expanded BM MNCs were assayed at different plating densities (the data set represented by triangles in Fig 3) and the 2° CFC frequencies at each density were used to calculate an expansion ratio. Calculated 2° CFC expansion varied significantly as the different points of Fig 3 for fresh and expanded 2° CFC frequencies were used for the calculation.
Calculated 2° CFC expansion ratios as a function of assay plating densities. Fresh and expanded BM MNCs were assayed at different plating densities (the data set represented by triangles in Fig 3) and the 2° CFC frequencies at each density were used to calculate an expansion ratio. Calculated 2° CFC expansion varied significantly as the different points of Fig 3 for fresh and expanded 2° CFC frequencies were used for the calculation.
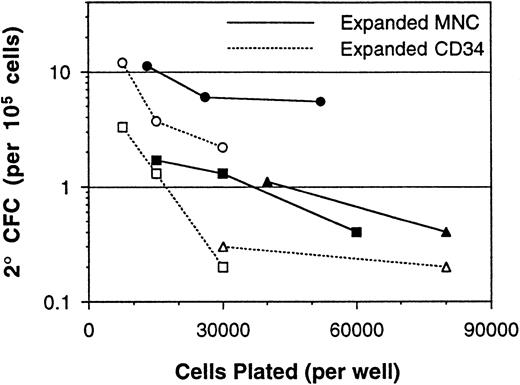
Although fresh CD34-enriched cells were found to be less affected by assay nonlinearity than MNC (Fig 2), it is known that expansion culture of CD34-enriched cells results in a population that contains many accessory cells.35 Therefore, CD34-enriched cells and MNCs from three donors were expanded and assayed in parallel. Each experiment showed that expanded cells, whether from a CD34-enriched or MNC inoculum, resulted in a population that gave nonlinear 2° CFC assay readout (Fig 5). Importantly, expanded MNCs consistently contained a higher frequency of 2° CFC than expanded CD34-enriched cells, even though the 2° CFC frequency was considerably higher in the CD34-enriched fraction before the expansion procedure. Although these data are consistent with previous reports on the increased LTC-IC output from MNC cultures as compared with CD34-enriched cell cultures,29 36 the nonlinearity of the assay makes absolute quantitation of the differences difficult. The magnitude of the difference varied with assay plating density, but the trend of greater 2° CFC frequency in expanded MNCs was maintained throughout the range examined.
Measurement of 2° CFC frequencies (per 105 cells) from a series of paired expanded BM MNCs and CD34-enriched cell samples assayed over a range of plating densities. Each point represents the mean 2° CFC frequency from three to six replicate cultures, and lines connect the points performed with the same cells. Paired MNC and CD34-enriched cells obtained from the same BM sample are indicated by use of the same plot symbol.
Measurement of 2° CFC frequencies (per 105 cells) from a series of paired expanded BM MNCs and CD34-enriched cell samples assayed over a range of plating densities. Each point represents the mean 2° CFC frequency from three to six replicate cultures, and lines connect the points performed with the same cells. Paired MNC and CD34-enriched cells obtained from the same BM sample are indicated by use of the same plot symbol.
LDA.
The high 5-week 2° CFC frequencies obtained from bulk assays at low plating densities (Table 1) began to approach values that might be expected for CFU-GM assays performed on fresh BM (typically 200 to 500 per 105 MNCs). However, the 5-week 2° CFC assay presumably measures a primitive cell that is significantly more rare than CFU-GM. This discrepancy can only be explained if the number of 2° CFC obtained per LTC-IC is significantly greater than the value of four that has been reported.9 Also, plating densities in the bulk 2° CFC assay could not be reduced below 2 × 10⁴ MNCs per well to search for a linear range, because the number of 2° CFCs scored per well became very low and statistically insignificant given the number of replicates performed in the bulk assay.
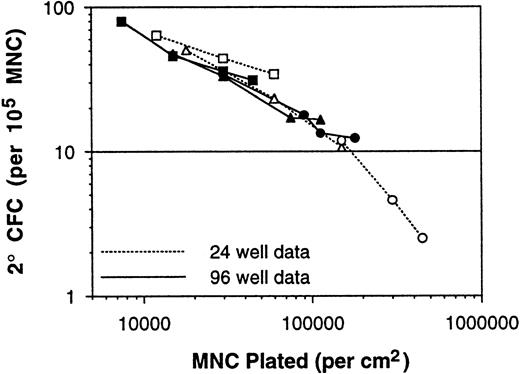
These two issues were addressed by performing LTC-IC LDA assays on a series of BM MNC samples using 96-well plates inoculated at various densities. Even under these limiting dilution conditions, the measured 2° CFC frequencies continued to increase as the plating density was decreased (Table 2). At the lowest plating density of 2,500 MNCs per well, the measured 2° CFC frequency was 80.0 per 105 MNCs. Because 24-well plates have fivefold more surface area than 96-well plates (1.8 v 0.35 cm2), the data of Table 2 are consistent with the data of Table 1. In fact, when the average 2° CFC frequencies from the different experimental series are plotted versus the assay plating density per square centimeter (instead of per well), the consistency of the long-term culture assay data is quite remarkable (Fig 6), even though these 137 BM samples were assayed over a period of 3 years using the different assay methods and different irradiated stromal layer sources. Therefore, the ability to generate 2° CFC in a 5-week culture, on a per inoculum cell basis, is related to the surface density of cells plated in the assay in addition to the absolute number of stem cells plated.
Plot of average 2° CFC frequencies (per 105 MNCs) versus the assay plating density (in cells per square centimeter). Consistency of the long-term culture assay data and dependence on assay plating density is demonstrated with the data from 137 BM samples (Tables 1 and 2).
LDA of the data was also performed using an iterative maximum likelihood solution method.30,31 Several groups of plating densities were used to perform the assay. The mean LTC-IC frequency ranged from 8.2 per 105 MNCs at the highest group of plating densities to 22.4 per 105 MNCs at the lowest group of plating densities (Table 2). Because of the large number of samples analyzed with each group of plating densities, these differences were highly significant. Therefore, using the higher plating densities for LDA, LTC-ICs were found to be present at a frequency of 1 per 12,195 MNCs, which is comparable to previously reported values.29However, when the assay was performed at lower plating densities, the LTC-IC frequency was found to be 1 per 4,464 MNCs, which is significantly less rare (P < 10−4). A frequency histogram of measured LTC-IC densities (using the lowest assay plating densities of Table 2) showed a log-normal distribution within the donor population that covered a 175-fold range (0.6 to 105 LTC-ICs per 105 MNCs; Fig 7A). Because the LTC-IC frequency calculated by LDA decreased with increasing plating density in a fashion similar to the decrease in 2° CFC frequencies, the number of 2° CFC generated per LTC-IC was not dependent on the assay plating density. Instead, the average number of 2° CFCs per LTC-IC varied from donor-to-donor approximately within the range of one to four, with an apparent bimodal distribution (Fig 7B).
Frequency histogram of LTC-IC densities (expressed as number per 105 MNCs) in 53 BM samples measured by LDA using 2.5 × 10³, 5 × 10³, 104, and 2 × 10⁴ MNCs per well. (A) BM MNC LTC-IC densities in the donor population were log-normally distributed. (B) The number of 2° CFCs generated per LTC-IC varied from donor-to-donor, with an apparent bimodal distribution.
Frequency histogram of LTC-IC densities (expressed as number per 105 MNCs) in 53 BM samples measured by LDA using 2.5 × 10³, 5 × 10³, 104, and 2 × 10⁴ MNCs per well. (A) BM MNC LTC-IC densities in the donor population were log-normally distributed. (B) The number of 2° CFCs generated per LTC-IC varied from donor-to-donor, with an apparent bimodal distribution.
LDA assay of MNCs after exposure to 5-FU.
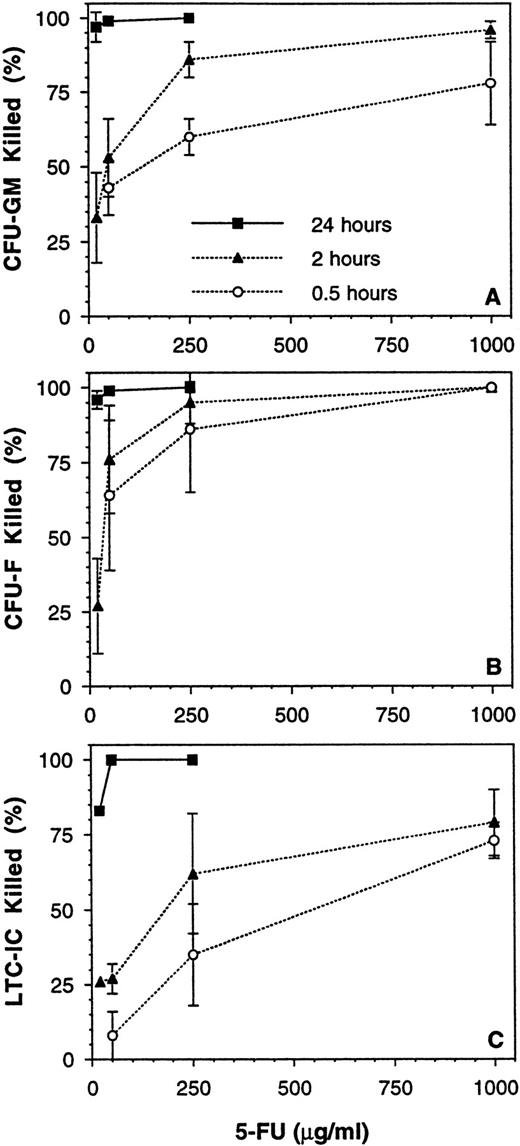
The results given above demonstrated that 2° CFC and LTC-IC cannot be definitively quantitated in the presence of accessory cells, but that this can be overcome by CD34-enrichment of the cell population to be assayed. However, this is not a practical approach for use in a typical laboratory setting with a large number of experiments. Therefore, the use of the chemical purging agent, 5-FU, was explored as a potential means of reducing accessory cell nonlinearity. A series of 10 experiments was performed to determine the time and dose of exposure that would deplete mature cells (eg, CFU-GM and burstforming unit-erythroid [BFU-E]) and accessory cells (eg, CFU-fibroblast [CFU-F]) while sparing the majority of LTC-IC. Exposure to ≥20 μg/mL 5-FU for 24 hours at 37°C was highly toxic to all cell populations (Fig 8). An exposure time of 0.5 to 2 hours at a dose of 250 μg/mL gave a consistent high kill (>85%) of CFU-F and a moderate kill (60% to 85%) of CFU-GM, whereas most LTC-ICs were spared. Control untreated BM MNCs again gave nonlinear results, with the measured 2° CFC frequency being 2.2-fold greater when assayed at 2.5 × 10³ per well as compared with 2 × 10⁴ per well (P < .05, Table 3). In contrast, MNCs exposed to 250 μg/mL 5-FU for 1 to 2 hours gave a linear 2° CFC measurement over the assay plating density range tested (P = .47). The frequency of 5-FU–resistant LTC-ICs was 7.2 per 105 MNCs, 49% of the total LTC-IC compartment under these conditions (P < .05). Cells obtained after ex vivo expansion of BM MNCs (using the perfusion method described above) were also assessed, and 42% of these LTC-IC were 5-FU resistant (n = 3), which is similar to the fresh MNC result. However, the response of expanded cells to 5-FU will probably vary greatly depending on the method of expansion chosen.
Effect of time and dose of 5-FU exposure on various BM MNC populations. BM MNCs from 10 donor samples were exposed to various doses of 5-FU for 0.5, 2, and 24 hours at 37 °C. The mean (±SEM) percentages of (A) CFU-GM, (B) CFU-F, and (C) LTC-IC killed by the various exposures are shown.
Effect of time and dose of 5-FU exposure on various BM MNC populations. BM MNCs from 10 donor samples were exposed to various doses of 5-FU for 0.5, 2, and 24 hours at 37 °C. The mean (±SEM) percentages of (A) CFU-GM, (B) CFU-F, and (C) LTC-IC killed by the various exposures are shown.
DISCUSSION
The assay of primitive human hematopoietic cells is of great clinical and scientific interest. In vitro assays for these cells have focused on the ability of a cell population to generate progenitor cells over an extended period of time in culture. A number of studies have shown that cells enriched to contain long-term in vivo repopulating ability are also enriched in long-term in vitro repopulating ability.11-13 On this basis, the development of the LTC-IC assay as a quantitative stem cell assay was undertaken.9,11To be considered quantitative, an assay must deliver a predictable output in response to varying input cell numbers. Although it was originally thought that the LTC-IC assay fulfills this criterion in a linear fashion,9 26 this hypothesis has not been borne out during the accumulated use of this assay with hundreds of BM samples. In fact, the large majority of samples assayed displayed declining 2° CFC and LTC-IC frequencies as the assay plating density was increased. This nonlinearity compromises the ability of the assay to quantitatively measure LTC-IC within BM populations that contain accessory cells.
LTC-IC assay results, whether performed in bulk culture using 2° CFC readout or under LDA conditions, were found to be nonlinear with respect to the input number of MNCs over the entire range tested. Because the number of 2° CFCs per LTC-IC did not vary with assay plating density, results obtained from bulk 2° CFC measurements were comparable to results obtained by LDA, consistent with previous reports.9 However, if only one assay density is used for bulk 2° CFC cultures, there is a significant risk of obtaining too few (<10) raw colonies per plate (resulting in statistically weak data) or too many (>70) raw colonies per plate (resulting in inaccurate counts from crowded plates). Because the measured 2° CFC and LTC-IC frequencies in human BM samples was found to cover a greater than 100-fold range, no single plating density could accurately cover this range. In contrast, LDA typically use multiple plating densities, thereby reducing the probability of this pitfall.
The assay readout was less influenced by plating density when CD34-enriched cells were used, suggesting that the observed nonlinearity was, at least in part, due to the presence of CD34− accessory cells. However, assays of CD34-enriched cells also became nonlinear at high density, so a general cell crowding/inhibition effect appears to be at work. This nonspecific cell crowding/inhibition effect is considerably more pronounced with nonpurified cells, because so many nonpurified cells must be plated to obtain a measurable signal from the rare LTC-IC population. Because most cell populations subjected to LTC-IC assay contain accessory cells, the LTC-IC assay generally cannot be considered quantitative. For example, the measurement of LTC-IC expansion requires different cell populations to be assayed, often containing very different accessory cell populations that would be expected to influence LTC-IC assay readout in an unpredictable manner. In fact, the net result of differing accessory cell content of pre-expansion and post-expansion populations resulted in ambiguous data (eg, Fig 4).
Although LTC-IC assay of nonpurified cell mixtures was not definitively quantitative, the assay displayed a semiquantitative quality. For instance, the comparative ranking of different BM samples with respect to LTC-IC content was generally conserved when the assay was performed at different densities, even though the absolute number of LTC-ICs varied with density. Therefore, assay of nonpurified cells can give a semiquantitative indication of LTC-IC when comparing one population with another. This type of semiquantitative analysis would be most accurate when the different cell populations are plated at densities that yield similar raw colony counts. For example, a population containing 10 2° CFC per 105 cells should be plated at a density that is 10-fold greater than a population containing 100 2° CFC per 105, such that the number of colonies counted from both sets of plates will be similar, within the operational range of 10 to 70 colonies per plate and therefore within the same range of the nonlinear assay response curve.
Although CD34-enriched cells gave linear assay output, the use of cell purification for every LTC-IC assay is impractical in most laboratory settings. Therefore, if quantitative LTC-IC assays are to be performed, an alternative method for depleting accessory cells while sparing stem cells would be useful. The chemical purging agent, 5-FU, has been shown to kill certain mature cell populations while sparing primitive cells. In fact, this purging strategy has been used for the development of the pre–CFU-GM delta assay37 and for the functional isolation of primitive hematopoietic cells.38The current study showed that a relatively short exposure of BM MNCs to 5-FU preferentially depleted accessory cells, particularly CFU-F, to a greater extent than LTC-ICs. After 5-FU exposure, 2° CFC measurement became linear, thereby providing a method that is a simple and attractive alternative to CD34-enrichment. As an additional benefit of this procedure, 5-FU resistance selects noncycling LTC-ICs that are more primitive38 and perhaps more representative of quiescent cells, which are reported to have greater in vivo repopulating activity.39 40
In conclusion, primitive cell measurement using the bulk 2° CFC or LDA LTC-IC methods is semiquantitative unless care is taken to eliminate assay nonlinearity due to accessory cells. Linear assay response can be achieved from BM cells after CD34-enrichment or after a relatively simple exposure to 5-FU. Similar study of assay linearity is warranted for cord blood cells, which are known to behave in a nonlinear manner (not shown), and mobilized peripheral blood cells. Although the bulk and LDA methods yield similar data, multiple plating densities are required in both methods due to the greater than 100-fold range in primitive cell frequencies present in the normal human donor population.
ACKNOWLEDGMENT
The authors thank Robert J. Maher, Maritza Oxender, Mahshid Palsson, and Jason Williams for excellent technical assistance, and Drs Randy Broun (St Louis University, St Louis, MO), Albert Deisseroth (M.D. Anderson, Houston, TX), Melissa Fenner (University of Michigan, Ann Arbor, MI), Voravit Ratanatharathorn (Harper Hospital, Detroit, MI), Lyle Sensenbrenner (Harper Hospital), and Joseph Uberti (Harper Hospital) for BM specimens. We also thank Dr Kristin Goltry for critical reading of the manuscript.
Address reprint requests to Alan K. Smith, PhD, Aastrom Biosciences, Inc, PO Box 376, Ann Arbor, MI 48106.
The publication costs of this article were defrayed in part by page charge payment. This article must therefore be hereby marked "advertisement" is accordance with 18 U.S.C. section 1734 solely to indicate this fact.

