Abstract
Monocytes/macrophages exert a series of important functions in vivo. To facilitate detailed investigation of their functional capacity and the mechanism leading to their differentiation, several cell lines have been established from primary material. We present here a new human monoblastic cell line, designated UG3. UG3 cells are characterized by the following features. (1) UG3 cells harbor the t(9;11)(p22;q23) translocation that results in fusion of the MLL and the AF9 genes and produce the corresponding AF9-MLL and MLL-AF9 fusion transcripts. (2) UG3 cells rely on the presence of exogenous growth factors for viability and proliferation, such as interleukin-3 (IL-3), granulocyte-macrophage colony-stimulating factor (GM-CSF), granulocyte colony-stimulating factor (G-CSF), or macrophage colony-stimulating factor (M-CSF). (3) When cultured in the presence of G-CSF, UG3 cells differentiate along the granulocytic lineage, as evidenced by segmentation of nuclei and positive staining for neutrophilic alkaline phosphatase and peroxidase. (4) When cultured in the presence of GM-CSF or M-CSF, UG3 cells differentiate into mature macrophages while preserving surface expression of CD14 and CD68 and also start to release cytokines into cell-culture supernatants. Under these culture conditions, UG3 cells also take up acetylated LDL. (5) When cultured in the presence of M-CSF and IL-4, UG3 cells differentiate into osteoclast-like multinucleated giant cells capable of bone resorption and display tartrate-resistant acid phosphatase (TRAP) activity. UG3 cells thus provide features to qualify them as a useful model to further investigate the mechanism underlying these processes and also to further elucidate the functional role of mature monocytes/macrophages or osteoclasts.
MONOCYTES/MACROPHAGES exert a variety of important functions, including phagocytosis, release of proinflammatory cytokines, antigen presentation, and incorporation of lipids. Upon appropriate stimulation, they are also capable of differentiating into osteoclasts or dendritic cells. Several cell lines have been established from primary material and serve as models to further study function as well as differentiation of the monocyte/macrophage lineage. THP-1 cells,1 for example, when exposed to phorbol ester (phorbol myristate acetate [PMA]) express CD142 and CD36,3 display phagocytotic ability,4 and produce tumor necrosis factor α (TNFα).5 U937 cells6 incubated with PMA express CD363 and produce TNFα,5interleukin-6 (IL-6),7 and macrophage colony-stimulating factor (M-CSF).8 Furthermore, the combination of vitamin D3 and a lymphokine, such as IL-2, α-interferon, or γ-interferon, promotes differentiation of U937 cells into osteoclast-like cells.9 Similarly, HL60 cells incubated with vitamin D3 or PMA also differentiate into osteoclast-like cells.10,11 Recently, it has been pointed out that monocytes/macrophages induced to differentiate by M-CSF differ from those induced by granulocyte-macrophage colony-stimulating factor (GM-CSF) in terms of terminal differentiation and function.12-17 It has also been reported that GM-CSF spurs differentiation of peripheral blood monocytes (PBMs) into dendritic cells when combined with IL-4 and/or TNFα.18,19In contrast, M-CSF and IL-4 promote differentiation of PBMs into osteoclasts.18 To date, no human cell line has been established that can be maintained and induced to differentiate into monocytes/macrophages by physiological stimuli alone. Therefore, a detailed analysis of the molecular mechanism of differentiation into either dendritic cells or osteoclasts has been hampered by the lack of a suitable cell model.
We present here a novel human cell line, designated UG3, that, unlike previous established human cell lines, including THP-1, U937, or HL60 cells, has preserved the ability to differentiate along either lineage upon exposure to physiologic stimuli. Thus, UG3 cells may prove useful to study the mechanism underlying the differentiation process as well as to further elucidate the functional role of monocytes/macrophages, even though these are established from leukemic cells. Moreover, UG3 cells carry the chromosomal translocation t(9;11)(p22;q23) and synthesize the corresponding AF9-MLL as well as the MLL-AF9 fusion transcripts. They may thus also represent a valuable tool to further investigate leukemogenesis resulting from the 11q23 anomaly.
MATERIALS AND METHODS
Case history.
A 26-year-old Japanese woman was admitted with gingival swelling and skin rashes. She had had no known exposure to cytotoxic drugs or radiation and no prior history of hematological disorders. On admission, her peripheral blood counts were 6,500/μL white blood cells with 26.5% blast cells, 3.9 × 10⁶/μL red blood cells, 13.4 g/dL hemoglobin, and 8.7 × 10⁴/μL platelets. Bone marrow aspirate showed a hypercellular marrow infiltrated with 96.8% monoblasts. Surface markers analyzed by fluorocytometry were as follows: CD11a, 88.9%; CD11b, 38.3%; CD11c, 92.3%; CD13, 10.9%; CD14, 1.1%; CD33, 90.8%; and HLA-DR, 58.3%. Cytogenetic studies showed a consensus karyotype of 45XX, −7, t(9;11)(p22;q23). The patient was subsequently diagnosed as AML(M5). On postchemotherapy nadir, the patient received 75 μg/d granulocyte colony-stimulating factor (G-CSF), which resulted in a marked increase in the leukocyte count, which increased from 1,000/μL to 23,200/μL with 84.5% blast cells. After terminating G-CSF treatment, the white blood cell count decreased immediately to the level before G-CSF injection. Upon G-CSF–induced leukocytosis, a peripheral blood sample was obtained with informed consent.
Cytokines and antibodies.
Recombinant human stem cell factor (SCF), IL-3, and IL-6 were provided by Kirin Brewery Co, Ltd (Tokyo, Japan). Recombinant human M-CSF20 was provided by Morinaga Milk Industry Inc (Tokyo, Japan). Recombinant human GM-CSF, G-CSF, IL-1, IL-2, IL-4, IL-5, IL-7, and flt3 ligand were purchased from Genzyme Corp (Cambridge, MA). Fluorescein isothiocyanate (FITC)-labeled monoclonal antibodies (MoAbs) against CD14, CD36, CD64, CD71, and HLA-DR and phycoerythrin (PE)-labeled MoAbs against CD13, CD16, and CD33 were purchased from Coulter Corp (Hialeah, FL). PE-labeled MoAb against CD11c and CD54, biotin-conjugated MoAb against G-CSF receptor (G-CSFR), biotin-conjugated murine IgG1 as a control, and PE-labeled avidin were obtained from Pharmingen (San Diego, CA). PE-labeled MoAb against CD11b, MoAb against CD68, FITC-conjugated rabbit antimouse IgG1 Ab, and mouse IgG1 as a control were purchased from Dako Japan (Kyoto, Japan). FITC-labeled MoAb against c-kit was obtained from Nichirei Co Ltd (Tokyo, Japan).
Cell culture.
Fresh leukemic blasts were obtained from the peripheral blood of the patient at marked blastosis after G-CSF injection. Cells were separated by Ficoll-Hypaque (d = 1.077; Pharmacia LKB, Uppsala, Sweden) density gradient centrifugation at 400g for 30 minutes. The interphase containing mononuclear cells was harvested and then washed twice with phosphate-buffered saline (PBS) and once with fresh Iscove's modified Dulbecco's medium (IMDM; GIBCO BRL, Gaithersburg, MD). Cells were cultured at a density of 2.5 × 10⁵/mL in IMDM supplemented with 5% fetal calf serum (FCS; CSL Ltd, Victoria, Australia) and IL-3 (5 ng/mL) at 37°C in an atmosphere of 5% CO2 in air. The medium was exchanged every 4 to 7 days depending on the rate of cell growth. After 8 weeks of culture, the cells were cloned by hand-picking a colony from semisolid culture. Some of the cells maintained with IL-3 were washed twice with PBS and then moved to IMDM containing 5% FCS and 100 ng/mL M-CSF, 10 ng/mL G-CSF, or 1 ng/mL GM-CSF, respectively. In all experiments, cells were cultured for 2 weeks in the presence of one of the cytokines and then further analyzed. Half of the culture medium was exchanged every 4 days to fresh medium containing a cytokine at the described concentration. In selected experiments, a combination of 100 ng/mL SCF, 20 pg/mL IL-1, and 10 ng/mL IL-6 were also added to the culture.
Growth response to cytokines.
To measure growth response of UG3 cells under various experimental conditions as outlined in the legends to the respective figures, MTT assay21 was performed. Briefly, 180 μL of cells (1 to 2 × 10⁵ cells/mL) were cultured for a period of 7 days in the presence or absence of cytokines as indicated in the respective figure legends in 96-well microplate. Twenty microliters of sterilized MTT [5 mg/mL; 3-(4,5-dimethyl-2,5-diphenyl-2H tetrazolium bromide); Wako Pure Chemical Industries Ltd, Osaka, Japan] was added to each culture well and incubated for an additional 4 hours at 37°C in a CO2 incubator. After centrifugation of the cell culture wells, the cell-free culture supernatants were discarded and cells were resuspended with 200 μL of dimethyl sulfoxide (DMSO). The plates were read by a MTP-120 Microplate Reader (Corona Electric Co, Ibaragi, Japan) at a wave length of 570 nm. In selected experiments, cell number was determined with a hematocytometer after trypan blue dye exclusion.
Morphological analysis.
Cells were washed twice and moved to IMDM containing cytokine and cultured for 2 weeks in Slide Flasks (Nunc A/S, Roskilde, Denmark) to allow for in situ evaluation of adherent cells. Nonadherent cells were evaluated in situ on cytospin slides using Cytospin 2 (Shandon Southern Products Ltd, Cheshire, UK). Slides were stained with May-Grünwald-Giemsa, peroxidase, neutrophilic alkaline phosphatase (NAP), α-naphthyl butyrate esterase (αNB), and naphthol AS-D chloracetate esterase (NAC). Some slides were also stained for tartrate-resistant acid phosphatase (TRAP) using a commercially available kit (Sigma Diagnostics, St Louis, MO) according to the manufacturer's instructions.
Cytogenetic analysis.
Chromosomes were analyzed using standard techniques and Giemsa Trypsin G (GTG) bandings.
Reverse transcription-polymerase chain reaction (RT-PCR) and sequencing.
RT-PCR and Southern blot analysis were performed to detect cytokine receptor mRNA and fusion transcripts resulting from t(9;11). Total cellular RNA was isolated with RNAzolB according to the manufacturer's instructions (Biotecx Laboratories, Inc, Houston, TX). RNA concentrations were measured spectrophotometrically using a GeneQuant (Pharmacia LKB, Uppsala, Sweden). Complementary DNA (cDNA) was synthesized by reverse transcription in an 80-μL reaction mixture containing 1 μg total cellular RNA, 150 μg/mL random hexanucleotide, and 50 U reverse transcriptase (Seikagaku Co, Tokyo, Japan). As a control, we prepared templates containing the same components except for reverse transcriptase. A volume of 0.5 μL cDNA reaction mixture or control template was amplified in the presence of 1 U Thermus aquaticus DNA polymerase (Takara, Shiga, Japan), 25 mmol/L dNTP, and 10 mmol/L of each specific primer (Table 1) in a total volume of 20 μL in a Thermal Cycler (Perkin-Elmer Cetus, Norwalk, CT).22 One PCR cycle consisted of denaturation at 95°C for 1 minute, primer annealing at 62°C for 1 minute, and extension at 72°C for 2 minutes. This cycle was repeated 40 times. An aliquot of 6 μL of each PCR reaction was electrophoresed in 3% agarose (NuSieve; FMC BioProducts, Rockland, ME), stained with ethidium bromide, and transferred to a nylon membrane (Hybond N; Amersham Japan, Tokyo, Japan). After hybridization with specific biotin-labeled oligonucleotides, the membrane was incubated with avidin-alkaline phosphatase and visualized by chemiluminescence of alkaline phosphatase-lumigen PPD (Boehringer Mannheim Japan, Tokyo, Japan) reaction. The nucleotide sequences of the specific primers and probes are shown in Table 1. Nucleotide sequences of some of the amplified fragments were determined by the cycle sequence method using ABI PRISM Dye Primer Cycle Sequencing Core Kit (Perkin-Elmer Cetus, Norwalk, CT) according to the manufacturer's instructions.
Clonogenic assay.
UG3 cells were moved to IMDM containing 5% FCS supplemented with 100 ng/mL M-CSF, 10 ng/mL G-CSF, or 1 ng/mL GM-CSF, respectively, after being washed twice with PBS. After cell culture for 0, 7, or 14 days in the presence or absence of each cytokine, cells were suspended in semisolid IMDM containing 0.9% methyl cellulose, 30% FCS, and 1% bovine serum albumin. One milliliter of culture medium containing 1,000 cells was incubated in duplicate in 35-mm dishes at 37°C in 5% CO2 in a humidified incubator. After 1 week, cell aggregates of more than 30 cells were counted as colonies. Some colonies were picked from each dish, suspended in IMDM, and evaluated in situ on cytospin slide preparations as described in “Morphological analysis.”
Immunophenotyping.
Most cell surface antigens were detected by standard direct immunofluorescence assay. In brief, cells were maintained for 2 weeks in the presence of IL-3, GM-CSF, G-CSF, or M-CSF; then incubated at 4°C for 40 minutes with FITC- or PE-conjugated mouse MoAbs; and washed twice with PBS. After washing, 20,000 cells per sample were analyzed using a fluorocytometric analyzer (EPICS XL; Coulter Corp, Hialeah, FL). For G-CSFR analysis, cells were first incubated with biotin-labeled mouse anti–G-CSFR MoAbs for 40 minutes at 4°C. After repeated washings, cells were then incubated with avidin-conjugated PE at 4°C for an additional 40 minutes. After additional washings, cells were analyzed by fluorocytometry as described above for direct immunofluorescence assay. To analyze for CD68 expression, immunohistochemistry was performed using the Histofine detection system (Nichirei Co Ltd, Tokyo, Japan). Three hundred cells were counted and the percentage of cells staining positive for CD68 was determined.
Detection of cytokines in the culture supernatant.
UG3 cells, maintained in the presence of IL-3, GM-CSF, or M-CSF for 2 weeks, were washed twice with PBS and moved to IMDM containing 5% FCS without any cytokines, with the final cell concentration being 2 × 10⁵/mL. After 6 hours, culture supernatants were analyzed by enzyme-linked immunosorbent assay (ELISA) using commercially available kits according to the manufacturer's instructions. The kits used for analysis were as follows: IL-1β (minimal detectable concentration [MDC], 3.9 pg/mL), IL-6 (MDC, 3.1 pg/mL), IL-8 (MDC, 31.3 pg/mL), IL-12 (MDC, 7.8 pg/mL), TNFα (MDC, 15.6 pg/mL), monocyte chemoattractant protein-1 (MCP-1; MDC, 31.3 pg/mL), G-CSF (MDC, 39.1 pg/mL), M-CSF (MDC, 31.3 pg/mL), and GM-CSF (MDC, 7.8 pg/mL), which were all supplied by R&D Systems, Inc (Minneapolis, MN); IL-10 (MDC, 14 pg/mL) and interferon γ (IFNγ; MDC, 0.1 U/mL), which were supplied by Medgenix (Fleurus, Belgium); IL-15 (MDC, 10 pg/mL), which was purchased from Genzyme; and lysozyme (MDC, 1.5 g/mL), which was obtained through Sigma.
Uptake of acetylated LDL.
UG3 cells were cultured for 2 weeks in the presence of IL-3, GM-CSF, or M-CSF. Then, 1,1′-dioctadecyl-1-1-3,3,3′3′-tetramethyl-indo-carbocyanine perchlorate–labeled acetylated low-density lipoprotein (DiI-Ac-LDL; Biomedical Technologies Inc, Stoughton, MA) was added to the culture medium at a final concentration of 10 μg/mL. The cells were incubated for 4 hours at 37°C, washed with PBS, and then fixed and analyzed using a fluorescence microscope. To determine the percentage of cells having taken up DiI-Ac-LDL, 300 cells were counted.
Osteoclast differentiation assay.
UG3 cells were cultured in IMDM containing 5% FCS and 100 ng/mL M-CSF for 2 weeks, washed twice with PBS, and thereafter exposed to IMDM supplemented with 5% FCS, M-CSF (100 ng/mL), and IL-4 (100 U/mL) for an additional 2 weeks. Then, UG3 cells were stained for TRAP as detailed in “Morphological analysis.” To analyze for bone resorption activity, cells were first cultured for 2 weeks in IMDM containing 5% FCS and M-CSF (100 ng/mL) and then seeded on glass slides covered with hydroxyapatite (Osteologic; Millennium Biologix Inc, Kingston, Ontario, Canada) in IMDM with 5% FCS supplemented with a combination of IL-4 (100 U/mL) and M-CSF (100 ng/mL) or IL-3 (5 ng/mL) for an additional 3 weeks before being subjected to Von Kossa staining.23
Statistical analyses.
Statistical analyses were performed with the Student's t-test, except for the clonogenic assay, which was evaluated with the pairedt-test.
RESULTS
Establishment of the cell line.
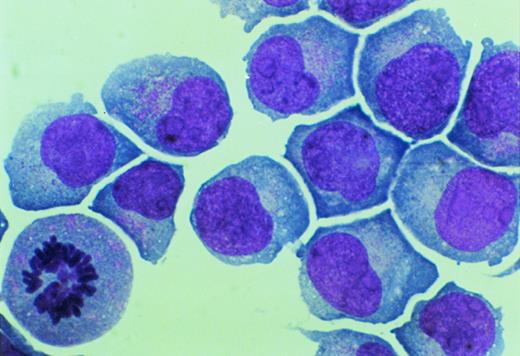
Primary mononucleated interphase cells were maintained in liquid culture supplemented with IL-3 for 8 weeks, during which time cell growth stabilized with a doubling time of 4 to 7 days. A cell aliquot was then transferred to semisolid cultures supplemented with IL-3 (5 ng/mL). Individual cells were obtained by hand-picking from semisolid cultures and were moved again to suspension culture. One cell line, designated UG3, grew as a single-cell suspension with a doubling time of 60 to 70 hours in the presence of IL-3. UG3 cells were round with basophilic cytoplasm that contained azurophilic granules and had soy-bean like nuclei with a few nucleoli (Fig 1).
Morphology of UG3 cultured in the presence of IL-3 (5 ng/mL). May-Grünwald-Giemsa staining. Original magnification, 300-fold.
Morphology of UG3 cultured in the presence of IL-3 (5 ng/mL). May-Grünwald-Giemsa staining. Original magnification, 300-fold.
Response to cytokines.
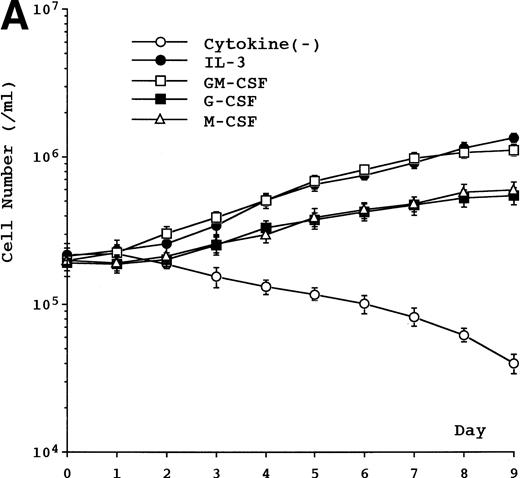
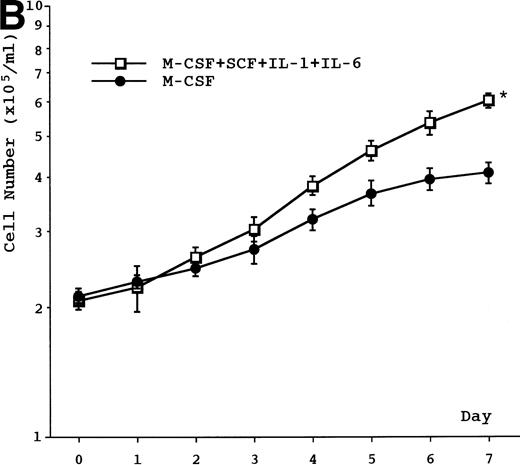
Proliferative activity was observed in the presence of IL-3, GM-CSF, G-CSF, or M-CSF, but not in the presence of IL-1β, IL-2, IL-5, IL-6, IL-7, SCF, or flt3 ligand or in the absence of any cytokine (data not shown). The proliferative response induced by IL-3, GM-CSF, G-CSF, or M-CSF was dose-dependent and reached plateau at 3 ng/mL in IL-3–, 0.5 ng/mL in GM-CSF–, 10 ng/mL in G-CSF–, and 125 ng/mL in M-CSF–supplemented cultures (data not shown). Based on our data, including unpublished results, we decided on a concentration for IL-3, GM-CSF, M-CSF, and G-CSF in all experiments of 5 ng/mL, 1 ng/mL, 100 ng/mL, and 10 ng/mL, respectively. Growth curves showed a doubling time of about 60 to 70 hours in cell cultures supplemented with IL-3 or GM-CSF and about 4 to 5 days in cell cultures supplemented with G-CSF or M-CSF (Fig 2A). The combination of SCF, IL-1, and IL-6 potentiated M-CSF–induced growth of UG3 cells (Fig 2B), but not that of UG3 cells cultured with IL-3, GM-CSF, or G-CSF (data not shown). The viability of UG3 cells in the presence of IL-3, GM-CSF, G-CSF, or M-CSF was more than 95%. The viability of UG3 in the absence of any cytokine decreased daily and was less than 20% at day 7 in culture.
(A) Growth curve of UG3 cells cultured in the presence or absence of IL-3 (5 ng/mL), GM-CSF (1 ng/mL), G-CSF (10 ng/mL), or M-CSF (100 ng/mL). Cells were enumerated with a hematocytometer after trypan blue dye exclusion. Error bars indicate standard deviation of cell numbers. (B) Growth of UG3 cells cultured in the presence of M-CSF (100 ng/mL) with or without a combination of SCF (100 ng/mL), IL-1 (20 ng/mL), and IL-6 (10 ng/mL). Cells were enumerated with a hematocytometer after trypan blue dye exclusion. Error bars indicate standard deviation of cell numbers. *P < .01 compared with M-CSF. Results are representative of three independent experiments.
(A) Growth curve of UG3 cells cultured in the presence or absence of IL-3 (5 ng/mL), GM-CSF (1 ng/mL), G-CSF (10 ng/mL), or M-CSF (100 ng/mL). Cells were enumerated with a hematocytometer after trypan blue dye exclusion. Error bars indicate standard deviation of cell numbers. (B) Growth of UG3 cells cultured in the presence of M-CSF (100 ng/mL) with or without a combination of SCF (100 ng/mL), IL-1 (20 ng/mL), and IL-6 (10 ng/mL). Cells were enumerated with a hematocytometer after trypan blue dye exclusion. Error bars indicate standard deviation of cell numbers. *P < .01 compared with M-CSF. Results are representative of three independent experiments.
UG3 cells synthesize transcripts for IL-1R, IL-3R, IL-6R, IL-6R gp130, IL-7R, c-kit, flt3, GM-CSFR, G-CSFR, and c-fms. No transcripts of EPO-R or c-mpl were detected in UG3 cells (data not shown).
Karyotype and analysis for t(9;11) fusion transcripts.
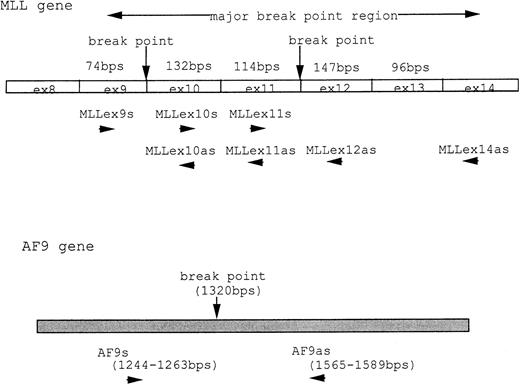
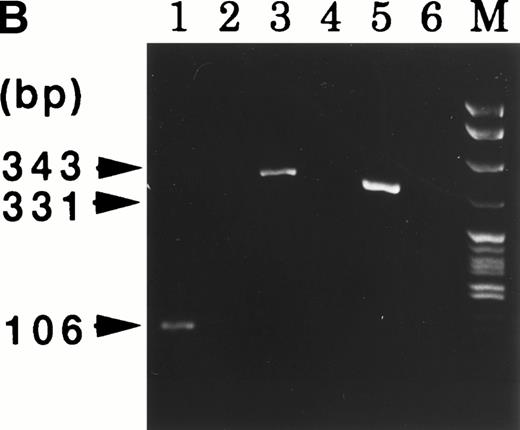
At 9 weeks of culture after cloning of UG3 cells from semisolid culture, cytogenetic analysis of UG3 cells showed the consensus karyotype of 46XX, −7, +8, t(9;11)(p22;q23) (Fig 3). To detect transcripts of MLL-AF9 and AF9-MLL fusion genes resulting from t(9;11)(p22;q23), we performed RT-PCR using various primers (Table 1 and Fig 4A) and sequenced the amplified fragments. Amplified fragments were detected with the following primer-pairs: AF9s-MLLex12as, AF9s-MLLex14as, and MLLex9s-AF9as (Fig4B). Sequencing showed that the AF9 gene was deleted at nucleotide 1320 and fused to exon 12 of the MLL gene in the AF9-MLL fusion transcript and that the 3′ end of exon 9 of the MLL gene was fused to nucleotide 1321 of the AF9 gene in the MLL-AF9 fusion transcript.
Karyotype of UG3 cells. The consensus karyotype of UG3 cells was 46XX, −7, +8, t(9;11)(p22;q23). Chromosome analysis was performed twice.
Karyotype of UG3 cells. The consensus karyotype of UG3 cells was 46XX, −7, +8, t(9;11)(p22;q23). Chromosome analysis was performed twice.
(A) MLL and AF9 break points in UG3 cells. Break points in UG3 cells as determined by sequencing the RT-PCR products are shown with vertical black arrow heads. Primers are shown as horizontal arrow heads; ex, exon; bps, base pairs. (B) RT-PCR analysis for AF9-MLL and MLL-AF9 fusion transcripts in UG3 cells. RT-PCR analysis was performed as detailed in the Materials and Methods. Amplification reactions performed with all primer combinations failed to produce any PCR product, with the exception of the following primer pairs: AF9s-MLLex12as (lane 1), AF9s-MLLex14as (lane 3), and MLLex9s-AF9as (lane 5). As a control, RT-PCR analysis was also performed with reversely transcribed RNA obtained from K562 cells using these primer pairs, and reaction products were loaded into lanes 2, 4, and 6, respectively. Lane M depicts pBR322 DNA digested with Msp I as a molecular weight marker. Shown is one representative result of four independent experiments.
(A) MLL and AF9 break points in UG3 cells. Break points in UG3 cells as determined by sequencing the RT-PCR products are shown with vertical black arrow heads. Primers are shown as horizontal arrow heads; ex, exon; bps, base pairs. (B) RT-PCR analysis for AF9-MLL and MLL-AF9 fusion transcripts in UG3 cells. RT-PCR analysis was performed as detailed in the Materials and Methods. Amplification reactions performed with all primer combinations failed to produce any PCR product, with the exception of the following primer pairs: AF9s-MLLex12as (lane 1), AF9s-MLLex14as (lane 3), and MLLex9s-AF9as (lane 5). As a control, RT-PCR analysis was also performed with reversely transcribed RNA obtained from K562 cells using these primer pairs, and reaction products were loaded into lanes 2, 4, and 6, respectively. Lane M depicts pBR322 DNA digested with Msp I as a molecular weight marker. Shown is one representative result of four independent experiments.
Morphological analysis.
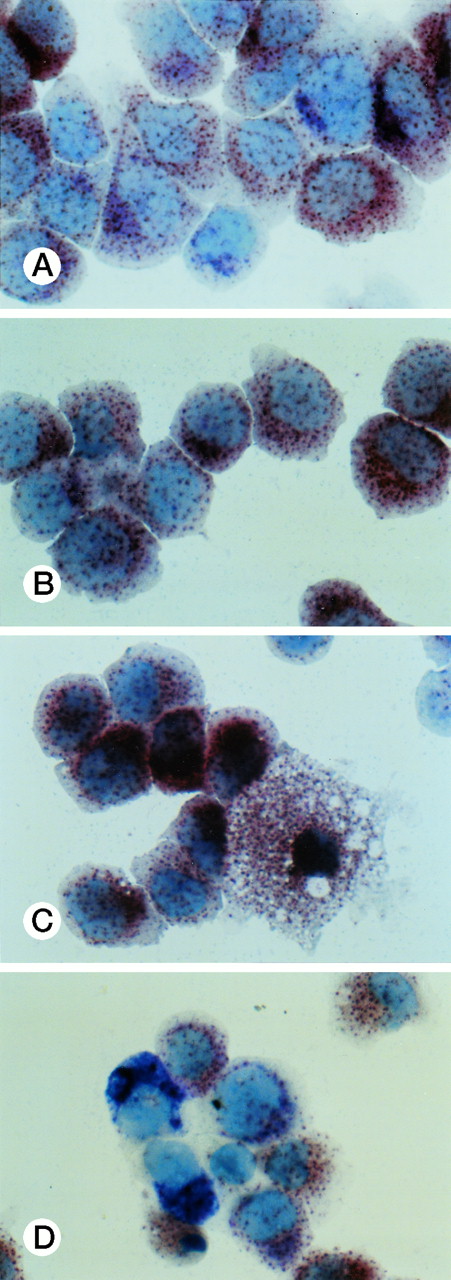
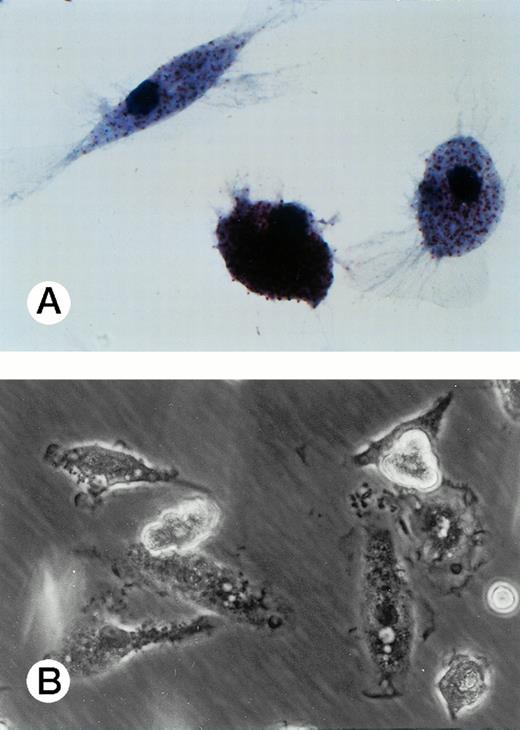
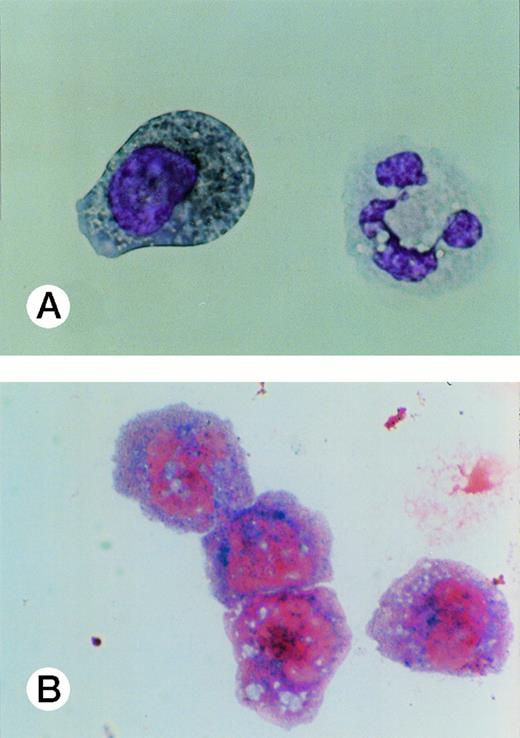
Specific staining showed that UG3 cells cultured with IL-3 were 98% positive for αNB esterase, 13% double-positive for αNB and NAC esterase (Fig 5A), and negative for peroxidase and NAP (data not shown). UG3 cells cultured with GM-CSF showed increased αNB activity and decreased NAC activity (Fig 5B) as compared with UG3 cells maintained in the presence of IL-3. A few of the cells cultured in the presence of GM-CSF were of macrophage-like appearance, having wide and irregular cytoplasm, and grew adherently. In contrast, about 45% of UG3 that were cultured in the presence of M-CSF grew adherently. Nonadherent cells obtained from M-CSF–supplemented culture showed the same morphological characteristics as UG3 cells that had been maintained in the presence of IL-3, but stained 100% positive for αNB and negative for NAC esterase (Fig 5C). Adherent cells obtained from cultures maintained in the presence of M-CSF showed macrophage-like morphology with widely spread cytoplasm containing vacuoles (Fig6A) and also displayed strong positivity for αNB esterase (Fig 6B). In contrast, UG3 cells cultured in the presence of G-CSF featured a slightly irregular cytoplasm, contained granules, and showed increase of NAC esterase positivity (Fig 5D). These cells were 4% positive for peroxidase (Fig 7A) and 6% for NAP (Fig7B). Some UG3 cells maintained in the presence of G-CSF had a segmented nucleus (Fig 7A).
Double staining for α-naphthyl butyrate esterase and naphthol AS-D chloracetate esterase of UG3 cells cultured with IL-3 (5 ng/mL; A), GM-CSF (1 ng/mL; B), M-CSF (100 ng/mL; C), and G-CSF (10 ng/mL; D) for 2 weeks. Original magnification, 200-fold. Histochemical analyses were performed using samples taken from four independent cell cultures.
Double staining for α-naphthyl butyrate esterase and naphthol AS-D chloracetate esterase of UG3 cells cultured with IL-3 (5 ng/mL; A), GM-CSF (1 ng/mL; B), M-CSF (100 ng/mL; C), and G-CSF (10 ng/mL; D) for 2 weeks. Original magnification, 200-fold. Histochemical analyses were performed using samples taken from four independent cell cultures.
Adherent UG3 cells cultured in the presence of M-CSF (100 ng/mL) for 2 weeks. Double staining for a-naphthyl butyrate esterase and naphthol AS-D chloracetate esterase (A; original magnification, 100-fold) and phase-contrast microscopy (B; original magnification, 60-fold). Morphological analysis was performed of cells obtained from two independent cultures.
Adherent UG3 cells cultured in the presence of M-CSF (100 ng/mL) for 2 weeks. Double staining for a-naphthyl butyrate esterase and naphthol AS-D chloracetate esterase (A; original magnification, 100-fold) and phase-contrast microscopy (B; original magnification, 60-fold). Morphological analysis was performed of cells obtained from two independent cultures.
Peroxidase (A) and neutrophilic alkaline phosphatase (B) staining of UG3 cells cultured in the presence of G-CSF (10 ng/mL) for 2 weeks. Original magnification, 300-fold. Histochemical analysis was performed with samples obtained from three independent cultures.
Peroxidase (A) and neutrophilic alkaline phosphatase (B) staining of UG3 cells cultured in the presence of G-CSF (10 ng/mL) for 2 weeks. Original magnification, 300-fold. Histochemical analysis was performed with samples obtained from three independent cultures.
Immunophenotyping.
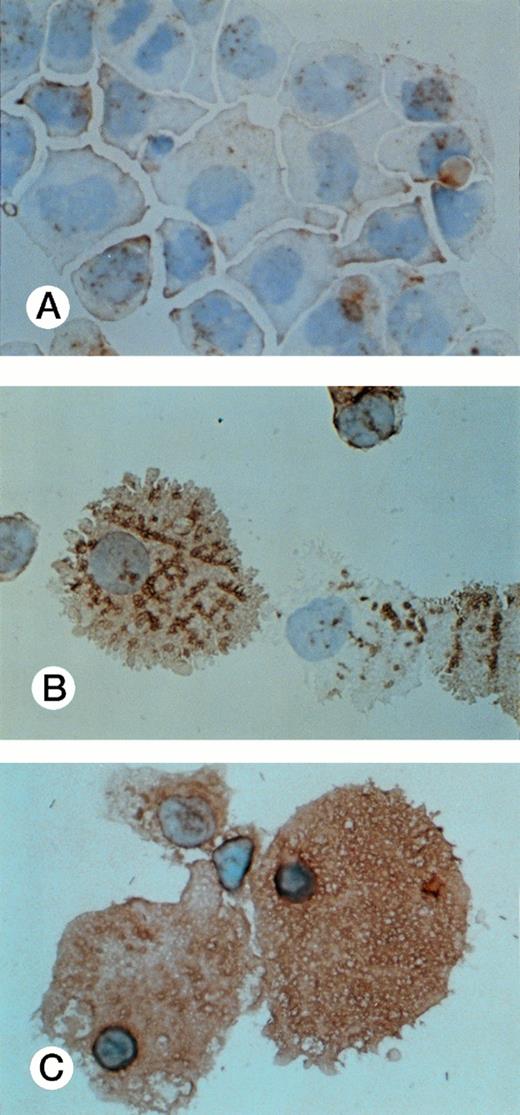
Results obtained from all surface marker expression as analyzed by fluorocytometry are summarized in Table 2. Positivity for CD13 was highest when UG3 cells had been cultured with G-CSF and lowest when UG3 cells had been exposed to IL-3. CD14 expression was relatively low but increased when UG3 cells were cultured with M-CSF or G-CSF. A majority of UG3 cells expressed CD54 when cultured with IL-3, GM-CSF, or M-CSF, but CD54 expression was low on UG3 cells cultured in the presence of G-CSF. UG3 cells failed to display CD68 surface expression when maintained in the presence of IL-3, whereas CD68 was detectable on UG3 cells exposed to GM-CSF and became strongly positive on UG3 cells that had been exposed to M-CSF (Table 2 and Fig 8). In addition, nonadherent large-sized cells obtained from cultures supplemented with M-CSF were 98.6% positive for CD14 and negative for CD71 (Table 2, percentages in parentheses).
CD68 expression was determined by immunohistochemistry of UG3 cells cultured with IL-3 (5 ng/mL; A), GM-CSF (1 ng/mL; B), or M-CSF (100 ng/mL; C) for 2 weeks. Original magnification, 200-fold. Histochemical analysis was performed with samples taken from three independent cultures.
CD68 expression was determined by immunohistochemistry of UG3 cells cultured with IL-3 (5 ng/mL; A), GM-CSF (1 ng/mL; B), or M-CSF (100 ng/mL; C) for 2 weeks. Original magnification, 200-fold. Histochemical analysis was performed with samples taken from three independent cultures.
Uptake of acetylated LDL.
To detect scavenger receptor-mediated incorporation of Ac-LDL in UG3 cells, we analyzed incorporation of Ac-LDL using DiI-Ac-LDL. UG3 cells incorporated Ac-LDL when cultured in the presence of IL-3. However, even more Ac-LDL was incorporated in UG3 cells obtained from cultures supplemented with either GM-CSF or M-CSF. UG3 cells that had been exposed to M-CSF incorporated the highest amount of Ac-LDL and some of these cells resembled foam cells. The percentages of UG3 cells that incorporated Ac-LDL in all cells are summarized in Table3.
Cytokine production by UG3 cells.
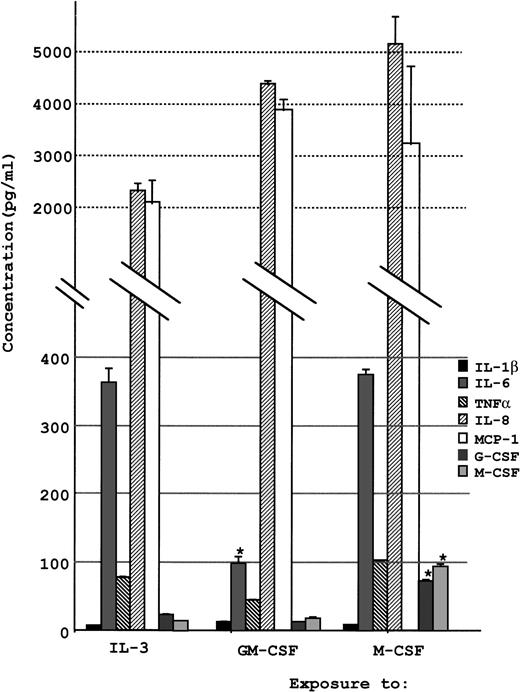
The concentrations of various cytokines secreted into the cell culture supernatant were analyzed by ELISA as described in the Materials and Methods. A notable amount of IL-8 and MCP-1 was secreted into the supernatant when UG3 cells were cultured in the presence of either IL-3, GM-CSF, or M-CSF (Fig 9). UG3 cells exposed to these cytokines also released IL-6, although the production was three times higher when cultured in the presence of IL-3 or M-CSF as compared with GM-CSF (P < .01). Production of M-CSF and G-CSF was below the minimum detectable concentration when UG3 cells were exposed to GM-CSF or IL-3, but UG3 cells cultured with M-CSF produced a significant amount of M-CSF and G-CSF (P < .01). Production of GM-CSF was below the detectable limit when UG3 cells were cultured in the presence of either IL-3, GM-CSF, or M-CSF (data not shown).
Concentration of various cytokines released into culture supernatant by UG3 cells cultured for 2 weeks in the presence of IL-3 (5 ng/mL), GM-CSF (1 ng/mL), or M-CSF (100 ng/mL). Error bars indicate the standard deviation of cytokine concentration. *P < .01. Results are representative of three independent experiments.
Concentration of various cytokines released into culture supernatant by UG3 cells cultured for 2 weeks in the presence of IL-3 (5 ng/mL), GM-CSF (1 ng/mL), or M-CSF (100 ng/mL). Error bars indicate the standard deviation of cytokine concentration. *P < .01. Results are representative of three independent experiments.
Clonogenic assay.
Clonogenic assay showed that, in the absence of cytokines, UG3 cells did not form colonies (data not shown). When UG3 cells were maintained in the presence of IL-3 for 2 weeks and then transferred to the semisolid media, IL-3, GM-CSF, M-CSF, or G-CSF stimulated formation of 33.51.5, 39.01.0, 14.01.0, or 13.01.0 colonies/1,000 cells, respectively. The ratio of spread to compact colonies was 3:7, 3;7, 4:6, and 6:4 when UG3 cells maintained in IL-3- were subsequently transferred to semisolid media containing IL-3, GM-CSF, G-CSF, or M-CSF, respectively. IL-3– or GM-CSF–stimulated colonies tended to be larger in size than M-CSF– or G-CSF–stimulated colonies. Individual cells comprising colonies stimulated by each cytokine were similar in morphology to those cultured with the respective cytokine in liquid media, although the cells comprising spreaded colonies tended to have higher positivity for αNB than those obtained from compact colonies (data not shown). Preculture of UG3 cells in liquid culture supplemented with IL-3 or GM-CSF for a period of 2 weeks did not alter the number of cells capable of forming colonies in semisolid media supplemented with IL-3, GM-CSF, M-CSF, or G-CSF as compared with UG3 cells that had not been precultured (Table 4). In contrast, preculture of UG3 cells for 2 weeks in the presence of M-CSF reduced the capacity of UG3 cells to form colonies in semisolid media supplemented with IL-3 or G-CSF. Under these conditions, colony forming capacity of UG3 cells was preserved in semisolid media supplemented with M-CSF or GM-CSF (Table 4). Only UG3 cells responding to GM-CSF could preserve their colony-forming potential after 2 weeks of liquid culture in the presence of G-CSF (Table 4).
Differentiation into osteoclast-like cells.
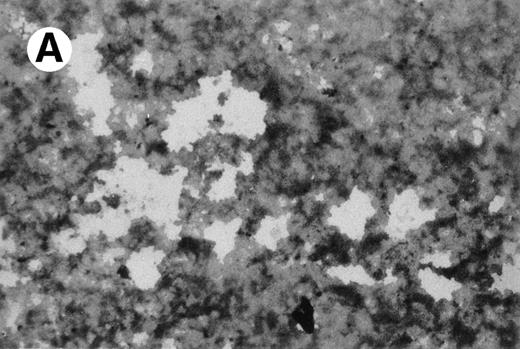
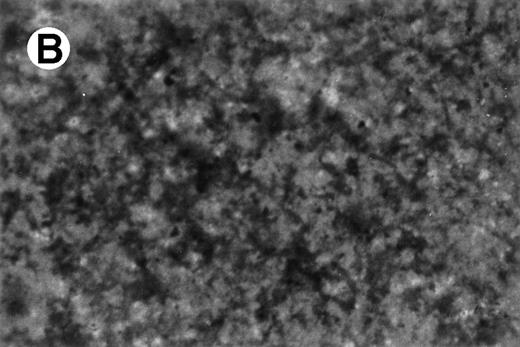
UG3 cells preincubated with 100 ng/mL M-CSF for 2 weeks formed multinucleated giant cells displaying TRAP activity when cultured for an additional 2 weeks in the presence of both 100 ng/mL M-CSF and 100 U/mL IL-4 (Fig10). UG3 cells did not form multinucleated giant cells when cultured with M-CSF alone for the whole observation period of 4 weeks (not shown). UG3 cells cultured in osteologic slide flasks in IMDM with 5% FCS supplemented with M-CSF and IL-4 resorbed larger amounts of hydroxyapatite (Fig 11A) than those cultured with IL-3 and IL-4 (Fig 11B).
Multinucleated giant cells formed after culture of UG3 cells for 2 weeks in the presence of M-CSF (100 ng/mL) and IL-4 (100 U/mL) stained for TRAP. Original magnification, 75-fold. Histochemical analysis was performed on cells obtained from three independent cultures.
Multinucleated giant cells formed after culture of UG3 cells for 2 weeks in the presence of M-CSF (100 ng/mL) and IL-4 (100 U/mL) stained for TRAP. Original magnification, 75-fold. Histochemical analysis was performed on cells obtained from three independent cultures.
Resorption of hydroxyapatite by osteoclast-like giant cells exposed to M-CSF and IL-4. Hydroxyapatite was stained black by Von Kossa staining. UG3 cells that had been cultured in the presence of M-CSF (100 ng/mL) and IL-4 (100 U/mL) had pericellular clear areas (A) resulting from hydroxyapatite resorption, whereas those that had been cultured in the presence of IL-3 (5 ng/mL) and IL-4 (100 U/mL) did not (B). Original magnification, 30-fold. Histochemical analysis was performed with cells obtained from three independent cultures.
Resorption of hydroxyapatite by osteoclast-like giant cells exposed to M-CSF and IL-4. Hydroxyapatite was stained black by Von Kossa staining. UG3 cells that had been cultured in the presence of M-CSF (100 ng/mL) and IL-4 (100 U/mL) had pericellular clear areas (A) resulting from hydroxyapatite resorption, whereas those that had been cultured in the presence of IL-3 (5 ng/mL) and IL-4 (100 U/mL) did not (B). Original magnification, 30-fold. Histochemical analysis was performed with cells obtained from three independent cultures.
DISCUSSION
UG3 is a novel human leukemic cell line derived from a patient with AML (M5). UG3 cells have several unique characteristics. (1) They rely on the presence of IL-3, GM-CSF, G-CSF, or M-CSF for growth. (2) They resemble immature monocytes/macrophages, but are induced to display features characteristic of granulocytes on exposure to G-CSF. (3) They are induced to differentiate into the monocyte/macrophage lineage on exposure to M-CSF. (4) They are induced to further differentiate into the osteoclast-like cells on exposure to M-CSF and IL-4. (5) They carry the t(9;11)(p22;q23) and express the MLL-AF9 and AF9-MLL fusion transcript.
Translocation of chromosome involving 11q23 is known to be closely associated with leukemogenesis.24-26 Yu et al27reported that MLL heterozygous (+/−) mice display retarded growth, hematopoietic abnormalities, and bidirectional homeotic transformations of the axial skeleton as well as sternal malformations. Corral et al28 found that chimeric mice carrying the MLL-AF9 fusion gene developed tumors, which were restricted to acute myeloid leukemias despite the widespread activity of the MLL promoter. Translocations involving 11q23 occur frequently in patients with secondary leukemia subsequent to chemotherapy, including topoisomerase II antagonist against primary malignancy.29 Both the MLL and the AF9 gene bear putative topoisomerase II binding sites.30 The mechanism of leukemogenesis underlying MLL gene abnormality has yet to be elucidated. UG3 cells may prove useful to dissect further how MLL gene abnormality may be operational in leukemogenesis.
UG3 cells transcribe an AF9-MLL fusion transcript in which the AF9 RNA is fused at nucleotide 1320 to exon 12 of the MLL transcript. The MLL-AF9 fusion transcript in UG3 cells fused exon 9 of MLL to nucleotide 1321 of AF9. Because no PCR analysis of the genomic DNA of UG3 cells has been performed, it is unclear at present whether exon 10 and 11 of the MLL gene have been spliced out during transcriptation of the AF9-MLL and MLL-AF9 fusion genes, respectively, or whether exon 10 and 11 were deleted as a result of the translocation. DNA sequencing of the genomic breakpoints of the AF9-MLL and MLL-AF9 fusion genes should also help to determine whether putative topoisomerase II binding sites, which have previously been identified in the MLL breakpoint cluster region, are also present in the breakpoint area of UG3 cells.30 31
UG3 cells grew faster when exposed to IL-3 or GM-CSF than when stimulated with G-CSF or M-CSF. UG3 cells preserve similar viability when cultured in the presence of IL-3, GM-CSF, G-CSF, or M-CSF, respectively. However, both number and size of IL-3– or GM-CSF–stimulated colonies was increased as compared with G-CSF– or M-CSF–stimulated colonies. These findings suggest that the prolonged doubling time of UG3 cells maintained in the presence of G-CSF or M-CSF was due to a slower progression of cells through the cell cycle rather than accelerated cell death in a fraction of UG3 cells. The number of colony forming cells responding to IL-3 or G-CSF decreased after 2 weeks of liquid culture period in the presence of M-CSF. Likewise, the number of colony-forming UG3 cells responding to IL-3, G-CSF, or M-CSF also decreased after 2 weeks of liquid culture in the presence of G-CSF. These findings suggest that irreversible commitment was induced in some UG3 cells during the 2 weeks of exposure to M-CSF or G-CSF. IL-3– or GM-CSF–stimulated colonies obtained after previous liquid culture in the presence of M-CSF or G-CSF were similar in morphology to those obtained after liquid culture supplemented with IL-3 or GM-CSF. This may suggest that a fraction of UG3 cells remains undifferentiated or, alternatively, that a fraction of UG3 cells differentiated reversibly while exposed to G-CSF or M-CSF for 2 weeks.
Of interest is the ability of UG3 cells to differentiate in the presence of physiological cytokines not requiring the presence of chemical compounds such as PMA. UG3 cells exposed to G-CSF displayed specific markers of granulocytic in addition to monocytic differentiation, which included strong positivity for NAC esterase. Furthermore, UG3 cells cultured in the presence of G-CSF were 4% positive for peroxidase (Fig 7A) and 6% positive for NAP (Fig 7B). CD14 is usually considered a monocyte/macrophage marker. However, expression of CD14 is also enhanced in response to G-CSF in neutrophils.32 Strong positivity for CD14 observed in UG3 cells after exposure to G-CSF might reflect differentiation and activation of UG3 cells in response to G-CSF. UG3 cells may thus represent a valuable tool to further investigate both the mechanism and the regulation of granulocytic differentiation, even though UG3 cells are established from leukemic cells.
A few murine cell lines that can be induced to differentiate along the monocyte/macrophage lineage in response to physiological substances have been established. NFS-60 cells, for example, differentiate into neutrophils and macrophages in the presence of IL-3 and GM-CSF.33 Nakoinz et al34 described two sublines of NFS-60, one of which grows slowly in the presence of M-CSF and shows properties of differentiated macrophages. The other subline grows rapidly as round nonadherent cells in response to M-CSF but does not respond to GM-CSF.34 GM-CSF– and IL-3–responsive FDC-P1 cells become M-CSF–responsive after transfection of c-fms expression vector. Some c-fms–expressing FDC-P1 cells are induced to myeloid differentiation by M-CSF, but the other undifferentiated c-fms–expressing FDC-P1 cells retain responsiveness to IL-3.35 UG3 cells cultured in the presence of GM-CSF or M-CSF displayed the following features characteristic for monocytes/macrophages: (1) strong positivity for αNB esterase, (2) expression of CD68, (3) production of various cytokines, and (4) uptake of Ac-LDL. Furthermore, UG3 cells cultured in the presence of M-CSF also exhibited characteristics of differentiated macrophages such as spread morphology, even greater production of cytokines, and increased expression of CD14 and CD68 as compared with UG3 cells cultured in the presence of IL-3 or GM-CSF. A subpopulation of UG3 cells cultured in the presence of M-CSF became relatively large in size and showed almost 100% positivity for CD14 and negativity for CD71, a specific marker of macrophages induced to differentiate by GM-CSF.17 To our knowledge, UG3 cells might be the first human cell line inducible to differentiate along the monocyte/macrophage lineage in response to physiological stimuli alone. UG3 cells thus may represent a suitable model to further elucidate the different characteristics of M-CSF– and GM-CSF–induced macrophages under limited conditions.
Furthermore, UG3 cells differentiated into functional osteoclast-like cells, capable of bone resorption, in the presence of both M-CSF and IL-4 similarly. HL60 cells differentiate into osteoclast-like cells in response to vitamin D3.10 Recent studies suggest that peripheral blood monocytes mature into osteoclast-like cells in the presence of M-CSF and IL-4.18 Various other factors, such as IL-1, IL-6, IL-11, or leukemia inhibitory factor (LIF), either stimulated or inhibited osteoclast formation of bone marrow mononuclear cells.36 GM-CSF inhibited M-CSF and IL-4–induced differentiation into osteoclasts,18 but was also reported to support M-CSF– and IL-4–induced osteoclast-like cell formation from monocytes in another study.37 Such conflicting findings may be explained by the use of different cell sources or factors or by a divergent definition of osteoclasts. Because more UG3 cells were induced to osteoclast-like cells in response to M-CSF and IL-4 after 2 weeks of preincubation with M-CSF than without that preincubation (data not shown), UG3 cells might differentiate into osteoclast-like cells through mature monocytes/macrophages. UG3 cells could be useful in elucidating the mechanisms regulating not only differentiation of monocytes into osteoclasts, but also to further dissect the function of osteoclasts under limited conditions.
In summary, UG3 is a human monoblastic cell line that requires exogenous growth factors, including IL-3, GM-CSF, G-CSF, or M-CSF, for growth. Optimum proliferative response is achieved by exposure of UG3 cells to IL-3 or GM-CSF. IL-3– or GM-CSF–stimulated UG3 cells developed a more differentiated phenotype than has previously been reported for other myelomonocytic cell lines, including FDC-P135 and NFS-60.34 UG3 cells were induced to display characteristics of mature granulocytes and monocytes/macrophages after exposure to G-CSF or M-CSF, respectively, and further differentiated into functional osteoclast-like cells in the presence of M-CSF and IL-4.
Address reprint requests to Takashi Ikeda, MD, First Department of Internal Medicine, Kagawa Medical University, 1750-1 Ikenobe, Miki-cho, Kita-gun, Kagawa 761-07, Japan; e-mail: takikeda@mailbox.kms.ac.jp.
The publication costs of this article were defrayed in part by page charge payment. This article must therefore be hereby marked "advertisement" is accordance with 18 U.S.C. section 1734 solely to indicate this fact.

