Abstract
Serum from 398 myeloma patients at diagnosis and serial samples from 29 patients were analysed for hepatocyte growth factor (HGF). HGF was elevated at diagnosis in 43% of myeloma patients compared with healthy controls (median 1.00 ng/mL and 0.44 ng/mL, respectively;P < .00001). In the group with elevated HGF levels 46% of the patients reached plateau phase, as compared with 60% of the patients with low HGF levels (P = .005), and the median survival time was 21 and 32 months, respectively (P = .002). In a univariate Cox regression analysis, HGF was a significant predictor of mortality (P = .02). In the subgroup of patients with β2-microglobulin levels less than or equal to 6 mg/L, high versus low HGF was a prognostic factor when a multivariate Cox regression analysis was performed. In serial samples HGF was higher at the time of diagnosis and relapse (median 0.57 ng/mL and 0.52 ng/mL, respectively; P = .0018) than at response (median 0.24 ng/mL, P = .008). We conclude that HGF may be a useful follow-up parameter in myeloma patients. Measurement of HGF may identify a group of patients with poor response to melphalan-prednisone treatment and short survival. HGF was a prognostic factor in patients with high levels of β2-microglobulin.
MULTIPLE MYELOMA is a disorder of unknown origin of clonal malignant plasma cells. It is associated with production of monoclonal immunoglobulins, painful bone destruction, anemia, hypercalcemia, and renal dysfunction. The cause of these features is only partly understood, but production of soluble factors by the myeloma cells is likely to be involved. Hepatocyte growth factor (HGF) was originally purified by its ability to cause growth stimulation of hepatocytes1 but is now known as a mitogenic, motogenic, and morphogenic factor with potential involvement in diverse biological processes.2 In vitro HGF has the ability to cause destruction of tight junctions, thereby inducing spread of confluent cells. This property led to the designation “scatter factor”,3 a name that is still used synonymously with HGF. The receptor for HGF is a transmembrane tyrosine kinase that is encoded by the proto-oncogene c-met.4 In normal tissue c-met is expressed primarily in epithelial cells, but it has also been detected on a small fraction of cells in the bone marrow,5,6 half of which were identified as hematopoietic precursor cells because of their expression of CD34.5
Because of HGF's ability to cause blood vessel formation7and to promote cell proliferation, invasion, and motility,3it is proposed to be involved in the process of cancer growth and metastasis. In breast cancer patients HGF levels were increased in 36% of the patients, and in sequential measurements an increase in serum HGF was associated with the appearance of relapse.8 An interesting finding in the context of myeloma is that HGF promotes formation of osteoclasts from hematopoietic precursor cells,9 attracts osteoclasts to sites of bone resorption,10 and in coculture with osteoblasts increases the level of resorption.9,10 The HGF receptor c-met is expressed by both the bone forming osteoblasts and the bone resorbing osteoclasts, and HGF stimulates the growth of both these cell types in vitro.11
We recently reported that HGF and c-met are simultaneously expressed in both myeloma cell lines and freshly isolated myeloma cells.12,13 Furthermore, HGF was detected in 17 of 20 different supernatants from highly purified myeloma cell cultures.13 In a preliminary study we found that sera drawn at diagnosis from 13 myeloma patients had significantly elevated levels of HGF as compared with age- and sex-matched normal controls.13 The purpose of this study was to define the levels of HGF in a large well-characterized population of myeloma patients and to examine the HGF levels during the course of the disease. Moreover, we wished to examine the relation between HGF and known parameters of prognosis, tumor load, and bone destruction.
PATIENTS AND METHODS
Patients.
A total of 592 patients were entered in the Nordic Myeloma Study Group (NMSG) randomized trial in the period from June 1990 until November 1992. In this study, patients were randomized to receive melphalan and prednisone with or without addition of low-dose interferon-α. The diagnostic and eligibility criteria and results were as described elsewhere.14 Our study population consisted of the 398 patients from whom serum samples drawn at diagnosis were available.
The median age of the patients in the study population was 66.5 ± 9.1 years (mean ± SD, range 32 to 87). There were 241 men and 157 women. The distribution of characteristics was typical with respect to class of monoclonal component (M-protein): IgG in 58%, IgA in 21%, IgD in 0.8%, and light chain disease in 20%. According to the staging of Durie and Salmon,15 8.5% of patients were in stage I, 33.2% in stage II, and 58.3% in stage III disease.
Registered parameters at diagnosis were age, sex, World Health Organization (WHO) performance status, bone morbidity as judged by radiograph, urine immunoglobulin, percentage of plasma cells in the bone marrow, hemoglobin, and serum (s–) M-protein concentration, albumin, calcium, creatinine, alanine transaminase (ALAT), total alkaline phosphatase, and β2-microglobulin. After completion of the study, more than 400 sera drawn at diagnosis were analyzed for interleukin-6 (IL-6), IL-6 receptor, C-reactive protein (CRP), osteocalcin, and C-terminal telopeptide of type I collagen (ICTP). In addition, C-terminal propeptide of procollagen type I (PICP) and N-terminal propeptide of procollagen type III (PIIINP) were analyzed in 109 sera.
In the NMSG study the date of response was recorded, and in a few patients serum samples were collected and frozen at this point. Criteria for response included clear clinical improvement and absence of hypercalcemia and anemia, no progress of osteolytic lesions, or rising s-creatinine. The response was defined as minor when the s–M-protein had decreased by more than 25% but less than 50%, or the M-protein in urine had decreased by greater than 50% but not to less than 0.2 g in 24 hours. Partial response was defined as a decrease of s–M-protein of greater than 50% of the initial concentration and of M-protein in urine to less than 0.2 g in 24 hours. Complete response was defined as an undetectable s–M-protein and a percentage of plasma cells in a marrow aspirate less than 5%. The date of plateau phase, defined as the time point when the M-protein had varied with less than 10% from the mean in three consecutive measurements in a responding patient, was recorded.
At the Section of Hematology, University Hospital of Trondheim, sera from multiple myeloma patients have been collected since 1991. By the same criteria for diagnosis and response as above, 13 additional patients were included for analysis of HGF at diagnosis and response.
Serum samples.
All serum samples from the time of diagnosis were taken before the initiation of treatment. For the analysis of changes in HGF levels from diagnosis to response, serum samples from 29 patients (13 with complete response and 9 with partial 6 minor response) were included. Sixteen of these patients belonged to the NMSG study group, and 13 of them were additional patients from the Section of Hematology, University of Trondheim. In 9 of the 13 patients in the latter group, serum drawn at the time of relapse was also available. In these patients, relapse was defined as the time from which treatment was reindicated. Three patients, from whom serum had been drawn at regular intervals (≥1 sample/6 months) over a period of at least 18 months, were included for a detailed analysis of change in HGF levels over time. s–M-protein and treatment periods were recorded from their medical records. Control samples were obtained from 61 healthy age- and sex-matched individuals. All samples were stored at −70°C.
HGF enzyme-linked immunosorbent assay (ELISA).
A sandwich HGF ELISA was developed in our laboratory. Two mouse monoclonal antibodies (MoAbs) were established and used as catching antibodies. A polyclonal antibody against HGF was prepared from a rabbit immunized with a mixture of complete Freund's adjuvant and HGF, boosted at 2-week intervals before blood was collected. Microtiter 96-well plates were coated with the two anti-HGF MoAbs, each at a concentration of 10 μg/mL. After blocking with 0.5% bovine serum albumin (BSA) in phosphate-buffered saline (PBS) for 1 hour at 37°C, plates were washed with 0.1% BSA + 0.05% Tween 20 in PBS, and 50 μL of standard HGF or serum samples were dispensed into the wells. The plate was sealed and incubated for 2 hours and then washed three times. After the addition of 50 μL of the anti-HGF polyclonal antibody diluted to 1:800, the plate was sealed and incubated for 1 hour. It was then washed three times with the same buffer as above. Next, 50 μL peroxidase-labeled goat anti-rabbit IgG (Zymed, South San Francisco, CA) diluted 1:3,000 was added for 30 minutes, and after 3 washes ortho-phenylene diamine was added. The reaction was stopped after 10 minutes by the addition of 50 μL 1 mol/L H2SO4. Absorbance was read at 490 nm. The sensitivity of this assay was 0.15 ng/mL HGF. The interassay coefficient of variation was less than 10% of the mean. The assay was not affected by the presence of 10% human or mouse serum, nor by the presence of plasminogen, which has a 38% similarity to HGF. Up to five freeze-thaw cycles of serum samples did not affect the level of detected HGF.
ICTP and PICP were analyzed by radioimmunoassays from Farmos Diagnostica (Oulunsab, Finland) as described earlier.16 Serum osteocalcin was analyzed by immunoradiometric assay from Diagnostica Systems Laboratories (Webster, TX). IL-6 was analyzed by ELISA from Biosource Europe S.A (Fleurs, Belgium).
Statistical analyses.
All statistical analyses were done with the SPSSX/PC computer program (SPSS Inc., Chicago, IL). Results were considered statistically significant when P values were less than .05. Skewed variables were logarithmically transformed before entering a parametric analysis. Comparisons between groups were performed by the Mann-Whitney U test or Chi-square test when appropriate. For comparison of HGF levels at diagnosis, response and relapse Wilcoxon matched-Pairs Signed-Ranks test was used. Correlation between two parameters was estimated by the Spearman rank correlation analysis. For investigation of linear correlations multiple regression analysis was used. Response to treatment was analyzed with the chi-square test and multiple logistic regression techniques. The method of Kaplan and Meyer was used to compute the survival curves and to estimate the median survival17 and the log-rank test for significance.18 Survival was modeled with the Cox regression analysis.19 Patients with missing variables were excluded in the multivariate model. The NMSG study found no significant survival difference or difference in response rate between the two arms of treatment,14 thus it was possible to pool data from the treatment arms in the evaluation of prognostic significance and treatment response for the studied parameters.
RESULTS
Serum analyses.
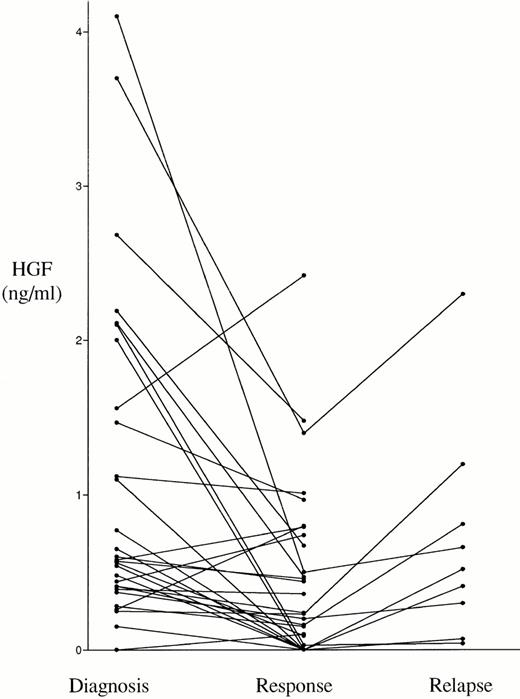
The serum HGF values in patients at the time of diagnosis and in controls are shown in Fig 1. The median HGF concentration in the myeloma and control sera was 1.00 ng/mL (0.68 to 1.47) and 0.44 ng/mL (0.18 to 0.69), respectively (25th to 75th percentile). This difference was statistically significant (P < .0001). In 174 patients, ie, 43% of the patients, the HGF levels were above the mean level +2 SD of HGF in the control group (>1.10 ng/mL), and can thus be considered to be above the normal range according to conventional criteria. As shown in Fig2, in 29 patients responding to treatment, the HGF levels were significantly lower at the time of response than before treatment (median 0.24 ng/mL [0.00 to 0.74] and 0.57 ng/mL [0.37 to 1.47], respectively; P = .0018). Furthermore, in 9 of these responding patients the disease relapsed, which was accompanied by a new rise in the levels of serum HGF (median 0.52 ng/mL at relapse versus median 0.16 ng/mL at response; P = .008).
Serum HGF levels at diagnosis in 398 patients with multiple myeloma (median 1.00 ng/mL) and 61 healthy age- and sex-matched controls (median 0.44 ng/mL), measured by ELISA. The difference between the two groups is highly significant (P < .00001).
Serum HGF levels at diagnosis in 398 patients with multiple myeloma (median 1.00 ng/mL) and 61 healthy age- and sex-matched controls (median 0.44 ng/mL), measured by ELISA. The difference between the two groups is highly significant (P < .00001).
Serum HGF in serial samples from 29 responding patients. The difference between diagnosis (median 0.57 ng/mL) and response (median 0.24 ng/mL) was significant (P = .0018), as was the difference between response and relapse (median 0.52 ng/mL, n = 9,P = .008).
Serum HGF in serial samples from 29 responding patients. The difference between diagnosis (median 0.57 ng/mL) and response (median 0.24 ng/mL) was significant (P = .0018), as was the difference between response and relapse (median 0.52 ng/mL, n = 9,P = .008).
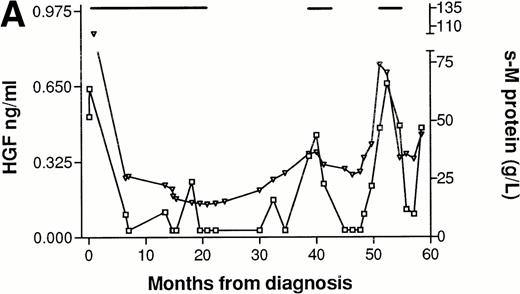
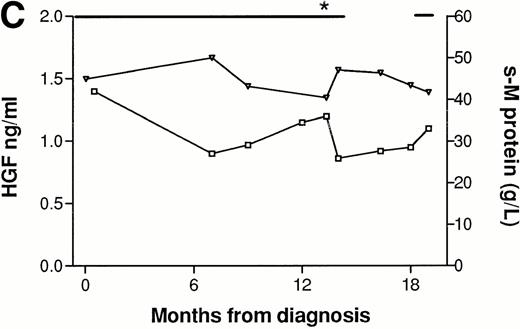
In three patients, consecutive serum samples from the time of diagnosis until the point of death or last follow-up were analyzed. Patient No. 1 (Fig 3A), was followed for 5 years and had normal but detectable levels of HGF at diagnosis. He responded to melphalan/prednisone treatment, with a fall in s–M-protein of more than 50% and a fall in HGF to undetectable levels. Both HGF and s–M-protein levels remained low for over 1 year after termination of treatment. When new treatment was indicated, as judged by s–M-protein levels and clinical status, HGF levels were also rising. The patient received two further courses of melphalan/prednisone with declining s–M-protein as well as HGF levels as a result. However, both s–M-protein and HGF tended to rise at the end of the follow-up period. Patient No. 2 (Fig 3B) had high levels of HGF at diagnosis (>3 ng/mL) and was followed for 2 years. The response to treatment with melphalan/prednisone was minor, with a 30% reduction in s–M-protein. HGF decreased in response to treatment but remained relatively high (>1.10 ng/mL). After termination of treatment there was a rise in HGF and s–M-protein, which subsequently decreased in concert with response to new treatment courses. Patient No. 3 (Fig 3C), followed for 2 years, had elevated HGF levels at diagnosis (1.40 ng/mL), and did not respond to treatment as judged by s–M-protein levels and clinical evaluation. HGF values remained high and increased after an initial reduction during melphalan/prednisone treatment. Thus, HGF values in these three patients tended to fluctuate in concordance with the s–M-protein levels. In one case (Patient No. 1), the fluctuation in HGF levels tended to lag slightly behind the fluctuations in s–M-protein levels.
Concentrations of serum HGF (□) and M-protein (▿) in serial samples from three patients. (—) Indicate treatment periods. (A) Patient responding to treatment. (B) Patient with minor response to treatment. (C) Patient with treatment failure. *Indicates time when new treatment type was initiated.
Concentrations of serum HGF (□) and M-protein (▿) in serial samples from three patients. (—) Indicate treatment periods. (A) Patient responding to treatment. (B) Patient with minor response to treatment. (C) Patient with treatment failure. *Indicates time when new treatment type was initiated.
Correlation to other parameters.
We wished to correlate HGF at diagnosis to other registered parameters, primarily markers of disease severity, tumor load, and bone destruction and formation. As shown in Table 1 the correlation coefficient was small but significant for ICTP, PICP, IL-6, CRP, s-calcium, WHO performance status, β2-microglobulin, and IL-6 receptor. A multiple linear regression was performed by forward selection of the above significantly correlated variables. The analysis yielded lnICTP in a simple linear regression as the best predictor of HGF with an adjusted r-square of 0.071. However, the unexplained variance was 93%. There was no significant correlation between HGF and pretreatment age, stage, s–M-protein concentration, percent plasma cells in the bone marrow, radiographic staging of bone destruction, PIIINP, osteocalcin, leukocyte counts, or ALAT (not shown).
Response to treatment.
The study population was divided into patients with high (≥1.10 ng/mL, n = 174) and low (<1.10 ng/mL, n = 224) HGF concentrations based on the mean value +2 SD of controls. There was no significant difference between the two groups with respect to age, sex, treatment arm, β2-microglobulin, percent plasma cells in the bone marrow, PICP, PIIINP, osteocalcin, CRP, IL-6 receptor, serum creatinine, s–M-protein concentration, or stage (data not shown). The HGF high group had significantly higher levels of ICTP, s-calcium, and IL-6 (see Table 2). As shown in Table3, a significantly higher percentage of the responding patients in the group low-HGF serum concentrations achieved plateau phase after treatment with melphalan/prednisone as compared with the high HGF group (60% and 46%, respectively;P = .005). In the small (n = 25) group of patients with extremely elevated s-HGF values (≥3.00 ng/mL) only 27% reached plateau phase (P = .002). The finding of high or low HGF serum concentrations retained its significance in predicting plateau phase when entered in a multiple logistic regression analysis with other putative prognostic parameters (β2-microglobulin, IL-6, IL-6 receptor, serum calcium, ICTP, age, and stage).
Survival analyses.
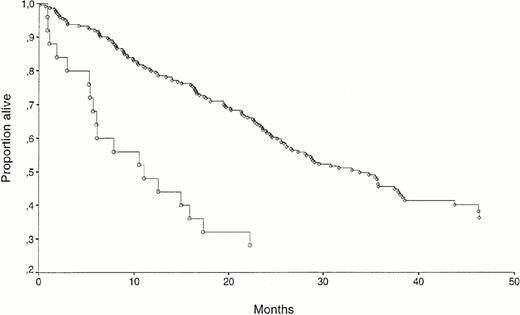
The median follow-up period of surviving patients was 38 months (range 24 to 54). The follow-up period of surviving patients did not differ in the HGF high and low groups. The overall mortality in the study was 58%. When HGF was analyzed as a dichotomous variable with cutoff level at 1.10 ng/mL, there was a significant survival difference between the groups, as shown in Fig 4A, with high or low serum HGF survival times of 32 and 21 months, respectively (P = .02). As shown in figure 4B, this difference was especially marked for the 25 patients with extremely high (≥3 ng/mL) values of HGF, where the median survival was 11 months from diagnosis (P = .001).
(A) Kaplan-Meyer survival curves for 398 myeloma patients separated by HGF high (≥1.10 ng/mL, n = 174; ○) versus low (<1.10 ng/mL, n = 224; ◊). The survival difference was significant (P = .02). (B) Kaplan Meyer survival curves for 25 myeloma patients with extremely high pretreatment values of HGF (≥3.00 ng/mL; ○) and for 224 patients with low pretreatment values (<1.10 ng/mL; ◊). The survival difference was significant (P = .001).
(A) Kaplan-Meyer survival curves for 398 myeloma patients separated by HGF high (≥1.10 ng/mL, n = 174; ○) versus low (<1.10 ng/mL, n = 224; ◊). The survival difference was significant (P = .02). (B) Kaplan Meyer survival curves for 25 myeloma patients with extremely high pretreatment values of HGF (≥3.00 ng/mL; ○) and for 224 patients with low pretreatment values (<1.10 ng/mL; ◊). The survival difference was significant (P = .001).
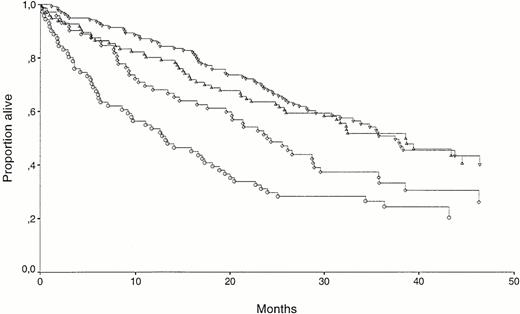
When HGF was logarithmically transformed and entered in a univariate Cox regression analysis, it was a significant predictor of mortality (P = .02). However, in a multivariate Cox regression analysis involving all patients only six factors retained independent prognostic information: s-calcium, s–IL-6 receptor, age, WHO performance status (0 to 2 v 3 to 4), s–IL-6, and s–β2-microglobulin. As shown in Fig 5, the power of high or low HGF concentrations as a variable predicting survival is observed in the group of 143 patients with high (≥6 mg/L) β2-microglobulin. The median survival was 13 months for the β2-microglobulin–high/HGF-high group as compared with 23 months in the β2-microglobulin–high/HGF-low group (P = .04). There was no significant difference between the two β2-microglobulin groups with regard to the number of patients with high or low HGF, but the mean HGF level was significantly higher in the group with β2-microglobulin ≥6.00 mg/L (1.20 ng/mL v 1.67 ng/mL; P = .02). A multivariate Cox regression analysis with the six factors retaining prognostic information in the NMSG study (mentioned above) as well as high or low HGF was performed in the patient group with β2-microglobulin greater than or equal to 6.00 mg/L. High or low HGF was then a powerful prognostic factor (P = .003) along with age (P = .009), IL-6 receptor (P = .04), and β2-microglobulin (P = .04).
Kaplan Meyer survival curves for patients separated by β2-microglobulin and HGF. (▿) β2-microglobulin low (<6.00 mg/L), HGF low (<1.10 ng/mL), n = 140; (▵) β2-microglobulin low (<6.00 mg/L), HGF high (≥1.10 ng/mL), n = 96; (◊) β2-microglobulin high (≥6.00 mg/L), HGF low (<1.10 ng/mL), n = 72; (○) β2-microglobulin high (≥6.00 mg/L), HGF high (≥1.10 ng/mL), n = 71. The survival difference between (▿) and (▵) was not significant. The survival difference between (◊) and (○) was significant (P = .04).
Kaplan Meyer survival curves for patients separated by β2-microglobulin and HGF. (▿) β2-microglobulin low (<6.00 mg/L), HGF low (<1.10 ng/mL), n = 140; (▵) β2-microglobulin low (<6.00 mg/L), HGF high (≥1.10 ng/mL), n = 96; (◊) β2-microglobulin high (≥6.00 mg/L), HGF low (<1.10 ng/mL), n = 72; (○) β2-microglobulin high (≥6.00 mg/L), HGF high (≥1.10 ng/mL), n = 71. The survival difference between (▿) and (▵) was not significant. The survival difference between (◊) and (○) was significant (P = .04).
DISCUSSION
The main finding in this study is that in a large, well-defined population of untreated myeloma patients, the median HGF concentration in serum at the time of diagnosis is more than twice as high as in a normal population, and more than 40% of the patients have abnormally elevated values. Furthermore, we here report that the serum HGF levels decrease after treatment response and increase during disease relapse. This extends our previous observations that myeloma cells can produce HGF and express the receptor for HGF. Together these observations firmly establish that HGF is related to multiple myeloma.
Several parameters have been examined in serial measurements to determine their usefulness as clinical markers of disease progression as compared with s–M-protein, which is an accepted marker of the tumor load.20 IL-6 levels have been reported to rise in leukemic phases of the disease, to fall in response to treatment, and to rise during relapse.21-24 However, in another study of 34 patients, IL-6 levels were not predictive of remission, recurrence, or progression of malignant myeloma.25 Measurements of the IL-6 receptor revealed a significant correlation between the concentrations of serum IL-6 receptor and the disease activities.26-28 The mean plasma cell acid phosphatase scores in 25 patients in remission/plateau were significantly lower than the mean score at diagnosis.29Although β2-microglobulin is an important prognostic factor in myeloma, its role in monitoring the disease is disputed.30-35 On this background we examined whether HGF concentrations in serum could be useful as a follow-up parameter. At the time point of response HGF in a group of patients was significantly lower than at diagnosis, only to rise again at relapse. To obtain more detailed information of the variability of the HGF levels during and after treatment, we analyzed a few patients over a long time period. There was a tendency for the HGF concentrations to decrease in response to effective treatment whereas ineffective treatment caused only small or no decrease in HGF concentrations. After termination of treatment HGF levels remained low for some time, contesting the argument that low HGF levels in treatment periods are merely a result of suppressed cytokine production. Before relapse, HGF rose in concert with or lagged slightly behind the change in s–M-protein levels. Although the data do not permit statistical evaluation, they suggest that the serum levels of HGF may fluctuate in concordance with the tumor burden and that HGF is a candidate in the search for markers of disease activity. The changes were also present in patients with low HGF values at the time of diagnosis (Fig 2), and serial measurements could prove valuable both in patients with low and elevated HGF levels at diagnosis. However, because of the small patient numbers in our study, larger prospectively designed studies are necessary to confirm our results.
Renal failure has been reported to cause high serum HGF.36However, in our material there was no correlation between HGF levels and serum creatinine (data not shown), suggesting that the high HGF levels measured were not caused by renal failure. Furthermore, no correlation was seen between HGF and leukocyte counts, suggesting that infection did not make a major contribution to the elevated HGF levels.
The supernatants of cultured bone marrow mononuclear cells from myeloma patients contain an osteoclast-stimulating factor.37 Recent work has shown that HGF is involved in the process of osteoclast recruitment, growth, motility, and activation.9-11 We therefore examined our material with particular interest for a relation between HGF and markers of bone disease. In a bivariate correlation analysis HGF correlated significantly but weakly to a few variables of interest (Table 1). In a large patient material even small correlations are often highly significant, and a multivariate regression analysis is better to discern the importance of these correlations. In our material lnICTP, a marker of bone resorption rate,38 39 in a simple regression model came out as the best predictor for HGF. This result could give some support to the hypothesis of HGF as a bone-destructive cytokine in myeloma. However, with an unexplained variance of more than 90%, less than 10% of the variability in HGF is accounted for by changes in ICTP, it is obvious that a causal relationship between the variables cannot be drawn from this material. It should also be underlined that bone destruction is a local tissue process that may not be reflected by levels of mediators in the systemic circulation.
The achievement of plateau phase is a marker of response to conventional chemotherapy treatment in multiple myeloma.40Previously reported pretreatment markers of reaching plateau phase are hemoglobin, albumin, and β2-microglobulin.41 42 In the patient group with high HGF values at diagnosis, a lesser percentage of patients achieved plateau phase; this group also had a significantly lower median survival. Interestingly, these characteristics were especially pronounced in a small group of patients with extremely high HGF values at diagnosis, where only one fourth of patients reached plateau and the median survival time was less than 1 year. Furthermore, HGF seems to provide extended prognostic information in the patient group with high β2-microglobulin, and the combination of HGF and β2-microglobulin may help to identify patients with extremely poor prognosis.
Elevation of serum HGF has been described in patients with breast cancer and gastric cancer, but this elevation tended to be significant only in patients with recurrent disease.8 43 The present study is the first report suggesting a prognostic information of serum HGF levels measured at the time of diagnosis in cancer patients. We conclude that HGF levels are significantly increased in a large proportion of myeloma patients at diagnosis and that the levels varies according to treatment response and relapse. The study adds HGF to the list of factors that are related to multiple myeloma, although its precise biological significance is still not known.
ACKNOWLEDGMENT
We are grateful to Hege Skjellerudsveen for excellent technical assistance, to Geir Jacobsen for comments on the the statistical calculations, and to Erik Holmberg for help in the transmission of data.
APPENDIX
Members of the directory board of the Nordic Myeloma Study Group in alphabetical order: I.M.S. Dahl, P. Gimsing, E. Hippe, M. Hjort, E. Holmberg, J. Lamvik, E. Löfvenberg, S. Magnusson, J.L. Nielsen, I. Palva, S. Rödjer, I. Talstad, I. Turesson, J. Westin, and F. Wisløff.
Supported by the Norwegian Cancer Society and The Cancer Fund, Trondheim, Norway.
Address reprint requests to Carina Seidel, MD, Institute of Cancer Research and Molecular Biology, Norwegian University of Science and Technology, Medisinsk Teknisk Senter, N-7005 Trondheim, Norway.
The publication costs of this article were defrayed in part by page charge payment. This article must therefore be hereby marked “advertisement” in accordance with 18 U.S.C. section 1734 solely to indicate this fact.


