Abstract
T-cell and B-cell reconstitution was studied in nine patients who received fluorescence activated cell sorter (FACS)-sorted autologous CD34+ hematopoietic progenitor cells (HPC). The mean numbers of T cells (CD3+), B cells (CD19+) and CD34+ HPC administered to each patient were .004, .002, and 1.8 × 10⁶ cells/kg, respectively. After high-dose myeloablative chemotherapy (busulfan, cyclophosphamide, etoposide) CD34+ HPC were infused and lymphoid reconstitution was monitored using flow cytometry and reverse transcriptase-polymerase chain reaction (RT-PCR) amplification of VDJ T-cell receptor (TcR) sequences. Restoration of normal numbers of peripheral blood T cells and B cells among recipients of FACS-sorted CD34+ HPC was delayed compared to recipients of non-T-cell–depleted PBSC autografts. In both patient groups, the circulating T cells were primarily CD4−, CD8+, αβ TcR+, and CD45RO+, CD45RA− during the first 2 months after transplant. Subsequent increases in the frequency of CD45RA+ CD45RO− T cells occurred at 2 to 3 months after transplant, suggesting maturation of CD34+hematopoietic progenitors to “naive” T cells. Analysis of the TcR repertoire after hematopoietic reconstitution demonstrated decreased diversity of Vβ TcR expression associated with global decreases in the absolute number of total peripheral blood T cells and most Vβ TcR+ subsets. Three of nine recipients of FACS-sorted CD34+ HPC demonstrated significant increases in the percentage of γδ+ peripheral T cells and CD5+ B cells at 3 to 9 weeks after transplantation, and all patients had transient oligoclonal expansions of T cells expressing specific Vβ TcR. Transplantation with highly purified CD34+ HPC results in reduced diversity of the peripheral T-cell repertoire during the early post-transplant period compared with patients receiving unmanipulated or MoAb-depleted transplants.
QUANTITATIVE AND qualitative differences in the kinetics of reconstitution for the various blood cell lineages characterize the period of hematopoietic recovery that follows myeloablative chemoradiotherapy and bone marrow/peripheral blood progenitor cell transplantation. Reconstitution of the myelomonocytic, megakaryocytic, and erythroid lineages depends only on achieving adequate numbers of granulocytes, monocytes, platelets, and red blood cells in the circulating blood, and functional cells in these lineages develop immediately following maturation of undifferentiated CD34+ hematopoietic progenitor cells present in the transplant graft. However, the contribution of pluripotent stem cells to lymphoid engraftment after bone marrow transplantation (BMT) and peripheral blood stem cell transplantation (PBSCT) is less clear.1 Qualitative aspects of lymphocyte function, which depend on the presence of antigen specific T cells and B cells within a diverse immune repertoire, may be more important than the simple quantity of circulating lymphocytes in the blood and in lymphoid organs. In patients receiving non-T-cell–depleted allogeneic transplants, recovery of donor-derived lymphocytes is rapid although the restoration of a fully functional immune system capable of responding to antigenic challenge takes 6 months to 1 year after BMT.2-4 Functional reconstitution of the lymphoid compartment depends either on the presence of adequate numbers of antigen-specific T cells and B cells in the transplant graft or the maturation of lymphoid progenitors and perhaps pluripotent stem cells into antigen-specific T cells and B cells within the thymic and bone marrow microenvironments post-BMT/PBSCT.
Whereas removal of mature lymphoid cells from autologous bone marrow and PBSC autografts has been shown to increase the chance of relapse-free survival for patients with T-cell or B-cell malignancies, a potentially deleterious consequence is a transient, severe combined immunodeficiency (SCID) after BMT.2,5-8 Although the number of T lymphocytes increases rapidly among recipients of T-cell-depleted autologous BMT, the cytotoxic and proliferative functions of T cells remain significantly impaired for up to 1 year after BMT.4Studies comparing patients who received T-cell–depleted autologous BMT with patients receiving T-cell–replete autologous BMT or allogeneic BMT showed that all three groups of patients had a similar pattern of immune reconstitution after BMT–an initial increase in the numbers of circulating natural killer (NK) cells, T cells, and monocytes in addition to the delayed restoration of normal numbers of B cells in the peripheral blood over a 6- to 12-month period after BMT.2-4,9-11 These data suggest that the immunodeficiency seen after transplantation is caused by qualitative defects in cellular and humoral immunity that are not simply explained by deficits in the numbers of circulating lymphocytes.2 3 The cause of this qualitative post-BMT T-cell dysfunction among autologous BMT recipients who do not receive immunosuppressive drugs is unclear. One possible explanation may be the decreased diversity of the T-cell repertoire after BMT.
Phenotypic analysis of the peripheral T-cell compartment using monoclonal antibodies to specific TcR-V regions in patients receiving unmanipulated autologous and allogeneic BMT, has shown that one or more V-specific subsets were overrepresented at some time point after BMT.12 Studies comparing the peripheral T-cell repertoire of normal individuals and BMT recipients using reverse transcriptionase-polymerase chain reaction (RT-PCR) of the TcR region (CDR3 size spectratyping) found that the circulating T-cell repertoire in normal controls was both complex and stable over time, whereas post-BMT patients showed contraction of some TcR Vβ families, as well as oligoclonal expansions of others resulting in an overall decreased complexity of the peripheral T-cell compartment.10,13,14 Although the complexity of the T-cell repertoire has been studied in depth in the peripheral blood from normal subjects and after conventional BMT, similar studies in patients receiving significantly T-cell–depleted autologous BMT have not been reported. We recently completed a clinical study of patients transplanted with highly purified fluorescence-activated cell sorter (FACS)-sorted autologous CD34+ peripheral blood stem cells.15 In the present study we analyzed the kinetics of T-cell, B-cell, and NK cell reconstitution in this same group of patients using multiparameter flow cytometry and RT-PCR spectratyping. Our hypothesis was that transplantation with CD34+FACS-sorted autologous PBSC might result in delayed immune reconstitution of the peripheral B-cell and T-cell compartments as a result of inefficient de novo differentiation of CD34+hematopoietic precursors into B cells and T cells in adults. We found that reconstitution of normal numbers of circulating peripheral blood T cells and B cells was severely delayed for up to 1 year among recipients of CD34+ FACS-sorted autologous PBSC transplants. Phenotypic and genotypic analysis of lymphoid subsets demonstrated initial posttransplant expansions of a limited number of different T-cell clones, followed by the appearance of naive-type T cells, subsequently contributing to the reconstitution of a more diverse peripheral blood lymphoid compartment.
MATERIALS AND METHODS
Patient characteristics.
Nine patients with a median age of 41 years (range, 22 to 58) and poor-risk non-Hodgkin's lymphoma (NHL) who received FACS-sorted autologous CD34+ hematopoietic stem cells (HSCs) have recently been described.15 Blood samples for phenotypic analysis of immune reconstitution were obtained weekly during the patient's initial hospitalization and then every 2 to 6 months, while being followed in the outpatient BMT clinic. Peripheral blood samples from a control group of 11 patients with NHL, Hodgkin's disease (HD) and multiple myeloma (MM) with median age of 40 (range, 28 to 60) who underwent the same preparative regimen but received unmanipulated PBSC transplants were studied for the numbers of circulating T cells, B cells, and NK cells post-transplant. In addition, a larger control group, including an additional 9 patients (total of 20) patients were studied for the kinetics of lymphocyte reconstitution posttransplant.
Isolation of CD34+ HSC and transplant regimen.
Patients received 4 g/m2 cyclophosphamide on day −30, followed by granulocyte-colony-stimulating factor (G-CSF) at 20 μg/kg for 10 days. One or two large-volume aphereses were performed to collect a PBSC product of at least 6 × 10⁶CD34+ cells/kg. The CD34+ cells were enriched by immunoaffinity purification using the CEPRATE device (Cell-Pro, Bothell, WA); the CD34+ cell-enriched fraction was then further purified by high-speed FACS sorting using a FACS Vantage cell sorted (Becton Dickinson, San Jose, CA) and cryopreserved.15 The pretransplant conditioning regimen consisted of busulfan, 4 mg/kg orally, ×4 days; cyclophosphamide, 60 mg/kg/d intravenously × 2 days; and etoposide, 10 mg/kg/d intravenously ×3 days. On day 0, the cryopreserved CD34+purified cells were thawed and infused. Patients received G-CSF (Amgen, Thousand Oaks, CA) 10 μg/kg subcutaneously beginning on day 0, and received standard transplantation supportive care therapy.
Isolation of mononuclear cells and determination of peripheral blood and lymphocyte counts.
Pretransplant samples were obtained from the CD34− PBSC fraction after immunoaffinity column purification of the apheresis product. At 21, 35, 45, 60, 180, and 365 days after transplantation, 20 ml of EDTA or Na heparin anticoagulated blood was obtained. The absolute number of mononuclear cells in each sample was determined by adding the number of lymphocytes and monocytes per microliter, as determined by a complete blood count performed using an Abbot Cell Dyne 2. The mononuclear cell fraction of the peripheral blood was isolated by centrifugation over a step gradient of Ficoll-Hypaque (density 1.077 g/mL) and washed twice by dilution with Hank's balanced salt solution (HBSS) plus 3% fetal bovine serum (FBS) and 5 mmol/L EDTA, followed by centrifugation at 500g for 5 minutes.
FACS analysis.
For flow-cytometric analysis, isolated MNCs were stained with combinations of monoclonal antibodies directly conjugated to FITC, PE, and PerCP against the following antigens: CD3, CD4, CD5, CD8, CD16, CD19, CD45, CD45RO, CD45RA, CD56, pan αβ, pan γδ, and specific Vα, Vβ, Vγ, and Vδ TcR antibodies (Table 1). In this study, 100-μL cell solution aliquots containing 1 × 10⁵–1 × 10⁶ cells were incubated at 4°C with saturating concentrations of up to three different monoclonal antibodies (MoAbs) for 30 minutes, washed, and then fixed in a final concentration of 2% paraformaldehyde. The stained and fixed samples were then analyzed using a FACS Caliber flow cytometer (Becton Dickinson). List mode files of 20,000 events were acquired with a light-scatter gate, which included lymphocytes and monocytes. The numbers of each phenotypically defined T-, B-, or NK cell type in the peripheral blood per microliter was determined by multiplying the numbers of lymphocytes per microliter by the percentage of nucleated cells with that phenotype that fell within the lymphocyte gate, as determined by flow cytometry.
Molecular analysis.
Pretransplant samples were initially obtained from the apheresis column unabsorbed fraction generated in the first step of the CD34+ selection protocol. Follow-up samples of 20 mL of EDTA-anticoagulated peripheral blood were obtained from the patients at various time points after BMT. Isolated MNCs were washed with phosphate-buffered saline (PBS) plus 3% albumin, and their RNA was extracted using RNAzol, phenol-chloroform extraction (Tel-Test, Friendswood, TX). cDNA was synthesized using random hexamer primers and reverse transcriptase (Promega, Madison, WI). Bidirectional amplification of the CDR3 region for each of 25 Vβ TcR gene segments was performed using a two-step PCR to produce gene segments varying in length from 250 to 500 bp.10,16 The first step consisted of the addition of a constant region primer, OTCB3, along with a specific Vβ primer (see Table 3), followed by 45 cycles of PCR.16This was followed by a three-cycle PCR run-off reaction with a fluorescently labeled internal probe (6-FAM–labeled TcRBC) and subsequent separation on a 6% polyacrylamide gel (19 : 1 acrylamide/bis). Fluorescent spectrometry was used to detect the resultant fluorescently labeled bands containing Vβ TcR sequences. The fluorescently labeled PCR products were analyzed using Genescan Analysis 2.02 software (Perkin-Elmer, Norwalk, CT) to produce histograms representing the Vβ spectratype with individual peaks separated by 3 bps. In some instances, when patients had very low lymphocyte counts during the first 1 to 2 months after transplantation and from some apheresis products, insufficient numbers of lymphocytes were obtained for successful extraction of RNA, PCR amplification of TcR CDR3 sequences, and spectratyping.
The overall complexity within a Vβ TcR family and among the different Vβ TcR families was determined by counting the numbers of different peaks and determining their relative amplitude on the spectratype histogram. A novel mathematical formula representing the complexity of each Vβ TcR family (Vβ complexity) was determined by first calculating the ratio of the sum of the heights of the major peaks (MPHs) to the sum of all the peak heights (TPHs) and then dividing this ratio by the number of major peaks present (no. MP), that is, (MPHs/TPHs)/no. MP. Major peaks were defined as those peaks on the spectratype histogram whose amplitude was at least 10% of the TPH. The Vβ complexity numbers calculated for each Vβ TcR family were added together to yield an overall complexity score that represented the complexity of the Vβ TcR repertoire at that point in time. Oligoclonal representation of a particular Vβ TcR was defined as when one peak represented greater than 60% of the total peak height (peak height ≥ .6 × TPH) or when two major peaks were identified, each of which represented greater than 40% of the total peak height (combined peak height ≥ .8 × TPH).
RESULTS
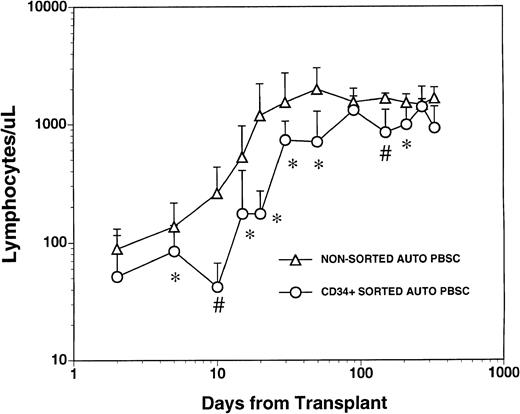
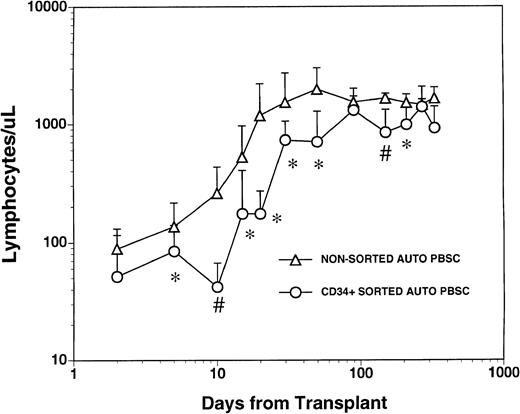
The mean numbers of mononuclear and CD34+ cells present in the graft after CD34+ selection and prior to cryopreservation were 3.7 ± 4.6 × 10³ CD3+T cells/kg, 1.1 ± 1.2 × 10³ CD14+monocytes/kg, 2.4 ± 5.4 × 10³ CD19+ B cells/kg and 1.8 ± 0.77 × 10⁶/kg CD34+hematopoietic progenitors. These values represented a significant depletion of lymphocytes and monocytes compared with the unmanipulated apheresis products that had been collected from these patients and were significantly lower than the numbers of monocytes and lymphocytes in the nonsorted autologous PBSC grafts obtained from 1 to 3 aphereses of a control group of patients (Table 1). All patients who received FACS sorted CD34+ autologous PBSC showed successful myeloid engraftment with a median time to achieve an absolute neutrophil count (ANC) of 500/μL and 1000/μL of 11 (range, 10 to 14) and 12 (range, 11 to 19) days, respectively. To compare lymphocyte engraftment between patients receiving CD34+FACS-sorted cells and the control population, we calculated the median time to an absolute lymphocyte count of 500/μL for each patient in both cohorts, reasoning that patients with fewer than 500 total lymphocytes (and less than 200 CD4+ cells/μL) would be at increased risk of opportunistic infections.17 The median time to recovery of more than 500 lymphocytes/μL was 30 days (range, 15 to 290) for the patients who received FACS-sorted CD34+PBSC and 20 days (range, 10 to 170) for the control population (Fig1). The mean number of circulating lymphocytes was significantly higher (P < .05) for nonsorted control group at all time points between day +5 and day +50 post-transplant, and at day +150 and day +200 post-transplant (Fig 1).
Lymphocyte recovery in patients transplanted with either nonsorted autologous BM/PBSC or with FACS-sorted CD34+autologous HPC. Mean lymphocyte counts (±SD) in nine patients after treatment with marrow lethal therapy and infusion of the highly purified CD34+ HPC (○). The mean numbers (±SD) of lymphocytes in the blood of 20 patients receiving unmanipulated PBSC autografts (▵). The median time to obtaining an ALC > 500/μL among recipients of standard PBSC autografts was 20 days (range, 10 to 170) and was 30 days (range, 15 to 290) for the patients who received FACS sorted CD34+ HPC. The mean lymphocyte count in a separate population of 10 normal donor subjects was 1,800 cells/μL with a standard deviation of 400 cells/μL. Significant differences between the mean values in the two groups of patients are indicated: *P < .05; #P < .001.
Lymphocyte recovery in patients transplanted with either nonsorted autologous BM/PBSC or with FACS-sorted CD34+autologous HPC. Mean lymphocyte counts (±SD) in nine patients after treatment with marrow lethal therapy and infusion of the highly purified CD34+ HPC (○). The mean numbers (±SD) of lymphocytes in the blood of 20 patients receiving unmanipulated PBSC autografts (▵). The median time to obtaining an ALC > 500/μL among recipients of standard PBSC autografts was 20 days (range, 10 to 170) and was 30 days (range, 15 to 290) for the patients who received FACS sorted CD34+ HPC. The mean lymphocyte count in a separate population of 10 normal donor subjects was 1,800 cells/μL with a standard deviation of 400 cells/μL. Significant differences between the mean values in the two groups of patients are indicated: *P < .05; #P < .001.
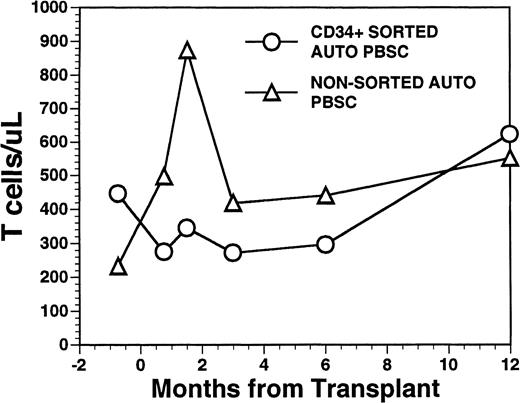
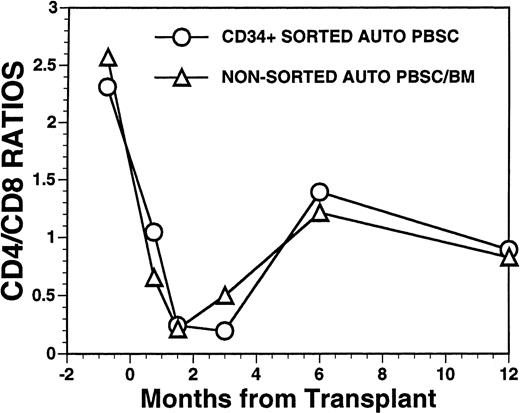
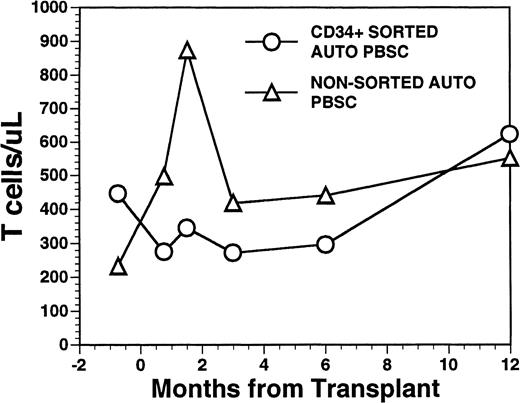
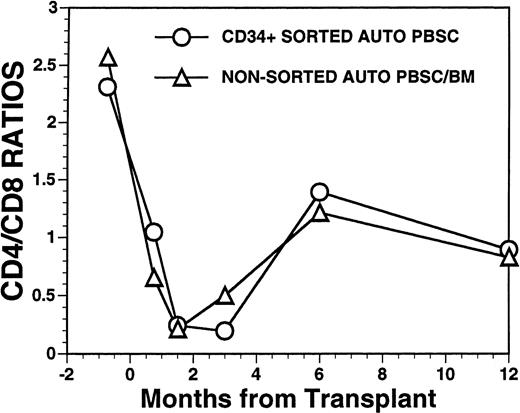
Overall, T-cell reconstitution was delayed among recipients of FACS-sorted CD34+ autologous PBSC with mean values (±SD) of peripheral blood CD34+ T cells/μL of 276 ± 425/μL at 1 month after BMT, 346 ± 516/μL at 2 months after BMT, 296 ± 224/μL at 6 months and 624 ± 207/μL at 1 year after BMT (Fig2). For the nonsorted control group, the corresponding mean values (±SD) of CD3+ T cells/μL were 498 ± 179/μL at 1 month, 874 ± 905/μL at 2 months, 441 ± 181/μL at 6 months, and 551 ± 140/μL at 12 months after BMT (Fig2, P = NS). Three patients showed significant increases in the frequency of γδ T cells during the first 2 months posttransplant with the percentages of T cells expressing the γδ TcR increasing from 2%, 4%, and 5% of the peripheral T cells in the pretransplant blood samples to maximum values of 31%, 10%, and 14%, respectively, in PB samples obtained 3 to 5 weeks posttransplant, followed by subsequent declines into the normal range (data not shown). Increased numbers of circulating γδ T cells were not seen among recipients of nonsorted autografts (data not shown). Following transplantation, inversion of the CD4/CD8 ratio of peripheral blood T cells was seen among all nine recipients of FACS-sorted HPC, as well as recipients of unmanipulated PBSC autografts until 6 months after BMT (Fig 3). The low CD4/CD8 ratio was mainly the result of extremely low numbers (<100/μL) of CD3+, CD4+ T cells with relatively normal numbers of CD3+, CD8+ T cells. Recipients of FACS-sorted CD34+ HPC had significantly (P < .05) lower mean numbers (±SD) of circulating CD3+, CD4+T cells/μL at 1 month, 2 months, and 6 months after BMT (37 ± 70/μL; 31 ± 45/μL, and 101 ± 25/μL, respectively), compared with the mean numbers of CD3+, CD4+ T cells/μL present in the blood of recipients of nonsorted PBSC autografts at the same time points after BMT (137 ± 47/μL, 189 ± 241/μL, 195 ± 80/μL, respectively). CD3+, CD8+ T cells/μL were slightly lower among recipients of sorted CD34+ autologous HPC compared with recipients of PBSC autografts, but the differences did not reach statistical significance (data not shown). Two patients who received FACS-sorted HPC developed a normal CD4/CD8 ratio at 6 months (ratios, 1.7 and 3.1), whereas a third patient had a normal CD4/CD8 ratio by 1 year after BMT (ratio, 1.3). One recipient of FACS-sorted HPC had an early and transient increase of the CD4/CD8 ratio to 7.3 at 3 weeks after FACS-sorted HPC infusion, when the total number of T cells was <100/μL.
Numbers of peripheral blood T cells in patients undergoing transplantation with autologous PBSC. Mean T-cell count per microliter in nine patients after treatment with marrow lethal therapy and infusion of the highly purified CD34+ HPC (○). Mean T-cell count per microliter in the blood of 11 patients receiving unmanipulated PBSC autografts (▵).
Numbers of peripheral blood T cells in patients undergoing transplantation with autologous PBSC. Mean T-cell count per microliter in nine patients after treatment with marrow lethal therapy and infusion of the highly purified CD34+ HPC (○). Mean T-cell count per microliter in the blood of 11 patients receiving unmanipulated PBSC autografts (▵).
FACS analysis of CD4 and CD8 T-cell subsets in patients after autologous PBSC transplantation. Mean ratio of CD3+CD4+ helper T lymphocytes to CD3+CD8+ suppressor T lymphocytes during the posttransplant period in nine patients transplanted with FACS-sorted CD34+ HPC (○). Mean CD4/CD8 ratio of T cells in the blood of 11 patients receiving unmanipulated PBSC autografts (▵).
FACS analysis of CD4 and CD8 T-cell subsets in patients after autologous PBSC transplantation. Mean ratio of CD3+CD4+ helper T lymphocytes to CD3+CD8+ suppressor T lymphocytes during the posttransplant period in nine patients transplanted with FACS-sorted CD34+ HPC (○). Mean CD4/CD8 ratio of T cells in the blood of 11 patients receiving unmanipulated PBSC autografts (▵).
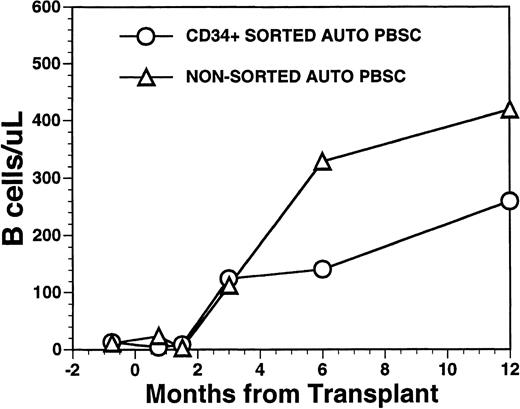
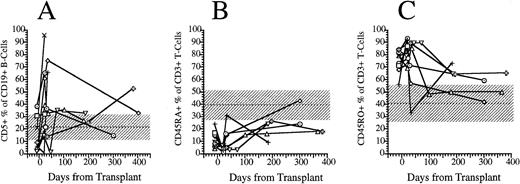
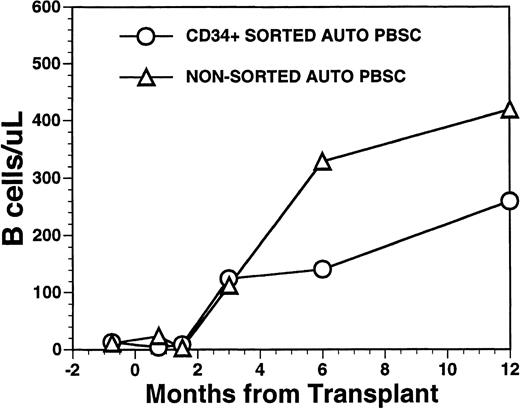
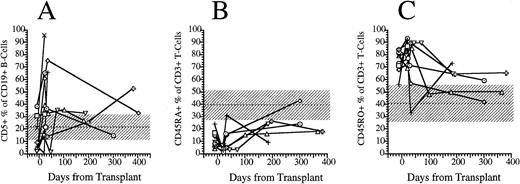
CD19+ B-cell recovery was delayed in both groups of patients, with B-cell counts typically <25 cells/μL until 2 months after BMT (Fig 4). Significant B-cell reconstitution did not occur until 6 to 12 months after BMT in both groups. The mean numbers (±SD) of peripheral blood B cells were 141 ± 30/μL at 6 months after BMT and 259 ± 114/μL at 1 year after BMT among recipients of FACS-sorted CD34+ HPC transplants and 329 ± 365/μL at 6 months and 419 ± 456/μL at 12 months after BMT among recipients of unmanipulated PBSC autografts (P = NS). During the first 2 months after transplantation with CD34+ sorted PBSCs, CD19+/CD5+B cells were significantly overrepresented, comprising a median of 36% (range, 0.4 to 85%) of the peripheral B-cell compartment at 3 weeks and a median of 65% (range, 25 to 99%) of B cells at 5 weeks after BMT (Fig 5A). This subset of B cells persisted at high percentages for up to 1 year post-transplant in some patients.
Numbers of peripheral blood B cells in patients undergoing transplantation with autologous PBSC. Mean number of B cells per microliter (CD19+) in the peripheral blood of eight patients transplanted with FACS-sorted CD34+ HPC (○). Number of B cells per microliter in the blood of 11 patients receiving unmanipulated PBSC autografts (▵).
Numbers of peripheral blood B cells in patients undergoing transplantation with autologous PBSC. Mean number of B cells per microliter (CD19+) in the peripheral blood of eight patients transplanted with FACS-sorted CD34+ HPC (○). Number of B cells per microliter in the blood of 11 patients receiving unmanipulated PBSC autografts (▵).
FACS analysis of CD5+CD19+ B lymphocytes and CD45RO and CD45RA T-cell subsets. (A) Percentage of immature B cells expressing the CD5 T-cell lineage antigen in the peripheral blood of eight patients transplanted with FACS-sorted CD34+ HPC. (B) Percentage of T cells in the peripheral blood of eight patients transplanted with FACS-sorted CD34+ HPC with the CD45RA+, CD45RO− phenotype (naive T cells). (C) Percentage of CD45RO−, CD45RA− (memory) T cells. Horizontal dashed line, mean value of 10 normal subjects; shaded area, 95% confidence interval.
FACS analysis of CD5+CD19+ B lymphocytes and CD45RO and CD45RA T-cell subsets. (A) Percentage of immature B cells expressing the CD5 T-cell lineage antigen in the peripheral blood of eight patients transplanted with FACS-sorted CD34+ HPC. (B) Percentage of T cells in the peripheral blood of eight patients transplanted with FACS-sorted CD34+ HPC with the CD45RA+, CD45RO− phenotype (naive T cells). (C) Percentage of CD45RO−, CD45RA− (memory) T cells. Horizontal dashed line, mean value of 10 normal subjects; shaded area, 95% confidence interval.
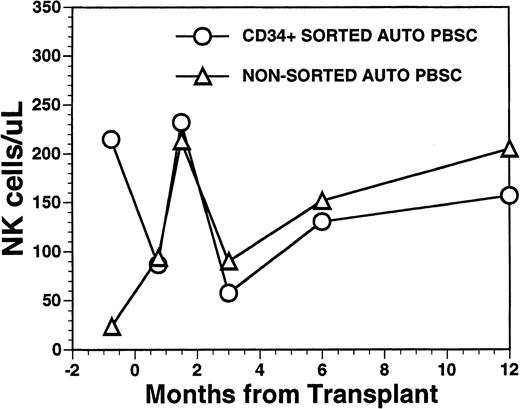
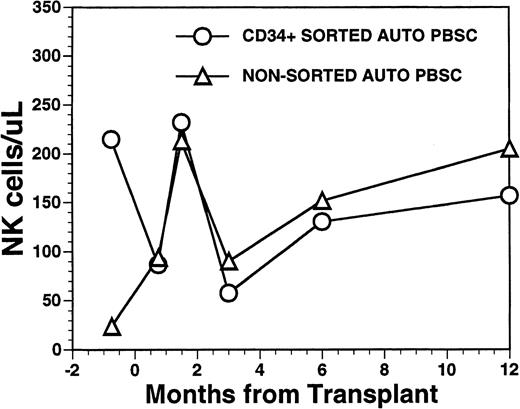
The mean number of circulating NK cells (CD16+/CD56+) reached the blood level of normal subjects during the first 2 months post-transplant with mean values (±SD) of 232 ± 151/μL among recipients of FACS-sorted CD34+ HPC, compared with 213 ± 97/μL among recipients of nonsorted PBSC autografts (P = NS) (Fig6). Circulating numbers of NK cells decreased in both populations at 3 months post transplant with mean values of 58 ± 48/μL among recipients of FACS-sorted CD34+ HPC and 90/μL among recipients of unmanipulated PBSC autografts with subsequent rises to the normal range by 1 year after BMT (Fig 6) (P = NS). CD3+/CD56+ NK-like T cells followed a similar pattern as that of NK cells showing an early rise at around week 5 after BMT, followed by a decline to lower levels at 6 to 12 months after BMT (data not shown).
Numbers of peripheral blood NK cells in patients undergoing transplantation with autologous PBSC. Mean number of NK cells/μL (CD16/CD56+) in the peripheral blood of eight patients transplanted with FACS-sorted CD34+ HPC is shown as open circles (○). Number of NK cells/μL in the blood of 11 patients receiving unmanipulated PBSC autografts are shown in the open triangle (▵).
Numbers of peripheral blood NK cells in patients undergoing transplantation with autologous PBSC. Mean number of NK cells/μL (CD16/CD56+) in the peripheral blood of eight patients transplanted with FACS-sorted CD34+ HPC is shown as open circles (○). Number of NK cells/μL in the blood of 11 patients receiving unmanipulated PBSC autografts are shown in the open triangle (▵).
We used the pattern of expression of the CD45 isoforms CD45RO and CD45RA as a surrogate marker to determine the developmental stage of T cells. CD45RA single positive T cells are recent thymic emigrants that have yet to encounter antigen and are considered “naive,” whereas CD45RO single positive T cells or “memory” T cells have emigrated from the thymus and encountered antigen in a peripheral lymphoid organ.18 19 We compared the fraction of CD3+ T cells that expressed solely CD45RO surface antigen (memory T cells) with the fraction that expressed solely CD45RA surface antigen and the fraction expressing both antigens. Before transplantation, a median of 9% (range, 4 to 24%) of blood T cells expressed only the CD45RA isoform (Fig 5B). After transplantation, the percentage of CD45RA single positive cells decreased to 4% (range, 1% to 8%) at 3 weeks, then slowly increased to 10% (range, 3% to 16%) at 5 weeks, 20% (range, 9% to 26%) at 6 months and 24% (range, 18% to 43%) at 1 year (Fig 5B). Before transplantation, a median of 79% (range, 56 to 84) were single positive for CD45RO surface antigen. Three weeks after transplantation a median of 81% (range, 69 to 93) of peripheral T cells were single positive for CD45RO; this had decreased to a median of 71% (range, 34 to 89) by 5 weeks, and this continued to decrease to 64% (range, 50% to 73%) at 6 months and 50% (range, 42% to 59%) by 1 year (Fig 5C). The number of CD3+ T cells expressing both CD45RA and CD45RO (double positive T cells) increased proportionally with the number of CD45RA single positive T cells between 3 weeks and 1 year posttransplant (data not shown).
T-cell repertoire reconstitution, flow cytometric analysis.
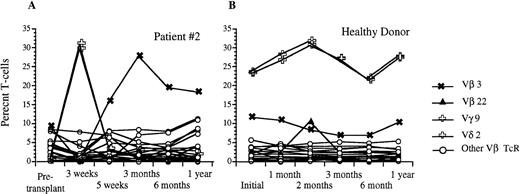
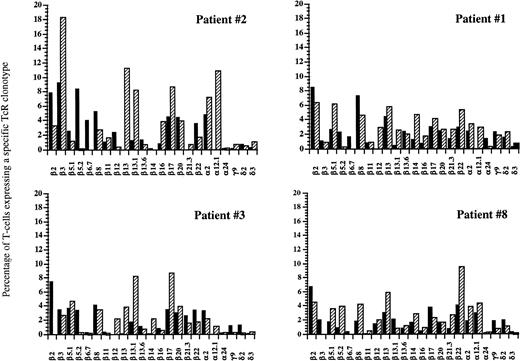
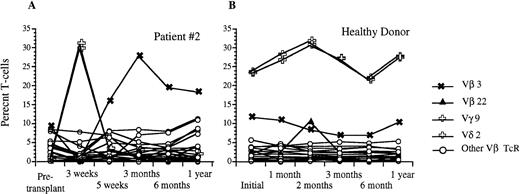
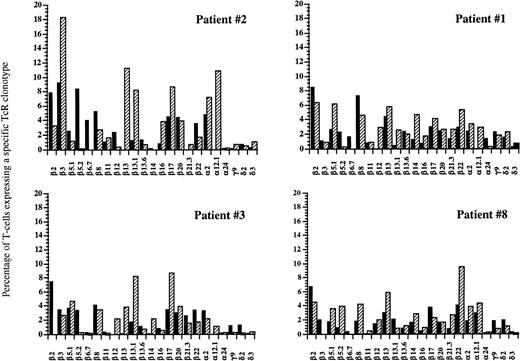
Using flow cytometric analysis, we measured the frequency of CD3+ peripheral blood lymphocytes expressing a given TcR-V region using the MoAb panel shown in Table2. Before transplantation, all nine patients studied demonstrated a relatively diverse TcR repertoire, with the majority of individual TcR-Vs expressed on 2% to 5% of peripheral T cells, and no significantly overrepresented TcR-V, similar to the peripheral repertoire of normal individuals (Table3). After transplantation with FACS-sorted CD34+ autologous HPC, all nine patients studied showed significant overexpression of at least one TcR at one or more time points, as defined by a frequency of an individual TcR-V more than the mean value for normal control patients +2 × SD (Table4). Six of these nine patients demonstrated at least one significantly overexpressed TcR-V within the first 2 months with relative underexpression of the remaining repertoire (less than 2%), as well as complete disappearance of some TcR-Vs. By contrast, only one of five recipients of nonsorted autografts had a significantly overexpressed TcR-V within the first 2 months after BMT. Three of the eight evaluable patients showed significantly overrepresented subsets of TcR-Vs between 3–5 months after transplantation, and six of the eight evaluable patients showed expansions of various T-cell subsets at 6 to 12 months after BMT. Figure 7 shows the percentage of T cells expressing different TcR-Vs using a panel of 25 MoAb in patient no. 2 before transplantation and at days 22, 37, 100, 180, and 350 after transplantation. There were transient increases in the percentages of peripheral T cells bearing Vγ 9 and Vδ 2 at 3 weeks after transplantation and a gradual increase in the percentage of T cells bearing Vβ 3 TcR to 26% at 3 months after BMT with a subsequent decline to 19% at 6 months, while the normal range for the fraction of T cells expressing Vβ 3 TcR was 4.5% ± 3.3%. In addition to the transient overexpression of various TcR-Vs in the post-transplant period, significantly decreased diversity of the remaining T-cell receptor repertoire was present with relative underrepresentation of the remaining TcR-V subsets during the early post-transplant period. The percentage of peripheral T cells detected by one of our panels of Vβ specific antibodies decreased from an average of 56% of αβ TcR+ T cells before transplantation to 33% at 3 weeks after transplantation. By 3 months, the peripheral T-cell receptor diversity had expanded to the point that our antibody panel detected 85% of circulating αβ TcR+ T cells which remained stable to 1 year after BMT. Although the T-cell receptor repertoire stabilized by 6 to 12 months after BMT, the overall pattern of TcR expression at 1 year after BMT was significantly different compared with the pretransplant pattern with some TcR-V subsets present at much lower levels, while others remained significantly overrepresented (Fig8). This pattern of overrepresentation of one or more Vβ TcR subsets with relative underexpression of the remaining subsets was seen in all but one of the nine patients studied (Table 4).
Analysis of circulating Vβ TcR repertoire after transplantation with FACS-sorted autologous CD34+ HPC versus a healthy donor. (A) Percentage of CD3+ peripheral T cells that express a given Vβ TcR at 3 weeks, 5 weeks, 3 months, 6 months, and 1 year after transplantation for patient #2. (B) Percentage of CD3+ peripheral blood T cells that express the same Vβ TcRs over time in a healthy donor. The frequencies of Vγ9 and Vδ2 were identical and are shown using the same symbol.
Analysis of circulating Vβ TcR repertoire after transplantation with FACS-sorted autologous CD34+ HPC versus a healthy donor. (A) Percentage of CD3+ peripheral T cells that express a given Vβ TcR at 3 weeks, 5 weeks, 3 months, 6 months, and 1 year after transplantation for patient #2. (B) Percentage of CD3+ peripheral blood T cells that express the same Vβ TcRs over time in a healthy donor. The frequencies of Vγ9 and Vδ2 were identical and are shown using the same symbol.
FACS analysis of circulating V-TcR repertoire in four patients before and at 1 year after autologous HPC transplantation. Filled bars represent the percentage of peripheral CD3+ T lymphocytes expressing a given V-TcR before transplantation, and hatched bars represent the percentage expressing the same V-TcR at 1 year posttransplant.
FACS analysis of circulating V-TcR repertoire in four patients before and at 1 year after autologous HPC transplantation. Filled bars represent the percentage of peripheral CD3+ T lymphocytes expressing a given V-TcR before transplantation, and hatched bars represent the percentage expressing the same V-TcR at 1 year posttransplant.
CDR3 spectratyping results.
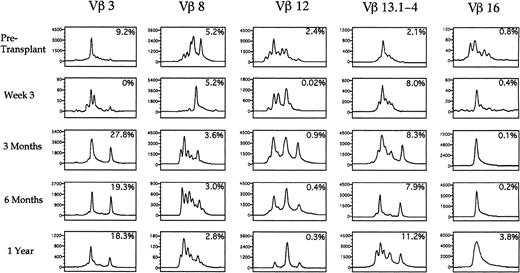
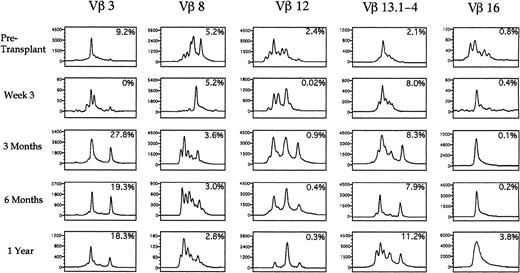
A spectratype histogram for each Vβ TcR family was generated for each peripheral blood sample studied. By analyzing the number of distinct peaks present among the PCR products for each TcR-V specific family, we determined whether the majority of TcR-V cDNA products had the same nucleotide length and were contained in a single peak or distributed among a few peaks, corresponding to an oligoclonal population, or distributed equally among many different peaks, corresponding to a polyclonal population of T cells. Of the eight patients analyzed by spectratyping, 7 showed oligoclonal expansions of at least one Vβ TcR family with one or two peaks predominating on at least one occasion after transplantation. Table 5 shows the specific oligoclonal expansions seen at the various time points in all the patients. The amplitude of the peaks in each PCR-amplified product corresponded to the relative quantity of different sized CDR3 mRNA species within a Vβ TcR family, and the number of peaks was a measurement of the T-cell Vβ TcR family repertoire complexity. Figure9 shows five representative Vβ-TcR histograms from patient no. 2 before transplant, and at 3 weeks, 3 months, 6 months, and 1 year after transplantation, with the corresponding percentage of T cells expressing the Vβ TcR detected by flow cytometry shown in the upper right corner of each box. Before transplantation 9.2% of peripheral T cells expressed Vβ 3 with a single peak comprising 64% of the total peak amplitude, whereas at 3 weeks after BMT, 4 peaks were present, indicating increased Vβ 3 complexity. At 3 months posttransplant when Vβ 3+ T cells constituted 27.8% of all circulating T cells, the Vβ 3 spectratype contained only two predominant peaks, which comprised more than 88% of the total peak height. This pattern remained relatively stable for 1 year posttransplant. By contrast, Vβ 8 was expressed on a relatively constant fraction of T cells before and after transplant (2.8% to 5.2%). The spectratype of Vβ 8 showed a complex pattern before transplantation, a single peak at 3 weeks after transplantation, followed by the development of a complex polyclonal pattern of Vβ 8 expression at 3 months posttransplantation. Vβ 12 was present on 2.4% of T cells before transplantation and spectratype analysis showed a complex pattern of heterogeneous expression. After transplantation, the frequency of TcR Vβ 12+ cells detected by flow cytometry declined to less than .5% with the corresponding appearance of a single peak on the Vβ 12 spectratype by 1 year posttransplant that represented 66% of the overall peak height. The Vβ 13 spectratype showed a complex polyclonal pretransplant pattern with the subsequent appearance of two peaks at 6 months after transplantation. The Vβ 16 spectratype showed a polyclonal pattern before transplantation, with the subsequent appearance of a single peak that persisted at 1 year after transplantation.
Spectratypes of the T-cell repertoire during the first year after autologous transplantation with FACS-purified CD34+ HPC. PBLs were analyzed using CDR3 spectratyping and multiparameter flow cytometry to ascertain the Vβ TcR repertoire from an individual patient at the time points shown. Histograms of the relative sizes of the PCR-amplified CDR3 region for five representative Vβ TcR gene products are shown. Numbers in the upper right corner of each box represent the percentage of cells expressing a specific Vβ TcR. The scale of the y-axis varies in each small box according to the maximal peak amplitude, which is proportional to the quantity of RNA bearing the specific Vβ TcR. The x-axis represents the nucleotide length of the PCR-amplified TcR gene products.
Spectratypes of the T-cell repertoire during the first year after autologous transplantation with FACS-purified CD34+ HPC. PBLs were analyzed using CDR3 spectratyping and multiparameter flow cytometry to ascertain the Vβ TcR repertoire from an individual patient at the time points shown. Histograms of the relative sizes of the PCR-amplified CDR3 region for five representative Vβ TcR gene products are shown. Numbers in the upper right corner of each box represent the percentage of cells expressing a specific Vβ TcR. The scale of the y-axis varies in each small box according to the maximal peak amplitude, which is proportional to the quantity of RNA bearing the specific Vβ TcR. The x-axis represents the nucleotide length of the PCR-amplified TcR gene products.
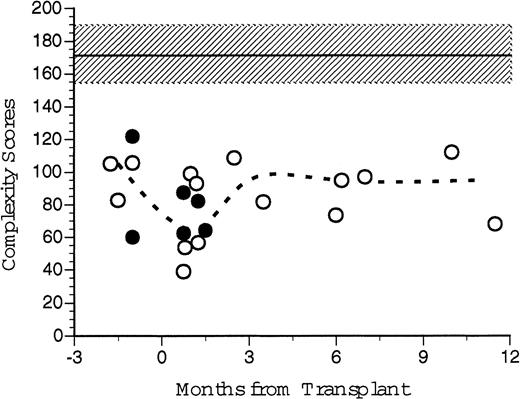
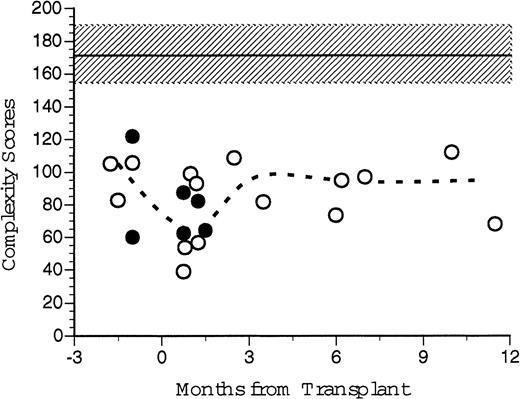
An overall Vβ TcR complexity score, the sum of the individual complexity values for each individual TcR Vβ family was generated for each recipient of FACS-sorted CD34+ PBSC transplants and for each nonsorted control patient before and at several time points after transplantation (Fig 10). We had predicted that individual patients' Vβ spectratypes would decline after transplantation because of the limited number of different mature T-cell clones present in the autograft. The median of the Vβ TcR complexity scores for six healthy patients was 175 (range, 141 to 191). The median of the pretransplant overall complexity scores for five patients (three recipients of CD34+ FACS-sorted PBSC, two nonsorted controls) was 105 (range, 83 to 106). At 1–2 months post-transplant the median complexity score for the transplanted patients was 67 (range, 31 to 93), significantly less than normal control and pretransplant values. At 3 to 5 months after BMT, the median complexity score had increased to 95 (range, 82 to 109), and at 6 to 12 months the median complexity score was 97 (range, 73 to 112). While technical limitations of the RT-PCR reaction precluded obtaining Vβ spectratypes of all samples, there was no substantial difference between the calculated post-transplant complexity scores for patients receiving FACS-sorted CD34+ autologous PBSC (open circles) compared to patients receiving unmanipulated autologous PBSC (filled circles, Fig 10). However, both the pretransplant values and the post-transplant complexity scores of all patients studied were substantially lower than values obtained from untreated normal donors.
TcR spectratyping complexity score sums over time. Complexity scores were generated from CDR3 spectratype analysis at various time points after transplantation. Individual complexity scores were generated for each Vβ TcR, which correlates to the number of peaks and their relative peak heights generated by autofluorescence of electrophoretic gels after RT-PCR of cDNA extracted from PBLs. Individual scores were summed to give an overall complexity score for that patient's peripheral TcR repertoire at that point in time. Open circles represent scores for the patients who received FACS-sorted CD34+ HPC transplants. Broken line represents the median values for all eight patients analyzed. Closed circles represent the control patient values. Shaded area and dashed line indicate the mean and standard deviation of seven normal healthy donors.
TcR spectratyping complexity score sums over time. Complexity scores were generated from CDR3 spectratype analysis at various time points after transplantation. Individual complexity scores were generated for each Vβ TcR, which correlates to the number of peaks and their relative peak heights generated by autofluorescence of electrophoretic gels after RT-PCR of cDNA extracted from PBLs. Individual scores were summed to give an overall complexity score for that patient's peripheral TcR repertoire at that point in time. Open circles represent scores for the patients who received FACS-sorted CD34+ HPC transplants. Broken line represents the median values for all eight patients analyzed. Closed circles represent the control patient values. Shaded area and dashed line indicate the mean and standard deviation of seven normal healthy donors.
DISCUSSION
Myeloid, erythroid, and megakaryocytic reconstitution after BMT have been shown to be directly related to the number of CD34+hematopoietic progenitors present in the graft but, the contribution of CD34+ hematopoietic progenitor cells to lymphoid reconstitution after BMT is less clear.1,20,21 Quantitative recovery of peripheral lymphocytes was delayed among recipients of FACS-sorted CD34+ HPC compared to conventional PBSC autografts (Fig 1). The restoration of a fully functional immune system has been shown to be significantly delayed after autologous BMT,2-4 a likely consequence of quantitative and qualitative defects in cellular immunity. Previous studies have hypothesized that quantitative increases in the number of circulating T cells in the first 2 months after BMT was mainly a result of the proliferation of mature T cells present in the graft,22resulting in a peripheral T-cell compartment lacking sufficient diversity and complexity to adequately recognize and respond to the variety of antigenic challenges.10 Our study of nine patients transplanted with highly purified CD34+ PBSC progenitors afforded an opportunity to examine lymphoid reconstitution among patients who received negligible numbers of mature T cells and B cells in their autograft. The CD34+ column selection followed by high-speed FACS sorting resulted in a 4.2-log depletion of T cells and a 4.6-log depletion of B cells with the average number of T cells and B cells in the stem cell autograft reduced to less than 4,000/kg, and 2,500/kg, respectively.15 We anticipated that patients who had received a limited number of T cells and B cells in their CD34+ FACS-sorted autograft would demonstrate a less diverse and less complex peripheral T-cell compartment, compared with that of patients receiving conventional PBSC transplants. Although there were minimal quantitative and temporal differences in the reappearance of peripheral blood T cells and B cells among patients receiving FACS-sorted CD34+ HPC transplants compared with a group of patients that received nonsorted PBSC autografts, there were significant qualitative differences in the phenotype of circulating lymphocytes after BMT between these two cohorts of patients.
Several of our findings support the hypothesis that early (<2 months after BMT) lymphoid engraftment among recipients of FACS-sorted CD34+ HPC was derived from expansions of limited numbers of mature, post-thymic T cells, whereas T cells appearing in the circulation at more than 2 months after BMT were derived from hematopoietic stem cells that differentiated during the post-transplant period. The patterns of CD45RA/CD45RO and CD4/CD8 expression on T cells were used as surrogate markers for their developmental status of T cells. Pretransplant analysis of CD45 isoforms in our patient population showed that 70% to 96% of circulating T cells expressed the CD45RO isoform alone, 4% to 30% expressed the CD45RA isoform, and an average of 12% of all peripheral T cells expressed both isoforms. After transplantation, the fraction of peripheral blood T cells that were CD45RO single positive was initially more than 80%. During the first year after BMT, the frequency of CD45RA single positive T cells gradually increased. These results suggest that (1) expansion of CD45RO+ mature “memory” T cells present in the PBSC graft or that survived myeloablative chemotherapy are responsible for early recovery of the peripheral T-cell compartment, and (2) the subsequent appearance of peripheral blood T cells expressing CD45RA and lacking CD45RO was the result of de novo maturation of CD34+ progenitor cells to “naive” CD45RA single positive T cells in the residual thymus or at an extrathymic site(s) of T-cell development.
Analysis of patients receiving T-cell–depleted marrow as well as patients receiving unmanipulated marrow in previous studies has shown that the numbers of circulating CD8+ (“suppressor”) T lymphocytes recover more rapidly than the numbers of CD4+(“helper”) T lymphocytes, however; the CD8 “overshoot” tends to be higher in recipients of untreated marrow transplants.4,23-25 Inverted CD4/CD8 ratios persisted as long as 2 years after engraftment, mainly attributable to persistent low numbers of CD3+, CD4+ T cells as CD3+, CD8+ T cells approached normal at around 30 days after BMT.9 23-25 None of the recipients of FACS-sorted CD34+ HPC or unmanipulated PBSC autografts had normal CD4/CD8 ratios at 2 months after BMT. Overall, recipients of FACS-sorted CD34+ HPC had lower numbers of circulating T cells and particularly CD4+ T cells, compared to recipients of unmanipulated PBSC autografts. Three recipients of FACS-sorted HPC in our present study had attained normal CD8 levels (mean, 479/μL ± 169) at 1 year after BMT; however, five of the nine study patients had decreased numbers of CD8 cells (mean, 86/μL ± 106) at 4 to 6 weeks after BMT that persisted until 6 months after BMT (mean, 181/μL ± 192). The persistent distortion of the CD4/CD8 ratio among recipients of FACS-sorted CD34+HPC, coupled with the appearance of CD45RA+ “naive” T cells suggests abnormal thymopoiesis in these patients, producing predominantly CD8+ T-cell formation in an extrathymic site that favors CD8+ over CD4+ T cells.
Supporting the hypothesis of abnormal thymopoiesis, or extrathymic T-cell development in these patients is our observation that six of the nine patients studied demonstrated persistently depressed numbers of circulating T cells between 6 months to 1 year after BMT, and three patients showed a marked elevation in the number of circulating γδ+ T cells in their peripheral blood at 1 to 2 months after BMT. Lamb et al26 reported that an increased frequency of γδ+ T cells after allogeneic partially matched related donor bone marrow transplantation is associated with a decreased incidence of leukemia relapse. The clinical significance of the higher frequency of γδ+ T cells among some of the patients in the current study is unknown, as the number of patients and their follow-up evaluation are limited. The origin of the γδ+ T cells in the immediate post-transplant period is unclear, but they may represent either de novo T-cell maturation from undifferentiated hematopoietic progenitors in an extrathymic site or expansion of small numbers of γδ T cells (eg, those contained in the intestinal epithelium) that survived the myeloablative regime. We did not use γ- or δ-specific oligonucleotide primers to study the complexity of γδ T cells, but FACS analysis showed uniform expression of γ9 and δ2 on the γδ+ T-cell population of patient no. 2.
We further analyzed the kinetics of T-cell reconstitution by looking at the peripheral TcR repertoire, using both flow cytometric and CDR3 spectratype analysis of circulating T cells at various time points after transplantation. Using a panel of 9 Vβ TcR MoAbs and 2 Vα TcR MoAbs, Gaschet et al13 demonstrated that this relatively small number of antibodies recognized up to 40% of all PBLs. We used an extended panel of antibodies, which included 17 Vβ TcR antibodies, 3 Vα TcR antibodies, 2 Vδ TcR antibodies, and 1 Vγ TcR antibody, with which we were able to recognize up to 81% of circulating peripheral blood lymphocytes in normal healthy donors. These antibodies were able to detect significant post-transplant expansions of specific TcR populations in all nine of the patients transplanted with FACS-sorted CD34+ PBSCs. Our results showed that patients transplanted with extremely low numbers of T cells also demonstrate an apparently random overexpression of various Vβ TcR subsets starting as early as 3 weeks and persisting as late as 1 year after BMT. Many of these subset expansions were transient, disappearing within 1 month, however; some persisted throughout the posttransplant period. Although several Vβ TcR subsets that were present at high percentages before BMT tended to be present at high frequencies after BMT (Vβ 2, Vβ 3, Vβ 5.2, and Vβ 8), and some Vβ TcR subsets that were expressed at extremely low percentages before BMT were present at low percentages after BMT (Vβ 11 and Vβ 16), the pattern of Vβ TcR expression at 1 year after BMT was not identical to the pretransplant repertoire. In six patients, we studied at 6 to 12 months after BMT, there was significant overrepresentation of one or more V-TcR subsets, possibly in response to endogenous and exogenous environmental antigenic stimuli that favored the expansion of some T-cell clones over other T-cell clones, irrespective of the pretransplant frequency.
Our results using CDR3 size spectratyping support previous studies that showed that normal persons exhibit complex patterns of peripheral T-cell spectratypes displaying a gaussian distribution of peaks and that this pattern is relatively stable over time.10,14 We predicted that after PBSC transplantation with FACS-sorted CD34+ stem cells, the overall complexity would be significantly contracted. Gorski et al10 described four outcomes of spectratype analysis seen in patients demonstrating T-cell abnormalities after transplantation, which included (1) contracted spectratypes with fewer bands, (2) gaps in the spectratype, (3) normal spectratypes, and (4) collapsed spectratypes.10 Our results confirmed a transient overall decrease in the complexity of the TcR repertoire after BMT (Fig 8). Gorski et al10 and Gorochov et al27 reported a collapsed spectratype for the Vβ 16 TcR in two patients after autologous BMT. We saw a monoclonal population within the Vβ 16 family in patient 2 that appeared by 3 weeks after BMT and persisted to 1 year after BMT (Fig 7). Of note, all patients with a history of NHL, HD, or MM were found to have a significantly lower total Vβ complexity score than that of normal subjects. The decreased diversity of the T-cell repertoire is possibly a consequence of the lymphotoxic effects of multiple cycles of cytotoxic chemotherapy received by these patients for treatment of their malignancy.28 Alternatively, there may be restrictions in the diversity of the T-cell compartment that are intrinsic to the nature of the underlying lymphoid malignancy. Patients 1 and 7 also showed an apparent clonal expansion of Vβ 16 during the first 6 months after transplantation (data not shown). Spectratyping showed that apparently oligoclonal T-cell populations were common during the post-transplant period (Table 4). Oligoclonal populations were seen most frequently among Vβ 25+ T cells and were present in four of the nine patients at various time points after transplantation.
In contrast to the detailed study of T-cell repertoire in these patients, a more limited analysis of the B-cell compartment showed a slow but persistent increase in the numbers of circulating B cells after BMT. We did observe a substantial increase in the fraction of CD 19+ B cells expressing the CD5 T-lineage marker. This distinct population of B lymphocytes normally comprises less than 1% of the total B-cell lymphoid population in the bone marrow and less than 10% of circulating peripheral blood B cells during adulthood.29,30 CD5+, CD19+ B lymphocytes were overrepresented during the early post-transplant period in the recipients of FACS-sorted CD34+ HPC, but not T- and B-cell–depleted autografts. The significance of the increase in the frequency of CD5+ B cells is unclear from the literature. Studies by Antin and Ault reported a high frequency of CD5+ B cells post-autologous BMT, while a study of TCD allogeneic BMT recipients and a study of B-cell–purged autologous recipients failed to demonstrate increased frequencies of CD5+ B cells after BMT in either patient population transplant.31-34 Waddick and Uckun34hypothesized that the absence of CD5+CD19+ B lymphocytes after BMT in the patients undergoing autologous BMT in their study was attributable to an absence of precursors for this B-cell subset in MoAb purged autografts. Our data indicate the generation of a phenotypically immature population of B cells in patients transplanted with FACS-sorted CD34+ HPC, consistent with the derivation of these B cells from undifferentiated CD34+ progenitors. A second hypothesis is that CD5+ B cells represent clonal expansions of mesenteric B cells that survived myeloablative chemotherapy. The absence of a molecular analysis of Ig gene diversity in the B-cell compartment does not allow further elucidation of this possibility.
One of the limitations of our study was that there was no genetic marking of transplanted stem cells to demonstrate conclusively that the immature B-cell and T-cell subsets definitively arose from transplanted precursors. However, our study has demonstrated (1) the initial post-transplant bias toward CD45RO single positive T cells with the subsequent emergence of CD45RA+ T cells; (2) the early post-transplant elevations in the frequency of γδ T cells and CD19+, CD5+ B cells; and (3) the appearance of clonal populations of specific T-cell families. These findings are consistent with the hypothesis that de novo development of T and B lymphocytes from the differentiation of early hematopoietic progenitors occurred during reconstitution of the immune system after transplantation with FACS-sorted autologous CD34+ HPC. Alternatively, these results may represent the expansion of minimal residual T cells present in the graft or T cells that survive myeloablative chemotherapy in the patient with the ability to expand in extra thymic sites after transplantation. In both settings, the limitations in diversity and complexity seen early after transplantation may be the result of limited antigen exposure in the host's post-transplant endogenous or exogenous environment, favoring some specific TcR gene rearrangements over others. Although no opportunistic infections were related to the relative immuno deficiency we observed in those patients transplanted with FACS-sorted CD34+ HPC, the limited diversity of the T-cell repertoire after BMT in patients transplanted with less than 4,000 autologous T cells/kg may portend more significant immunologic consequences when patients receive allogeneic bone marrow and PBSC grafts that have been T-cell depleted to the same extent. The study design did not include functional measurements of cellular or humoral immunity after BMT. These questions are being addressed in a current study of adoptive immunotherapy involving pretransplant immunization of patients undergoing autologous bone marrow and PBSC transplantation.
ACKNOWLEDGMENT
Sylvia Ennis provided valuable secretarial assistance with the manuscript, and Wayne Jones assisted with data management.
Address reprint requests to Edmund K. Waller, MD, Division of Hematology and Oncology, Emory University School of Medicine, Room 2123, 1639 Pierce Dr, Atlanta, GA 30322.
The publication costs of this article were defrayed in part by page charge payment. This article must therefore be hereby marked "advertisement" is accordance with 18 U.S.C. section 1734 solely to indicate this fact.

