Abstract
High plasma levels of the shed form of L-selectin (sL-selectin) are frequently detectable in acute myeloid leukemia (AML). sL-selectin can inhibit blast cell adhesion to vascular endothelium and may thereby influence the phenotype of AML. In this study, we have investigated the relationship between sL-selectin levels and clinical presentation or disease outcome in 100 patients with AML. Fifty-eight patients were found to have sL-selectin levels ≥3.12 μg/mL (≥3 SD above the mean of healthy controls: “increased”). Patients with extramedullary disease such as lymphadenopathies, splenomegaly, hepatomegaly, and/or muco-cutaneous infiltration had significantly increased sL-selectin levels (P < .001). sL-selectin levels were significantly heterogeneous in the French-American-British subtypes (P = .0003). Patients with “normal” sL-selectin levels had higher probability of achieving complete remission (CR) than with “increased” levels: 81% versus 64%, respectively (P = .06). When adjusting for clinically relevant covariates predictive for CR (sex, age, Auer rods), “normal” sL-selectin levels were significantly associated with CR (odds ratio, 3.08; 95% confidence interval [CI], 1.10 to 8.58;P = .03). Moreover, patients with “increased” sL-selectin levels (≥3.12 μg/mL) had shorter event-free survival (EFS) (median 7.3 v 12 months, P = .008) and overall survival (median 1 v 2.05 years, P = .03) than patients with sL-selectin <3.12 μg/mL. Multivariate statistical analysis (adjusted for age and presence of Auer rods) indicated that sL-selectin was an independent prognostic factor for EFS (hazard ratio [HR], 1.96; 95% CI, 1.21 to 3.17, P = .006) and overall survival (HR, 1.80; 95% CI, 1.09 to 2.98; P = .02). Thus, plasma sL-selectin may be a useful prognostic marker in the evaluation of AML at diagnosis.
© 1998 by The American Society of Hematology.
LEUKOCYTE MIGRATION into tissues is regulated by a reaction cascade involving sequential interactions of adhesion receptors and chemokines.1-4 Adhesion receptors involved in this process include selectins, integrins, and Ig-like adhesion receptors. L-selectin mediates the initial attachment of lymphocytes to high endothelial venules of peripheral lymph nodes.1,5-8 In concert with E- and P-selectin, it regulates leukocyte migration into tissues by mediating leukocyte rolling along activated endothelium of postcapillary venules at sites of inflammation.9,10 In addition, L-selectin greatly contributes to increase leukocyte recruitment into tissues by mediating leukocyte rolling on already adherent leukocytes.11-14
L-selectin is expressed by most normal leukocytes and the majority of leukemic cells.15-18 It interacts through its amino-terminal lectin domain with mucinlike glycoproteins, sulfated heparan sulfate proteoglycans, sialylated or sulfated carbohydrates (eg, the tetrasaccharide sialyl Lewis x), and probably with other ligands.2,11,19-26 An important feature of this receptor is that it is shed from the cell surface after proteolytic cleavage within a region that links the second short consensus repeat to the transmembrane domain.16,27-30 The shed form of L-selectin (sL-selectin) was detected in normal plasma at concentrations that range from 0.6 to 3.5 μg/mL.18,31,32 We have previously observed that about 60% of patients with acute leukemia have increased levels of plasma sL-selectin.18 In these patients, successful chemotherapy rapidly lowered plasma sL-selectin, which remained normal as long as the patients remained in remission. A rapid increase in sL-selectin was noticed in relapsing patients, indicating that sL-selectin is a marker of disease activity. Moreover, elevated cerebrospinal fluid levels of sL-selectin were related to meningeal infiltration by blast cells.33 Furthermore, because cleaved L-selectin purified from patients with acute myeloid leukemia (AML) can inhibit blast cell adhesion to cytokine-activated human endothelium,18 it has been suggested that sL-selectin may regulate leukemic cell dissemination and tissue infiltration.
No information is yet available on the pathophysiological and prognostic significance of levels of sL-selectin in acute leukemia. In the study reported here, we have examined whether there was a relationship between plasma sL-selectin levels and the clinical presentation of patients with AML; we also have investigated whether there was a correlation between sL-selectin levels and disease outcome.
PATIENTS AND METHODS
Patients and plasma samples.
Heparinized plasma samples were obtained from 100 patients with newly diagnosed AML and stored at −80°C until use. Prospective selection criteria were at least a first cycle of induction chemotherapy with daunorubicin and Ara C, and availability of plasma sample before treatment. The AML samples were available from 89 patients registered in the multicenter SAKK 30/85 study and from 11 other patients off protocol seen between 1985 and 1994. Patients were treated in eight institutions (University Hospital of Lausanne, Basel, Bern, Zurich; and Cantonal Hospital of St Gallen, Fribourg, Neuchâtel, and Aarau). Control plasma samples were obtained from 80 healthy blood donors. Diagnosis and classification of AML were based on the criteria of the French-American-British (FAB) Cooperative Group and immunophenotypic studies.34,35 Diagnoses were made in each institution and reviewed by experts of the Swiss group of Clinical Cancer Research. Of the 100 patients, 52 were female and 48 were male. Their median age was 48 years, with a range between 17 and 70 years. Eighty-five patients were younger than 60. Forty-six patients had signs of extramedullary involvement (Table 1). Criteria for extramedullary disease included enlarged spleen, liver or lymph nodes, and cutaneous or mucosal infiltration by blast cells.36 Central nervous system involvement by blast cells was observed in only one patient. Therefore, the impact of this parameter could not be assessed in the evaluation of extramedullary disease. The following FAB subtypes of AML were observed: 2 M0, 7 M1, 37 M2, 5 M3, 26 M4 (4 of them were M4E), 19 M5, and 4 M6. Leukocyte counts varied widely among patients (range, 1 to 298 × 109/L; median, 26). Bone marrow (BM) was usually highly infiltrated by blast cells, the median percentage of blast cells being 90%.
All of the 100 patients enrolled in our study received a first-induction chemotherapy cycle of daunorubicin 45 mg/m2for 3 days and cytarabine 100 mg/m2 for 7 days. The 89 patients entered in the SAKK 30/85 study received a second cycle including amsacrine 120 mg/m2 and etoposide 80 mg/m2 for 5 days. Forty-five trial patients in complete (CR) or partial response (PR) were then randomized for a third cycle of chemotherapy to receive daunorubicin 45 mg/m2 for 3 days and cytarabine at either 100 mg/m2 for 7 days or 3 g/m2 twice per day for 6 days. Twenty-two of them were treated with the standard dose of cytarabine and 23 with the higher dosage. Forty-four trial patients did not receive a complete consolidation therapy because of nonremission, toxicity, or BM transplantation (BMT). In particular, 11 patients in first remission underwent allogeneic (n = 10) or autologous (n = 1) BMT.
The remaining 11 patients not enrolled in the SAKK 30/85 trial, but with frozen samples, were either treated similarly to the SAKK 30/85 protocol or received an equivalent standard chemotherapy including a first-induction chemotherapy cycle of daunorubicin and cytarabine, as requested by the study, followed by a second cycle and a consolidation therapy including cytarabine and daunorubicin or mitoxantrone.
Assay of sL-selectin.
sL-selectin was measured using a sandwich enzyme-linked immunoassay (ELISA), as previously described.18 Plasma samples were diluted at 1/200 to 1/2,000 to obtain sL-selectin concentrations in the linear range of the assay. All assays were performed simultaneously in triplicate, without knowledge of clinical outcome. sL-selectin was determined three times in each sample and results were expressed as mean values. Each ELISA plate was calibrated using a standard curve constructed using a reference plasma. sL-selectin concentration in the reference plasma was measured by using purified recombinant L-selectin/IgG heavy-chain chimeric protein as the standard.18 Similar results were obtained using our assay system18 or a commercial sL-selectin ELISA kit (Bender MedSystems, Vienna, Austria).
Statistical analysis.
There was no a priori sample size estimation. The sample size was mainly determined by availability of the blood samples when we started data analysis in May 1995. Statistical calculations show that a study of similar size would have greater than 90% power for detecting a mean difference from the controls of 1.2 μg/mL (assuming standard deviations comparable to the observed ones). With a total number of events of 70 there would be greater than 80% power to detect a hazard ratio of 2 in event-free survival (EFS) or overall survival (OS) outcome (α = .05, two-sided).
Because of the skewed distribution of selectin, we used nonparametric tests. For comparisons with literature, we showed mean and SD and added median values when relevant. The correlation between sL-selectin levels and qualitative parameters was determined using the Wilcoxon two-sample or the Kruskal-Wallis test where appropriate. Correlation between sL-selectin levels and numerical variables was determined with Spearman’s rank correlation. sL-selectin levels and leukocyte counts were analyzed both as continuous and categorical variables. The below-mentioned cut-off values were prospectively defined for selectin levels: 3.12 μg/mL (ie, ≥3 SD above the mean of the healthy group; “increased”), and for leukocyte counts: ≥30 × 109/L.
Predictive factors for remission and CR were analyzed with contingency tables and multivariate logistic regression.37 Odds ratios (OR, with 95% confidence intervals [CI] and P values [P]) were estimated with respect to the reference category for each covariate using binary variables.
EFS (time to progression or death) and OS were calculated from date of diagnosis. EFS and OS distributions were estimated using the Kaplan-Meier method and compared using the log-rank test.38,39 Standard errors were estimated using Greenwood’s formula. Univariate analysis was used to assess individual correlations with prognosis. Multivariate analysis using the Cox proportional hazard model was performed.40 A likelihood ratio test was used as an indicator of the overall significance of a marker (sL-selectin level or leukocyte counts) in addition to the model including only clinical variables.41 Hazard ratios (with 95% CI and P values) were estimated with respect to the reference category for each covariate using binary variables. Hazard ratios >1 indicated an increased risk of event compared with the appropriate reference group and vice versa for values <1.
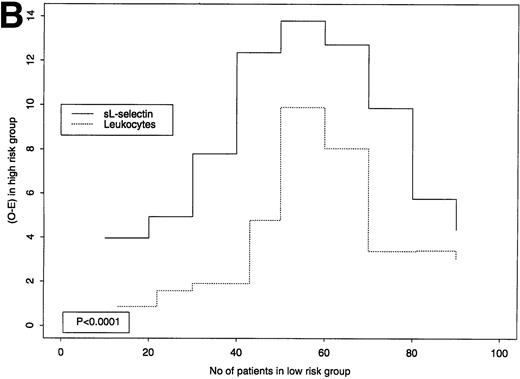
sL-selectin levels were very skewed and highly correlated with leukocyte counts (a known prognostic marker for AML). Therefore, we performed some additional evaluations to compare their prognostic value for OS and EFS. Both markers were expected to be larger for patients with high probability of early event/death than for patients with low probability of early event/death. The planned use of each marker is to identify a cut-off point and divide the patients into “good” and “poor-risk” groups. If two markers are equivalent in terms of EFS or OS in a given group at the last failure time, the total number of observed (O) events/deaths will tend to be equal to the sum of expected (E) events/deaths. The difference O-E (which is the numerator of the logrank statistic) suggests that a marker is better or worse than the other. A large difference implies that the marker discriminates well between “good” and “poor”-risk patients using the corresponding cut-off point. To assess where sL-selectin was superior to leukocyte counts, we compared the average value of the logrank statistic (O-E) for each marker over a subset of the possible cut-off points (we used 9 cut-points, each with increment of 10 cases, starting from 10 patients). Jung et al42 defined the test statistic that we used to compare these averages. The accuracy of the Pvalue depends on the sample size: it may be slightly inaccurate for sample sizes smaller than 100. The markers were also graphically compared. The aim was not to replace leukocyte counts as a prognostic marker, but to support additional assessment of sL-selectin in future studies.
All tests were two-sided. P values <.05 were considered significant.
RESULTS
Plasma sL-selectin.
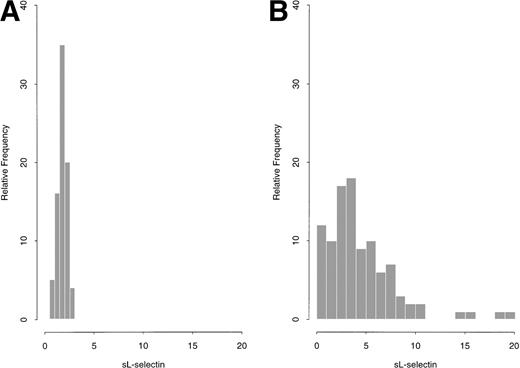
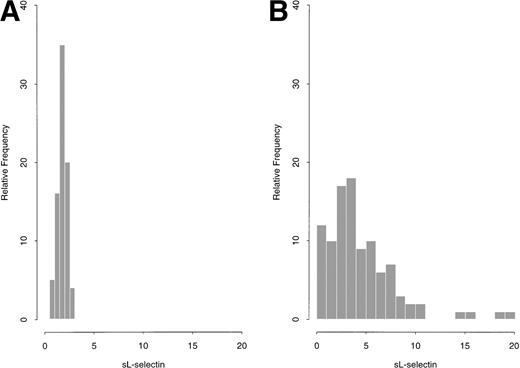
Plasma sL-selectin levels, at diagnosis, among the 100 studied patients with AML, ranged from 0.33 μg/mL to 19.81 μg/mL (mean ± 1 SD = 4.44 ± 3.57 μg/mL; median = 3.45 μg/mL). In comparison, plasma sL-selectin concentrations in a control group of 80 healthy blood donors varied from 0.63 μg/mL to 2.68 μg/mL (mean ± 1 SD = 1.77 ± 0.45 μg/mL; median = 1.8 μg/mL). A graphical summary for both AML patients and controls is shown in Fig1A and B. Although in controls the sL-selectin distribution was approximately normal, it was very skewed for AML cases. Levels ≥3.12 μg/mL (ie, ≥3 SD above the mean of the control group) were observed in 58 patients with AML (58%), which were prospectively defined as having “increased” sL-selectin values.
(A and B): sL-selectin values (μg/mL) in 80 healthy donors (A) and 100 patients with AML (B).
(A and B): sL-selectin values (μg/mL) in 80 healthy donors (A) and 100 patients with AML (B).
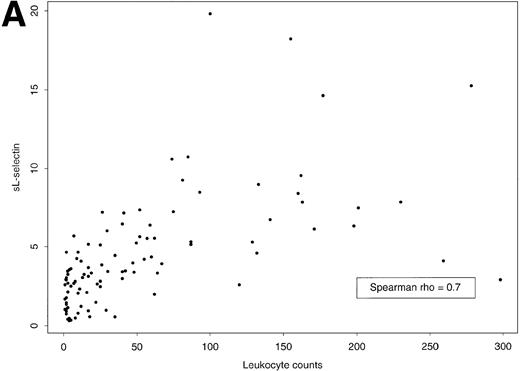
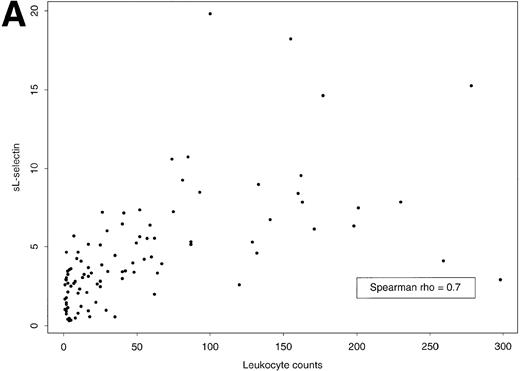
Plasma sL-selectin levels reflected the total mass of leukemic cells (not illustrated). Indeed, a significant correlation was observed between plasma sL-selectin levels and the number of blood leukocytes (Fig 2A) or blast cells (rs = .70, P < .0001 for both). A positive correlation was also observed between sL-selectin levels and the fraction of blast cells in the BM (rs = .40,P = .0001). In contrast, no relationship was noticed between sL-selectin and hemoglobin (rs = −.07) or between sL-selectin and platelet counts (rs = −.08), an observation that is not surprising because L-selectin is not expressed by platelets and erythrocytes.
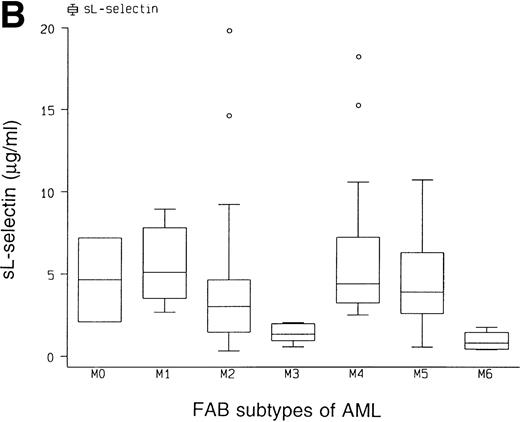
(A) Scatter plot of plasma sL-selectin concentrations (μg/mL) and leukocyte counts (×109/L) and (B) box plots of plasma sL-selectin concentrations (μg/mL) by FAB classification of AML. The box extends from the 25th to the 75th percentile, and the line in the middle represents the median. The lines emerging from the box extend to the upper and lower adjacent values. More extreme points are individually plotted.
(A) Scatter plot of plasma sL-selectin concentrations (μg/mL) and leukocyte counts (×109/L) and (B) box plots of plasma sL-selectin concentrations (μg/mL) by FAB classification of AML. The box extends from the 25th to the 75th percentile, and the line in the middle represents the median. The lines emerging from the box extend to the upper and lower adjacent values. More extreme points are individually plotted.
Interestingly, sL-selectin levels were significantly heterogeneous in the FAB subtypes (Kruskal-Wallis test: P = .0003, Fig 2B). In particular, the median concentrations observed in the respective subgroups were as follows: M0 (n = 2), 4.64 μg/mL; M1 (n = 7), 5.10 μg/mL; M2 (n = 37), 3.03 μg/mL; M3 (n = 5), 1.34 μg/mL; M4 (n = 26), 4.39 μg/mL; M5 (n = 19), 4.44 μg/mL; and M6 (n = 4), 0.80 μg/mL.
Because of the skewed distribution of sL-selectin, the apparent (nonsignificant) higher level observed in patients younger than 40 (Table 1) has to be interpreted with caution, because the median selectin value was 3.4 in both age groups, and no correlation (rs =.05) was observed between age and selectin.
Correlation between sL-selectin level and the presence of extramedullary disease.
Previous work has shown that sL-selectin can inhibit the L-selectin–dependent adhesion of blast cells to vascular endothelium in vitro, an observation consistent with the idea that sL-selectin may participate in the regulation of the migration of L-selectin+ leukemic cells in vivo.18 To examine this possibility, we determined whether patients with increased plasma sL-selectin levels had a different clinical presentation than patients with normal concentrations of the soluble adhesion receptor. A positive correlation between the presence of extramedullary disease and levels of plasma sL-selectin was observed (Table 1). As shown in Table1, patients with organomegaly, cutaneous, or mucosal infiltration had higher plasma sL-selectin levels than patients without these features (5.54 ± 3.9 μg/mL [n = 52] v 3.44 ± 3.0 μg/mL [n = 46]; P = .001), with the highest sL-selectin levels being found in patients with adenopathies (6.80 ±3.3 μg/mL), splenomegaly (7.24 ± 5.1 μg/mL), or hepatomegaly (6.13 ± 3.8 μg/mL).
Prognostic value of sL-selectin in AML.
As specified in Patients and Methods and earlier in the Results, the 100 patients with AML described in this study were prospectively divided into two groups according to their plasma sL-selectin level. The cut-off level was set at 3.12 μg/mL, a value equal to the mean of the level in the healthy blood donor control group + 3 SD. In patients with AML, sL-selectin values lower than the cut-off level were considered “normal,” whereas values at the cut-off level or higher were considered “increased.” sL-selectin was “increased” in 58 patients with AML and “normal” in 42. It should be emphasized that these two groups were well balanced with respect to received treatment. Notably, the proportion of patients who received a standard (24% v 21%) or high dose (24% v22%) of cytarabine, or underwent BMT (12% v 10%), was similar in the two groups with “increased” or “normal” values, respectively.
sL-selectin was not correlated with age or the absence of Auer rods, two parameters associated in several studies with a poor prognostic impact on survival.43-45 sL-selectin concentrations were similar among patients younger or older than 60 (4.49 ± 3.8 μg/mL [n = 85] v 4.15 ± 1.9 μg/mL [n = 15]), and similar sL-selectin levels were detected in patients with blast cells with Auer rods and in those who did not exhibit this abnormality (3.85 ± 3.2 μg/mL [n = 42] v 4.91 ± 3.8 μg/mL [n = 57]).
Seventy-one of the 100 patients achieved a CR, 11 had PR, and 18 had no change or progression. Table 2 shows the CR rates by selectin levels and the clinically relevant covariates predictive for CR (sex, age, and Auer rods) identified in the main study.36 Patients with “increased” sL-selectin had lower remission rate, compared with the ones with “normal” sL-selectin (64% v 81%, P = .06). Lower leukocyte counts were associated with higher probability of CR compared with higher leukocyte counts (78% v 62% respectively, P = .08). When adjusting for the above-mentioned clinically relevant covariates predictive for CR (sex, age, and Auer rods) identified in the main study, “normal” sL-selectin levels were confirmed to be significantly associated with achievement of CR (OR, 3.08; 95% CI, 1.10 to 8.58; P = .03). Leukocyte counts (continous or categorical variables) did not significantly contribute to the model with clinical covariates alone.
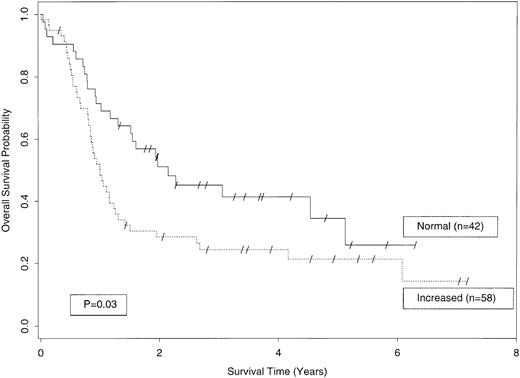
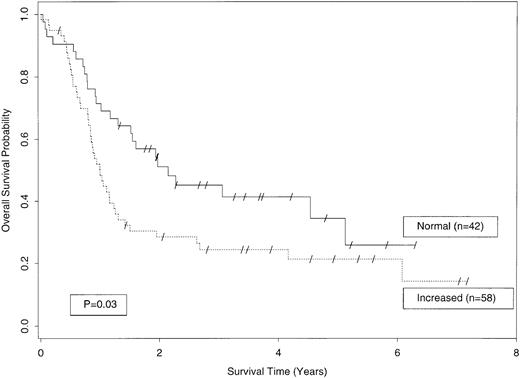
The probabilities of OS and EFS in patients with AML according to their plasma sL-selectin level are illustrated in Figs 3 and 4. Patients with “increased” sL-selectin (≥3.12 μg/mL, n = 58) had a significantly shorter OS than patients with “normal” plasma levels of this marker (n = 42). As shown in Fig3, the median OS among patients with “increased” sL-selectin was only 49% of the median survival of patients with “normal” sL-selectin levels (1 v 2.05 years; hazard ratio [HR], 1.70; 95% CI, 1.04 to 2.79; P = .03; Fig 3). The increased survival of patients with “normal” sL-selectin levels was still present after 3 (45% ± 8% [±SE] v 24% ± 6%) and 5 years (34% ±10% v 21% ± 6%; Fig 3).
OS among AML patients with “normal” plasma sL-selectin levels (<3.12 μg/mL; n = 42; continuous line) or “increased” sL-selectin levels (≥3.12 μg/mL; n = 58; dotted line; P = .03).
OS among AML patients with “normal” plasma sL-selectin levels (<3.12 μg/mL; n = 42; continuous line) or “increased” sL-selectin levels (≥3.12 μg/mL; n = 58; dotted line; P = .03).
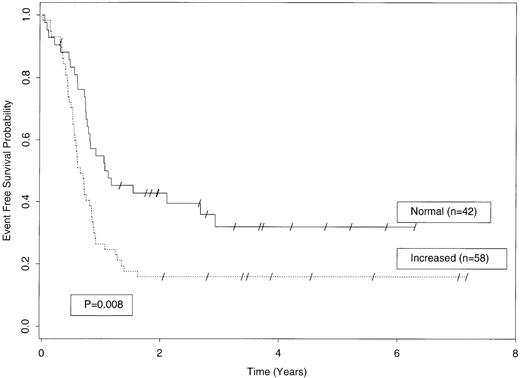
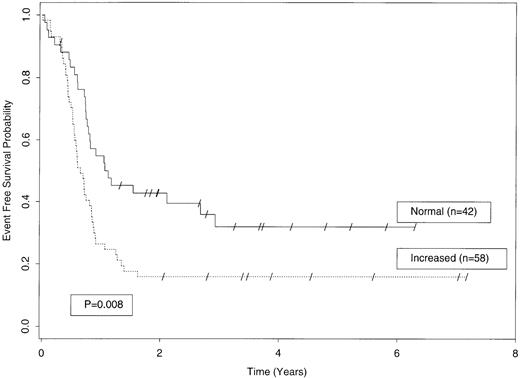
EFS among AML patients with “normal” plasma sL-selectin levels (<3.12 μg/mL; n = 42; continuous line) or “increased” sL-selectin levels (≥3.12 μg/mL; n = 58; dotted line; P = .008).
EFS among AML patients with “normal” plasma sL-selectin levels (<3.12 μg/mL; n = 42; continuous line) or “increased” sL-selectin levels (≥3.12 μg/mL; n = 58; dotted line; P = .008).
Like the OS, the EFS was adversely affected by the presence of “increased” plasma sL-selectin levels (Fig 4). Univariate analysis showed that patients with “increased” sL-selectin levels had a significantly shorter EFS than patients with “normal” sL-selectin levels (7.3 v 12 months; HR, 1.89; 95% CI, 1.18 to 3.04; P = .008). Three years after first remission, 32% ± 8% of patients with “normal” sL-selectin levels were still in remission compared with only 16% ± 5% of patients with “increased” sL-selectin. The reciprocal relationship between “increased” sL-selectin and EFS was still present at 5 years (Fig4).
Other clinical and biological parameters significantly related to a longer OS included the presence of Auer rods (median, 2 v 1.1 year; HR, 0.55; P = .02) and age less than 40 (median, 3.3v 1.2 years; HR, 1.93; P = .03). No significant relationship was observed between the OS and leukocyte count, either continuous (P = .45) or categorical (P = .15), a parameter highly correlated with sL-selectin.
The independence of the effect of sL-selectin on OS was evaluated using the Cox proportional hazards model in the presence of age and Auer rods. The HR for death in patients with “increased” plasma sL-selectin levels was 1.80 (95% CI, 1.09 to 2.98; P = .02). As expected, the HR was higher than 1 in patients older than 40 (HR, 1.97; 95% CI, 1.08 to 3.57; P = .03). The presence of Auer rods was also an independent parameter (HR, 0.54; 95% CI, 0.32 to 0.89; P = .02).
The prognostic value of sL-selectin as continuous marker (added to the clinical covariates) was confirmed (P = .03). Leukocyte counts (continuous or categorical) were not significantly contributing to the model with clinical covariates alone.
In univariate analysis of EFS, the significant advantage on survival conferred by younger age or the presence of Auer rods was not present. A significant association was observed between higher leukocyte counts (>30 × 109/L) and a shorter EFS (median, 6.7v 10.9 months; HR, 1.79; P = .01). Leukocyte counts, as continuous marker, were not significantly associated with EFS (P = .27). Leukocyte counts were confirmed as a significantly independent parameter for EFS (HR, 1.73; 95% CI, 1.09 to 2.76;P = .02) in a Cox model adjusted for age and Auer rods.
When the Cox model (adjusted for age and Auer rods) was applied for sL-selectin, “increased” plasma level was confirmed as a significantly independent parameter (HR, 1.96; 95% CI, 1.21 to 3.17;P = .006). Neither the presence of Auer rods (HR, 0.64; 95% CI, 0.40 to 1.03; P = .07) nor an age younger than 40 (HR, 1.39; 95% CI, 0.82 to 2.38; P = .22) were significant independent parameters.
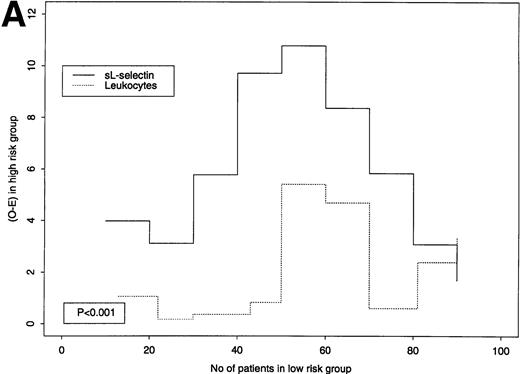
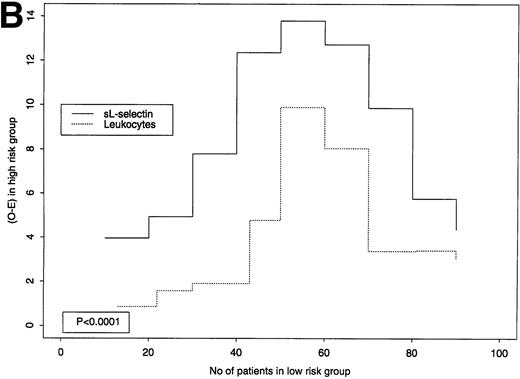
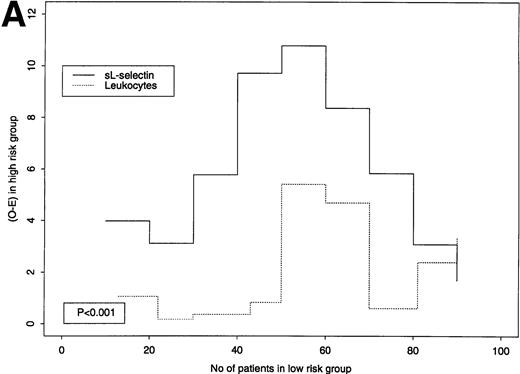
sL-selectin levels had a very skewed distribution and were highly correlated with leukocyte counts. Higher prognostic relevance of sL-selectin was clear in terms of OS, and less so for EFS. Therefore, we explored where sL-selectin levels showed a better prognostic value, in terms of OS and EFS, for different cut-off points (Fig 5A [OS] and B [EFS]). A large value on the y-axis implies that each marker discriminates well between “high-” and “low-risk” patients using the respective cut-off point. As an example, for EFS, at the third cut-off point (2.6 μg/mL for sL-selectin, 9 × 10⁹/L for leukocytes), the O-E value of the logrank test was 7.78 for sL-selectin and 1.91 for leukocytes (see Fig 5B). As can be seen from the graphical comparison shown in Fig 5A and B, plasma sL-selectin defines subgroups with higher risk differences than leukocyte counts at each of the tested cut-off levels for both EFS (P < .0001) and OS (P < .001). Thus, plasma sL-selectin was homogeneously superior to leukocytes in classifying patients. A better cut-off point identified in this sample may be a plasma sL-selectin concentration of 3.45 μg/mL. Because estimates such as this are quite variable from study to study, the above-mentioned cut-off value requires confirmation, with specific prestated hypotheses and adequate sample size, in future prospective evaluations of sL-selectin in AML.
(A and B): Predictive value of sL-selectin or leukocyte count for OS (A) or EFS (B). The x-axes indicate the number of patients that would be classified in the low-risk group for a certain cut-point (we used 9 cut-points, each with increment of 10 cases, starting from 10 patients). Because of ties in the leukocyte values, the first groups contain slightly more or less than 10 cases. On the y-axes, logrank statistic numerators (O-E) for these 9 cut-points for sL selectin (continuous line) and leukocyte (dotted line) where the outcome is OS (A) and EFS (B). The left part of each graph represents cut-points that classify few people in a good-risk and many in a poor-risk group. The right part of each graph represents cut-points that classify many people in a good-risk and few in a poor-risk group. A large value on y-axes implies that the marker discriminates well between good- and poor-risk patients using the respective cut-off point. As the graphs indicate, sL-selectin was superior to leukocyte counts in prognostic value for all 9 cut-offs for OS (P = .001) and EFS (P= .0001).
(A and B): Predictive value of sL-selectin or leukocyte count for OS (A) or EFS (B). The x-axes indicate the number of patients that would be classified in the low-risk group for a certain cut-point (we used 9 cut-points, each with increment of 10 cases, starting from 10 patients). Because of ties in the leukocyte values, the first groups contain slightly more or less than 10 cases. On the y-axes, logrank statistic numerators (O-E) for these 9 cut-points for sL selectin (continuous line) and leukocyte (dotted line) where the outcome is OS (A) and EFS (B). The left part of each graph represents cut-points that classify few people in a good-risk and many in a poor-risk group. The right part of each graph represents cut-points that classify many people in a good-risk and few in a poor-risk group. A large value on y-axes implies that the marker discriminates well between good- and poor-risk patients using the respective cut-off point. As the graphs indicate, sL-selectin was superior to leukocyte counts in prognostic value for all 9 cut-offs for OS (P = .001) and EFS (P= .0001).
DISCUSSION
An important challenge in the management of acute leukemia is to distinguish patients at high risk of relapse who may benefit from high-dose chemotherapy followed by BMT from patients in whom such treatments can be delayed. Cell counts, cytogenetic abnormalities, age, immunophenotypic characteristics, or the presence of Auer rods are well-accepted prognostic factors in AML.43-52 In this study, we showed that increased plasma level of sL-selectin, a circulating adhesion molecule, is a factor of poor prognosis in AML. Patients with “increased” sL-selectin levels had a poorer OS with a higher risk of death (HR, 1.80; P = .02) than patients with “normal” levels of sL-selectin. In addition, these patients had a poorer EFS and were at higher risk for events such as relapse or death (HR, 1.96; P = .006). Interestingly, high sL-selectin levels had an adverse effect on the achievement of complete remission, a highly predictive factor of survival (Table 2).46 53
sL-selectin was clearly correlated with the EFS and OS of the studied AML patients (Figs 3 and 4). Of particular interest is the observation that the curves flattened and remained separated after 2 to 3 years, suggesting a real prognostic value for sL-selectin. On multivariate analysis, sL-selectin was outweighing such a well-accepted prognostic factors as Auer rods in the prediction of OS and EFS.43,44,46-48 As reported by others, age was not significantly associated with EFS.45,53 In terms of relevance for EFS, multivariate analysis indicated that sL-selectin was only preceded by the achievement of a CR, a well-known highly predictive prognostic factor in AML.46 53
Plasma sL-selectin levels were strongly correlated with blood leukocyte and peripheral blast cell counts, as well as the percentage of marrow leukemic blasts. This suggests that, in patients with increased sL-selectin levels at diagnosis, plasma sL-selectin may be a better indicator of the total tumor mass than the above-cited parameters. However, the negative correlation between sL-selectin and survival could be related to additional biological effects of sL-selectin. This is suggested by the observation that patients with hyperleukocytic leukemia (leukocytes > 30 × 109/L) and normal plasma levels of sL-selectin had a much better prognosis than the same category of patients with increased sL-selectin values. As illustrated by Fig 5A and B, sL-selectin had a homogeneously better prognostic value than leukocyte counts for both EFS (P < .001) and OS (P < .001). This suggests that increased sL-selectin levels and high cell counts define different patient subgroups. In addition, statistical analysis showed that the adverse effect of sL-selectin level on OS (HR, 1.96; 95% CI, 1.01 to 3.79) and EFS (HR, 1.7; 95% CI, 0.89 to 3.25) was more important in patients with increased plasma levels of sL-selectin and leukocyte counts <30 × 109/L than in the same category of patients with leukocyte counts ≥30 × 109/L (HR, 1.13; 95% CI, 0.33 to 3.85 for OS; and HR, 1.32; 95% CI, 0.4 to 4.35 for EFS). These results suggest that the poorer EFS and OS of patients with increased sL-selectin levels may be related to a more “aggressive” biological behavior of blast cells, which leads to early relapse.
Residual leukemic cells after intensive chemotherapy can remain dormant for several months or years and be at the origin of leukemia relapse.54-56 Complex interactions between residual leukemic cells, stroma, extracellular matrix components of stroma, and hematopoietic cells play a critical role in determining the fate of residual blast cells surviving after intensive chemotherapy.57 The mechanisms by which the shedding of high levels of L-selectin by blast cells could favor the survival of residual blast cells and subsequent leukemia relapse has not yet been elucidated. A possibility could be that the shed form of L-selectin may directly or indirectly interfere with the programmed cell death of leukemic cells. Indeed, several lines of evidence suggest that adhesion-mediated signals are involved in the control of cell-cycle progression and that cells which are not anchored in a proper fashion can undergo apoptosis.58 59 Alternatively, locally increased concentrations of sL-selectin could protect blast cells from immune surveillance by interfering with lymphocyte homing or inhibiting interactions of cytotoxic lymphocytes with leukemic cells.
A strong correlation was observed between sL-selectin levels and the presence of extramedullary disease. This observation suggests that blast cells which shed high levels of L-selectin have a higher propensity to migrate into lymph nodes, spleen, or liver. L-selectin plays a major role in regulating lymphocyte attachment to high endothelial venules of peripheral and mesenteric lymph nodes.1,5-8 The following scenario can be proposed to explain the frequent presence of lymphadenopathies and splenomegaly in AML patients with increased sL-selectin levels. Initially, when the tumor burden is low and plasma sL-selectin levels are still in the normal range, L-selectin+ leukemic cells may bind to high endothelial venules via the uncleaved adhesion receptor, migrate, and proliferate into peripheral lymph nodes. Then, following the constant shedding of L-selectin from blast cell surface, sL-selectin level progressively increases to reach concentrations that inhibit the L-selectin–dependent attachment of blast cells.18 The inhibition of blast cell adhesion to vascular endothelium may divert blast cells to L-selectin–independent homing sites. Such a mechanism could promote spleen infiltration by blast cells. Mention should be made that a similar scenario has been observed for naive CD4+ T cells in mice treated with the adhesion-blocking anti–L-selectin monoclonal antibody (MoAb) MEL-14. In this model, MEL-14 MoAb inhibited CD4+/L-selectin+lymphocyte migration into peripheral lymph nodes and diverted lymphocyte migration to the spleen.60 The proliferation of blast cells into the spleen will lead to a progressive enlargement of this organ. Similarly, leukemic cells that had initially migrated into lymph nodes will continue to proliferate and may induce the development of lymphadenopathies. However, because leukocyte migration is dependent on multiple adhesion receptors, chemokines, and cytokines, it is likely that additional, yet undefined mechanisms, could cooperate with L-selectin and its shed form to regulate blast cell homing in extramedullary tissues.
Multivariate statistical analysis confirmed that increased plasma sL-selectin level was associated with a shorter survival. It is unlikely that a treatment-related effect could have had a major role in patient response to therapy because treatments were well-balanced between patients with normal or increased sL-selectin levels. Notably, the number of patients who received intensive consolidation therapy was similar in the two groups. Therefore, sL-selectin could be a new powerful prognostic parameter in AML, both in terms of EFS and OS. However, its prognostic relevance needs to be validated in a larger prospective study.
Our ability to predict the outcome of patients with AML needs to be improved. This is especially true at the time of diagnosis, when decisions such as choosing the induction regimen, or inclusion in a study and stratification, need to be taken. Karyotype determination and assessment of initial marrow response often take several weeks. In contrast, levels of sL-selectin can be obtained rapidly by ELISA. A need for prognostic factors is emphasized by the fact that certain consolidation regimens such as multiple cycles of high-dose cytarabine or BMT are highly toxic and are not beneficial to all patients.47 61-63 For these reasons, the measurement of plasma sL-selectin level at diagnosis strongly deserves further exploration in the prognostic evaluation of AML.
ACKNOWLEDGMENT
The authors are grateful to Dr Paul Pugin (Hôpital cantonal de Fribourg, Switzerland), the staff of the Centre de Transfusion Sanguine in Lausanne, the Central Laboratory of Hematology in Lausanne, and the Swiss Group for Clinical Cancer Research (SAKK, Bern, Switzerland) for patient data and plasma samples collection.
Supported by Grant No. 31-43235.95 from the Swiss National Foundation for Scientific Research, the Henri Dubois-Ferrière Dinu Lipatti Foundation, and the Swiss Research Against Cancer Foundation.
Address reprint requests to O. Spertini, MD, Division of Hematology, University of Lausanne, BH 18-543, 1011-CHUV Lausanne, Switzerland.
The publication costs of this article were defrayed in part by page charge payment. This article must therefore be hereby marked "advertisement" is accordance with 18 U.S.C. section 1734 solely to indicate this fact.

