Abstract
We studied in patients with hairy cell leukemia (HCL) whether autoreactive T cells could be isolated with specific reactivity to the HCL cells. HCL cells were activated via triggering of CD40 on the cell membrane and used as stimulator cells to generate autologous T-cell clones. Two types of CD4+BV2+ T-cell clones with different CDR3 rearrangements and one type of CD4+BV8S3+ T-cell clone were generated from the spleen or blood. These clones specifically recognized the autologous HCL cells, without reactivity to autologous peripheral blood mononuclear cells (PBMC), phytohemagglutinin blasts, or Epstein-Barr virus–transformed B cells in a primed lymphocyte test. Blocking and panel studies using HCL cells from 11 other patients showed that recognition of the HCL cells by the BV2+ T cells was restricted by HLA-DQA1*03/DQB1*0301, and the BV8S3+ T cells were restricted by DPB1*04. The T-cell clones did not recognize DPB1*04+ or DQ3+ PBMC from healthy donors or DP/DQ matched malignant cells from patients with other hematologic malignancies, except for one patient with acute lymphoblastic leukemia. These HCL-specific T-cell clones may be used for the detection of an HCL-specific tumor antigen.
HAIRY CELL LEUKEMIA (HCL), a chronic B-cell malignancy comprised by mature neoplastic B cells with hairy protrusions, is characterized by splenomegaly caused by the HCL cells which home to and accumulate in the spleen. The HCL cells are also found in the bone marrow, and at later stages of the disease they appear in the peripheral blood.1 Patients with HCL suffer from opportunistic infections2 caused by pancytopenia and a T-cell–related immune deficiency.3,4 Signs of abnormal T-cell activation and distribution have been found in the HCL spleens compared with normal spleens.5-7 Splenic T cells from patients with HCL show spontaneous cytokine gene expression of interleukin-2 (IL-2), IL-4, granulocyte/macrophage-colony stimulating factor (GM-CSF), and interferon-γ (IFN-γ),5 and a reversed CD4/CD8 ratio.5 Recently, we demonstrated that T lymphocytes from blood and spleen of most HCL patients are clonally expanded and show a restricted and skewed repertoire of the T-cell receptor-β family (TCRBV).8 Besides clonal excess of certain T cells, several TCRBV families were weakly expressed or even absent.8 In part, these findings may explain the immune deficiency and lack of tumor surveillance in patients with HCL. We hypothesized that T cells with specific activity to the HCL cells exist in vivo, but are in an anergic state9,10 or are probably suppressed by the tumor cells. It may be possible to expand these T cells more optimally in vitro by using activated HCL cells, which are triggered via the CD40 antigen to upregulate expression of adhesion and costimulatory molecules important for the completion of an effective immune response.11 12 To test this hypothesis, we analyzed whether T cells capable of recognizing autologous HCL cells could be isolated from patients.
In this study, we show that multiple leukemia-reactive CD4+T-cell clones with different TCRBV expression that specifically recognized autologous HCL cells in HLA-DQ and HLA-DP restricted ways could be generated.
MATERIALS AND METHODS
Patients and cell samples.
The diagnosis HCL of patient A was confirmed by histology of the spleen and bone marrow, cytomorphology, and immunophenotyping (reactivity with monoclonal antibodies [MoAbs] against CD11c, CD19, CD25, CD103, and expression of monotypic immunoglobulins). In 1991 a therapeutic splenectomy had been performed, and seven months after splenectomy, IFN-α therapy was started because of granulocytopenia and thrombocytopenia. After 24 months, he obtained a partial hematologic remission with a normalization of the blood counts and a reduction of circulating HCL cells from 90% to 2%. HLA class I and II typing of patient A was performed by standard serology methods and HLA-DR/DQ and HLA-DP typing by DNA analysis using sequence-specific primers (SSP) and sequence-specific oligos (SSO). The HLA type was class I: A2 A28, B44 (B12) B60 (B40), Cw10 Cw5; class II: DRB1*04 DQA1*03 DQB1*0301 (homozygous), DPB1*0101 DPB1*0402.
After informed consent, mononuclear light density cells were isolated from the spleen by gentle mechanical disruption, washing, and Ficoll-Isopaque (1.077 g/mL) density gradient centrifugation. Peripheral blood lymphocytes (PBL) were obtained both during active disease and during remission of the disease 2 years after IFN-α therapy was started. Peripheral blood mononuclear cells (PBMC) were isolated by Ficoll density cell separation. The cells were cryopreserved in 10% dimethylsulfoxide and thawed directly before use.
Cryopreserved spleen samples from 11 other HCL patients (B-L) were used. PBL or bone marrow samples were obtained from patients with B-cell chronic lymphocytic leukemia (B-CLL, n = 1), B-cell lineage acute lymphoblastic leukemia (ALL, n = 5), acute myeloid leukemia (AML, n = 2), chronic myeloid leukemia (CML, n = 4) and non-Hodgkin’s lymphoma (NHL, n = 1). All samples contained 80% to 95% malignant cells. As controls, PBL or bone marrow samples from 3 healthy donors were used. HLA class II typing of all samples was performed by standard serology and SSP/SSO DNA methods.
Activation of HCL cells using the CD40 ligand system.
To activate HCL cells, 3T6 mouse fibroblast cells transfected with human CD40 ligand (CD40L) were used.13 In a fully humidified atmosphere containing 5% CO2 for 7 or 8 days, 5 × 10⁵ HCL cells were cocultured with 5 × 10⁴ irradiated (70 Gy) 3T6 cells/well in a 24-well plate in a final volume of 2 mL complete medium. Complete culture medium consisted of Iscove’s modified Dulbecco’s medium (IMDM; Bio-Whittaker, Verviers, Belgium), 5% heat-inactivated fetal calf serum (FCS), penicillin/streptomycin (20 U/mL and 20 μg/mL, respectively), 10 U/mL nystatin (Sanofi, Maassluis, The Netherlands), 3 U/mL polymyxin B (Pfizer, Capelle a/d IJssel, The Netherlands), 20 μg/mL kanamycin (Gist Brocades, Delft, The Netherlands), 5 μg/mL bovine insulin (Sigma Chemical Co, St Louis, MO), 0.5% human serum albumin (CLB, Amsterdam, The Netherlands), 45 μg/mL human transferrin (Boehringer, Mannheim, Germany), and 0.01 mmol/l beta-mercaptoethanol (Sigma). To analyze the expression of adhesion and costimulatory molecules, the HCL cells from five patients were labeled using the following fluorescein isothiocyanate (FITC)- or phycoerythrin (PE)-labeled MoAbs: CD19 (leu-12), CD11c (leu-M5), CD11a (LFA-1α), CD54 (leu-54), CD58 (LFA-3), CD80 (B70/B7-1), CD86 (B70/B7-2), pan HLA class I (W6.32), and HLA-DR from Becton Dickinson (San Jose, CA). CD40 (MoAb 89; Schering Plough, Dardilly, France) and CD72 (MCA 687; Serotec, Oxford, UK) were used as first-step unconjugated MoAbs followed by a conjugated isotype-specific goat-anti-mouse (GAM)-FITC antibody. The data are expressed as fluorescence intensity in arbitrary units.
Generation of HCL-reactive T-cell lines.
Two different methods were used to generate HCL-reactive T-cell lines. Using the first method, the autologous T cells and the HCL cells, both derived from the spleen, were cultured together in the CD40L system. In the second method, HCL cells were first activated in the CD40L system, isolated, irradiated, and added as stimulator cells to autologous PBMC obtained during hematologic remission.
Spleen-derived T-cell lines.
To generate HCL-reactive T-cell lines, the spleen suspension consisting of 96% HCL cells and 4% T cells from HCL patient A was added at a concentration of 5 × 10⁵ cells/well to the CD40L system. After 7 days of culture and weekly thereafter, the complete medium was demi-refreshed and IL-2 (Roussel Uclaf, Paris, France) was added at a final concentration of 100 U/mL. From day 40 on, the cell cultures were weekly demi-refreshed using RPMI 1640 with 10% pooled human serum prescreened for human immunodeficiency virus, HBs Ag, and allo-antibodies (Red Cross Bloodbank Leidsenhage, Leiden, The Netherlands) and IL-2. T-cell cultures obtained were phenotyped, and tested for cytotoxicity in a 51Cr-release assay as described14 and specific proliferation in a3H-thymidine assay as described below. On day 71, the T-cell line that showed specific proliferation in the primed lymphocyte test (see below) was restimulated with autologous HCL cells. The T cells were further expanded by restimulation with autologous HCL cells once every 2 to 3 weeks and cloned by limiting dilution (see below).
PBL-derived T-cell lines.
To generate HCL-reactive T-cell lines from the blood, HCL cells activated in the CD40L system were used as irradiated (25 Gy) stimulator cells, and added (1.5 × 10⁶ cells/well) to autologous PBMC (5 × 10⁵ cells/well) obtained during hematologic remission in a 24-well plate. After 7 days of culture using RPMI 1640 with 10% pooled human serum (2 mL/well) and weekly thereafter, the cell cultures were restimulated with autologous activated HCL cells (106 cells/2 mL), demi-refreshed, and IL-2 was added at a final concentration of 100 U/mL. Eleven wells with growing T cells from the 24-well plate obtained were tested for cytotoxicity in a 51Cr-release assay as described.14
Limiting dilution assay.
T-cell lines were further cloned by limiting dilution. T cells (1 to 0.3 cells/well) were added to autologous activated HCL cells (104 cells/well) in 96-well microtiter plates containing RPMI with 10% pooled human serum and IL-2 (100 U/mL). After 3 to 4 weeks, T cells were isolated from wells that showed proliferation and further expanded by restimulation with autologous HCL cells in RPMI with 10% pooled human serum and IL-2 once every 3 weeks.
Primed lymphocyte test (PLT).
Before use, stimulator cells were thawed and incubated in RPMI with 10% pooled human serum at 37°C overnight. As controls, autologous PBMC during hematologic remission were used, autologous phytohemagglutinin (PHA) blasts, or Epstein-Barr virus–transformed autologous B cells (EBV-lymphoblastoid cell line [EBV-LCL]). An EBV-LCL was established by in vitro transformation of 107spleen cells and further cultured in RPMI with 10% human serum. PHA blasts were generated by culturing PBMC obtained during hematologic remission with PHA (0.8 μg/mL) for 3 days and further culture in medium containing IL-2 (100 U/mL). Responder T cells (104cells/well) and irradiated stimulator cells (PHA blasts, PBMC, leukemic cells at 105 cells/well, or EBV-LCL at 2.5 × 10⁴ cells/well) were cocultured in a 96-well microtiter plate at a final volume of 150 μL/well in RPMI containing 10% pooled human serum. After 72 hours, 3H-thymidine (1 μCi/well) was added to the cultures. After 18 hours, the cells were obtained with an automatic microharvester, and counts per minute (cpm) were determined on a liquid scintillation spectrometer. As control for background 3H-thymidine incorporation, responder and stimulator cells cultured separately were used. All PLT were performed in sixfold, from which the mean and standard deviation (SD) were determined.
To determine the restriction of the recognition of the stimulator cells by the T cells, blocking studies were performed. Responder T cells were preincubated with saturating concentrations of CD4 or CD8 MoAbs (RIV6 and FK18, respectively) for 15 minutes,15,16 or stimulator cells were preincubated with MoAbs against pan-HLA class I (W6.32 or B9.12.1),17 pan-HLA class II (PdV5.2),18 HLA-DR (B8.11.2), HLA-DQ (SPVL3), or HLA-DP (B7.21).
Immunophenotyping.
The phenotypes of the generated T-cell lines were analyzed by flow cytometry (FACscan; Becton Dickinson, Mountain View, CA). Two-color fluorescence was used with the following FITC- or PE-labeled MoAbs: CD3 (leu-4), CD4 (leu-3a), CD8 (leu-2a), TCR-α/β (WT31), TCR-γδ-1 (11F2), CD25 (anti-IL2-R), CD28 (leu-28) from Becton Dickinson, and CD45RO (UCHL 1; Dako, Glostrup, Denmark). To analyze the expression of HLA-DQ and HLA-DP on the different stimulator cells, SPVL3 and B7.21 were used as a first-step unconjugated MoAb, respectively, followed by a conjugated GAM-FITC antibody. Only viable cells were analyzed using LDS 751.19
To determine the TCRBV protein expression of the T-cell lines and clones, TCRBV-specific MoAbs were used. All MoAbs have been described previously.20 For the first screening, pools consisting of several MoAbs were used. When a pool of MoAbs showed positive staining, the appropiate individual MoAbs were tested.
TCRBV–polymerase chain reaction (PCR).
Total RNA was isolated with Trizol (GIBCO-BRL, Gaithersburg, MD) according to the manufacturer’s procedure, and if necessary, glycogen was used as carrier. cDNA was prepared from samples of 1 to 2 μg RNA each (derived from at least 0.5 to 1 × 10⁶ T cells) using M-MLV BRL reverse transcriptase (GIBCO-BRL) for 60 minutes at 37°C as described.21 An aliquot of each cDNA reaction was individually amplified using a mixture of TCRBV family–specific primers or a single BV-specific primer and a Cβ primer. All primers have been described previously,8 21-23 except for the TCRBV8 primer (5′-CCATGATGCGGGGACTGGAGTTGC-3′). Each 50-μL PCR reaction contained cDNA in 10 mmol/L TrisHCl, pH 8.4; 50 mmol/L KCl; 1.5 mmol/L MgCl2; 20 μg/mL bovine serum albumin; 20 pmol of TCRBV family–specific primers and the C primer; 50 μmol/L dNTPs; 20Pm [α-32P]dCTP (3,000 Ci/mmol/L; Amersham, Arlington Heights, IL); and 1.25 U Taq DNA polymerase. The amplification was started with a denaturation step of 4 minutes at 94°C, followed by 25 to 30 cycles, each cycle consisting of subsequently 1 minute at 94°C, 56°C, and 72°C. Length of CDR3 products was determined by denaturing polyacrylamide gel electrophoresis gels. After electrophoresis, amplified DNAs were visualized by autoradiography.
The following clone-specific primers for the CDR3 region with a four nucleotide overlap with the TCRBV and TCRBJ genes were designed: TCRN4F10, GTCTCCAGACCTAGTGGGC; TCRN1F2, TCCCCCCCCTGGTTTGCAC; TCRNBV8S3, CTTCCCCCTGTCCAGGACC. PCR-amplification was performed using these specific primers in combination with the TCRBV-specific primers.
Cytokine mRNA expression was analyzed by reverse transcriptase-PCR using cytokine specific primers as described.5
RESULTS
Activation of HCL cells using the CD40L system.
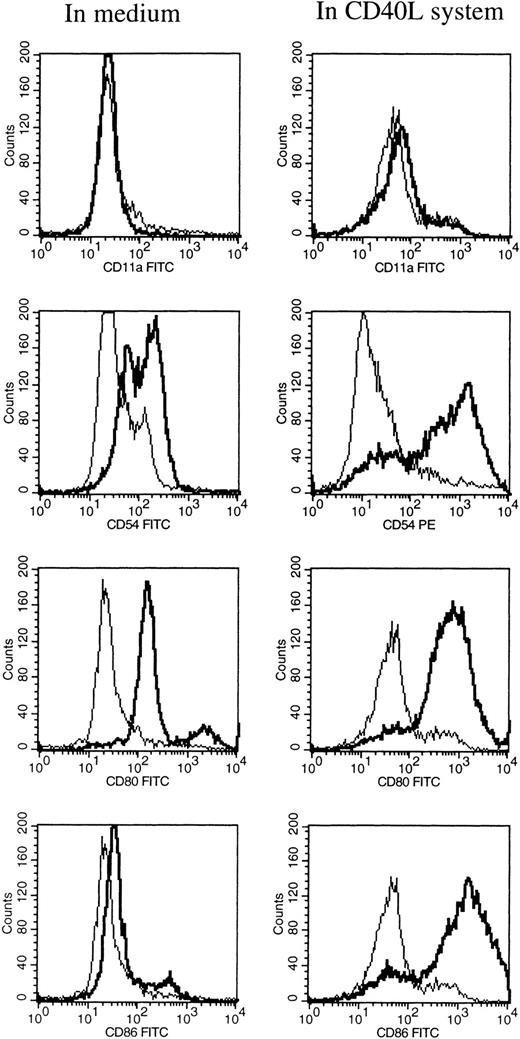
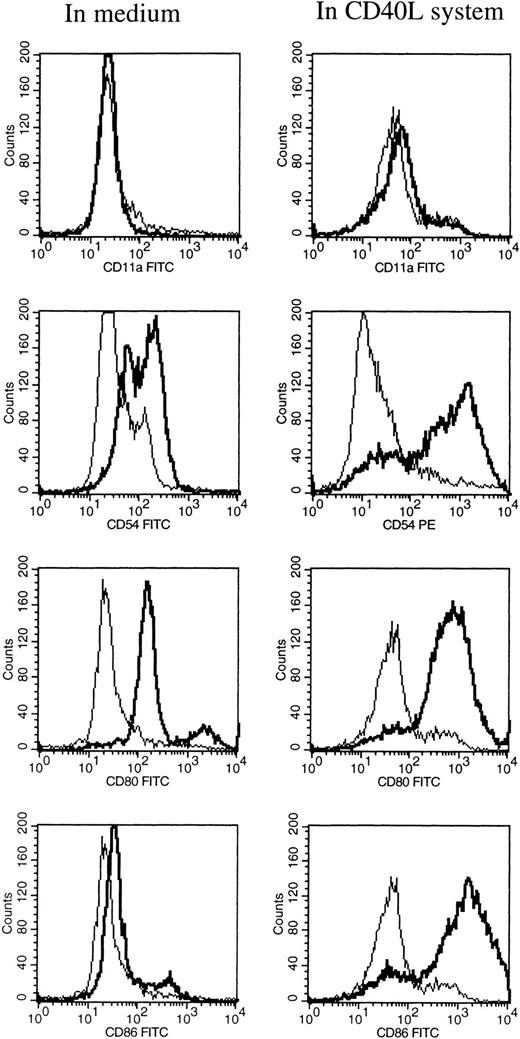
At different time intervals during culture, the HCL cells were analyzed for the expression of several adhesion, costimulatory, and HLA molecules by flow cytometry. After 1 hour of incubation at 37°C in medium alone, the HCL cells expressed low levels of CD54 (ICAM-1), CD58 (LFA-3), and CD80 (Table 1). Furthermore, the HCL cells expressed CD40, CD72, and HLA class II, and very high levels of HLA class I. HCL cells completely lacked the expression of CD11a (LFA-1) and CD86 (B7.2; Table 1). When HCL cells were cultured in medium alone no difference in the expression of the above-mentioned molecules was observed, except for the expression of HLA class I and II, which significantly increased from 2 days of culture. Expression of CD54 and CD58 was only slightly upregulated after 6 days of culture. To induce and upregulate the expression of CD11a, CD54, CD80, and CD86, the CD40L system was used. Triggering of the CD40 antigen on the HCL cells by CD40L transfectants highly increased the expression of CD54 and CD80 (Table 1 and Fig 1). The expression of CD86 was strongly induced. The expression of CD11a could not be induced by triggering of CD40 on the HCL cells.
FACS analysis of HCL cells after 6 days of culture in medium alone (left), and in the CD40L system (right). The expression of CD11a, CD54, CD80, and CD86 are shown by a thick black line, and the isotype control is shown by a thin line.
FACS analysis of HCL cells after 6 days of culture in medium alone (left), and in the CD40L system (right). The expression of CD11a, CD54, CD80, and CD86 are shown by a thick black line, and the isotype control is shown by a thin line.
Generation and characterization of HCL-reactive T-cell lines and clones.
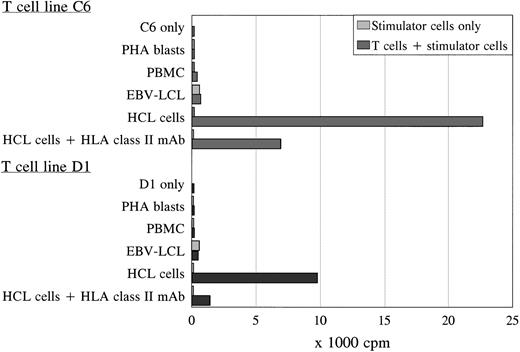
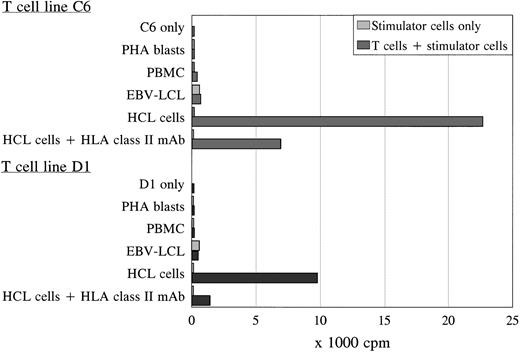
Using the activated HCL cells for stimulation, two proliferative T-cell lines (C6 and D1) generated independently from each other were derived from the spleen and peripheral blood of patient A, respectively. Both T-cell lines were TCRαβ+/CD4+ and specifically proliferated in response to autologous HCL cells as was measured by 3H-thymidine incorporation after 3 days of coculture (Fig 2). The T-cell lines showed similar proliferation in response to autologous HCL cells derived from the spleen or blood, and were not reactive to autologous PBMC (obtained during hematologic remission), PHA blasts, or EBV-transformed B cells (Fig 2). The antigen-specific proliferation of both T-cell lines was blocked by an MoAb against HLA class II. To exclude positive reactivity measured in the PLT as a result of immune responses generated to allotypic human serum components, the different stimulator cells were incubated in medium with 10% FCS overnight before using in the PLT. No difference was measured in proliferative responses to autologous cells incubated in 10% pooled human or 10% FCS serum (data not shown). The T-cell lines could not lyse the autologous HCL cells.
Proliferation of T-cell lines C6 and D1 in response to different autologous stimulator cells. Both T-cell lines specifically recognized the autologous HCL cells in an HLA class II-restricted way, without reactivity against autologous PBMC, PHA blasts, and EBV-LCL in the PLT. The PLT was performed in sixfold, and the SD of the means were lower than 15%.
Proliferation of T-cell lines C6 and D1 in response to different autologous stimulator cells. Both T-cell lines specifically recognized the autologous HCL cells in an HLA class II-restricted way, without reactivity against autologous PBMC, PHA blasts, and EBV-LCL in the PLT. The PLT was performed in sixfold, and the SD of the means were lower than 15%.
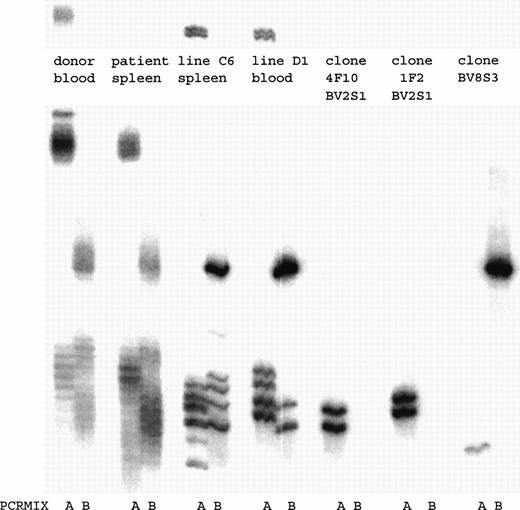
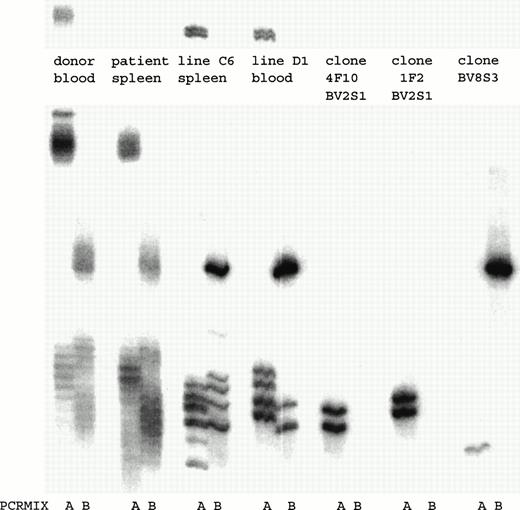
To determine how many and which T-cell clones with a certain TCRBV chain were present in the T-cell lines, a TCRBV-PCR was performed. Both T-cell lines consisted of several T-cell clones that expressed different TCRBV families (Fig 3). By fluorescence-activated cell sorting (FACS) analysis both T-cell lines consisted of a population of BV2+ T cells and a T-cell population that could not be determined by the MoAbs available. By TCRBV-PCR analysis this T-cell population was BV8S3+. Initially, we cloned T-cell line C6 by limiting dilution. After 4 weeks of culture, 25 T-cell clones were obtained, of which 15 expressed BV2 and showed two different TCR rearrangement patterns. In addition, 10 T-cell clones were BV8S3+, all expressing the same TCR rearrangement pattern. T-cell line D1 contained two of these three different T-cell clones (Fig 3). Two different BV2+ T-cell clones (4F10 and 1F2) and one BV8S3+ T-cell clone (BV8S3) were sequenced and showed functionally rearranged TCRB genes with different CDR3 regions (Table 2). Using direct PCR with the TCRBV subfamily–specific primers or with the CDR3-specific primers, the BV2+ and the BV8S3+T cells could not be detected in the original blood and spleen, with a sensitivity of 1% for BV2 and 0.01% for BV8. Using a nested PCR with the TCRBV-specific primers and the Cβ primer in the first step and the CDR3 specific primers in the second step, only the BV2+T cells from 1F2 could be detected in the original spleen and blood (data not shown).
PCR analysis of the TCRBV expression using BV-specific primers showed that in both T-cell lines BV2+ and BV8S3+ T-cell clones were present. By limiting dilution, two different types of BV2+ T-cell clones 4F10 and 1F2, and one type of BV8S3+ T-cell clone were obtained. PCR mix A contained primers for TCR BV2, BV6, BV17, BV18, and BV21; mix B contained primers for TCR BV5S1, BV7, BV8, BV9, BV14, and BV23. Both BV2+ T-cell clones 4F10 and 1F2 show two bands because of the difference in running pattern of the single-stranded cDNA fragments after denaturation.
PCR analysis of the TCRBV expression using BV-specific primers showed that in both T-cell lines BV2+ and BV8S3+ T-cell clones were present. By limiting dilution, two different types of BV2+ T-cell clones 4F10 and 1F2, and one type of BV8S3+ T-cell clone were obtained. PCR mix A contained primers for TCR BV2, BV6, BV17, BV18, and BV21; mix B contained primers for TCR BV5S1, BV7, BV8, BV9, BV14, and BV23. Both BV2+ T-cell clones 4F10 and 1F2 show two bands because of the difference in running pattern of the single-stranded cDNA fragments after denaturation.
HLA-DQ and HLA-DP restriction of recognition by BV2+T cells and BV8S3+ T cells.
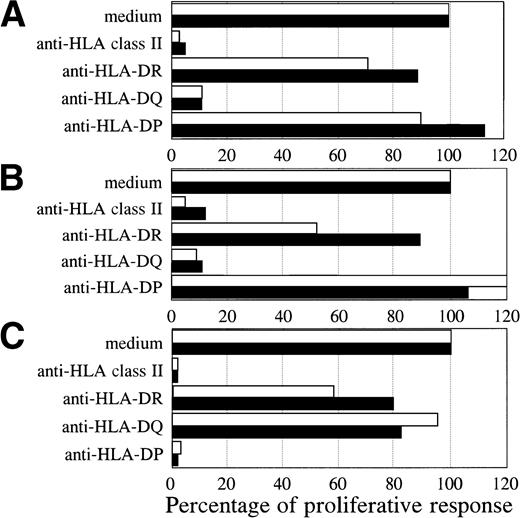
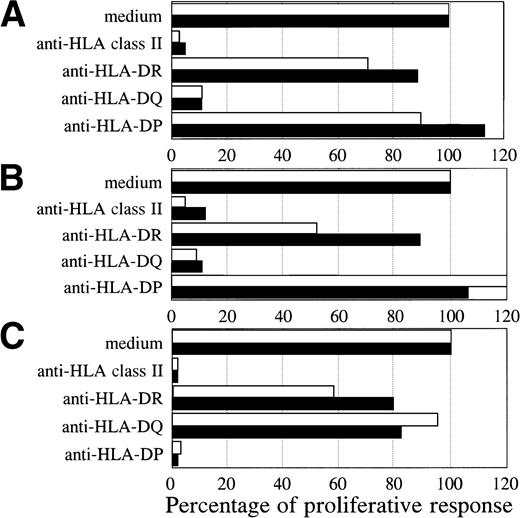
Both BV2+ T-cell clones 4F10 (4,072 ± 313 cpm) and 1F2 (4,569 ± 428 cpm), and the BV8S3+ T-cell clone (6,107 ± 651 cpm) specifically recognized the autologous HCL cells of patient A. To determine the restriction of recognition of the HCL cells, HLA class I and II reactive MoAbs were used for blocking studies. The specific proliferative responses of the three T-cell clones were completely blocked by CD4 and HLA class II MoAbs, but not by CD8 and HLA class I MoAbs, showing class II-restricted recognition (data not shown). The specific proliferative responses of the BV2+ T-cell clones were blocked by HLA-DQ MoAbs and not by HLA-DR and HLA-DP MoAbs (Fig 4A and B). Proliferation of both BV2+ T-cell clones 4F10 and 1F2 in response to autologous HCL cells and HCL cells of patient B with the same HLA class II type (DR4 DQ3 DQB1*0301 DP4) was HLA-DQ restricted. In contrast, the specific proliferative response of the BV8S3+ T-cell clone was blocked by HLA-DP MoAbs (Fig 4C), but not by HLA-DR and HLA-DQ MoAbs, showing that recognition of HCL cells by BV8S3+ T cells was restricted by HLA-DP.
HCL-cell–specific recognition by the T-cell clones was restricted by HLA class II. The restriction of recognition of the HCL cells by the T-cell clones was determined by blocking studies. The HCL cells from patient A (white bar) and B (black bar) were incubated with saturating concentrations of pan-HLA class II (PdV5.2), HLA-DR (B8.11.2), HLA-DQ (SPVL3), or HLA-DP (B7.21) MoAbs for 15 minutes before the responder T cells were added. The specific proliferative responses of the BV2+ T-cell clones 4F10 (A) and 1F2 (B) were blocked by an HLA-DQ MoAb. The BV8S3+ T-cell clone (C) recognized the HCL cells in an HLA-DP–restricted way.
HCL-cell–specific recognition by the T-cell clones was restricted by HLA class II. The restriction of recognition of the HCL cells by the T-cell clones was determined by blocking studies. The HCL cells from patient A (white bar) and B (black bar) were incubated with saturating concentrations of pan-HLA class II (PdV5.2), HLA-DR (B8.11.2), HLA-DQ (SPVL3), or HLA-DP (B7.21) MoAbs for 15 minutes before the responder T cells were added. The specific proliferative responses of the BV2+ T-cell clones 4F10 (A) and 1F2 (B) were blocked by an HLA-DQ MoAb. The BV8S3+ T-cell clone (C) recognized the HCL cells in an HLA-DP–restricted way.
BV2+ and BV8S3+ T-cell clones recognize HCL cells from other patients in an HLA class II-restricted way.
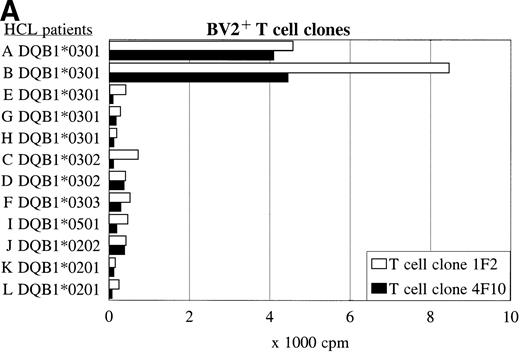
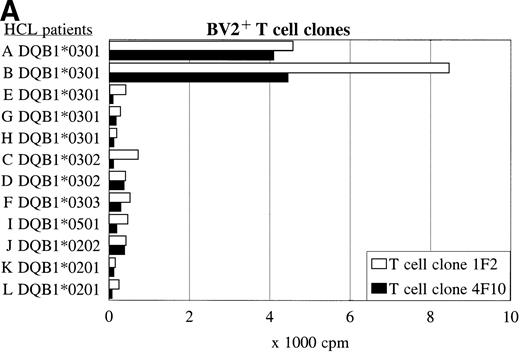
Panel studies were performed using HCL cell samples obtained from 11 other patients (B-L) with compatible or different HLA class II types (Table 3). FACS analysis showed that all HCL cell samples expressed high levels of HLA-DQ. Two of eight HLA-DQ3+ HCL cell samples were DR4+ and expressed DQB1*0301, three of eight samples were DR5+ and expressed DQB1*0301 but a different DQα-chain, and three of eight samples expressed another DQβ-chain, such as DQB1*0302 or DQB1*0303. The BV2+ T-cell clones 1F2 and 4F10 proliferated in response to both HLA-DR4+ DQ3+DQB1*0301+ HCL cell samples from patients A and B (Fig 5A and Table 3), and did not recognize the HLA-DR5+ DQ3+ DQB1*0301+ HCL cell samples (E, G, and H). The HLA-DQ3+DQB1*0302+ and DQB1*0303+ HCL cell samples (C, D, and F), and the HLA-DQ3− HCL cell samples (I-L) were also not recognized by both BV2+ T-cell clones.
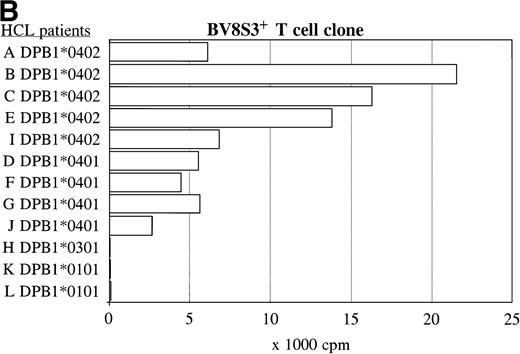
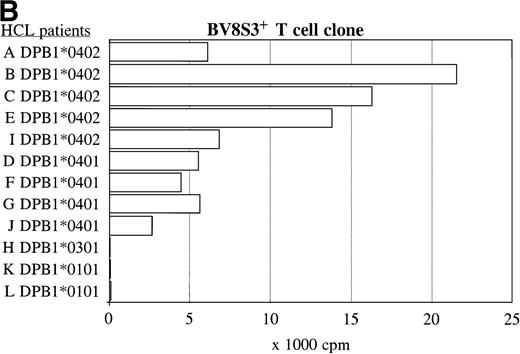
The recognition of the HCL cells by the BV2+ and the BV8S3+ T-cell clones was restricted by HLA-DQA1*03/DQB1*0301 and HLA-DPB1*04, respectively. Panel studies were performed to further determine the restriction of recognition of the HCL cells by the T-cell clones. Proliferation of the BV2+ T-cell clones 4F10 and 1F2 (A) and the BV8S3+ T-cell clone (B) in response to HCL cells from different patients are shown.
The recognition of the HCL cells by the BV2+ and the BV8S3+ T-cell clones was restricted by HLA-DQA1*03/DQB1*0301 and HLA-DPB1*04, respectively. Panel studies were performed to further determine the restriction of recognition of the HCL cells by the T-cell clones. Proliferation of the BV2+ T-cell clones 4F10 and 1F2 (A) and the BV8S3+ T-cell clone (B) in response to HCL cells from different patients are shown.
The same panel of HCL cell samples was used to study the BV8S3+ T-cell clone. The BV8S3+ T-cell clone proliferated in response to all nine HLA-DPB1*04+ HCL cell samples tested (Fig 5B). HLA-DPB1*0402+ HCL cells (A, B, C, and E) were superior to HLA-DPB1*0401+ HCL cells (D, F, G, and J) as stimulator cells. The BV8S3+ T cells did not recognize the HCL cells from HLA-DPB1*04− patients.
Reactivity with other hematologic malignancies.
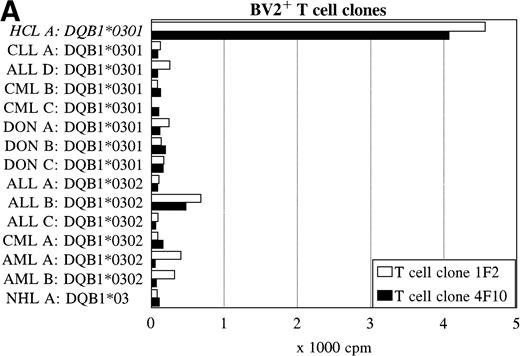
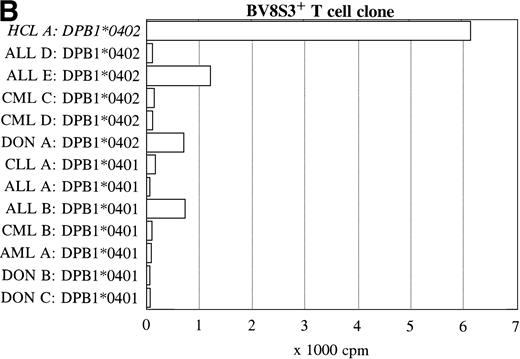
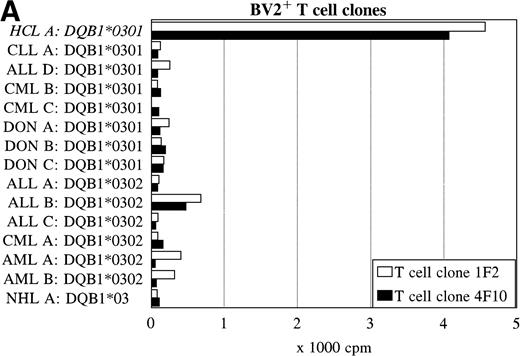
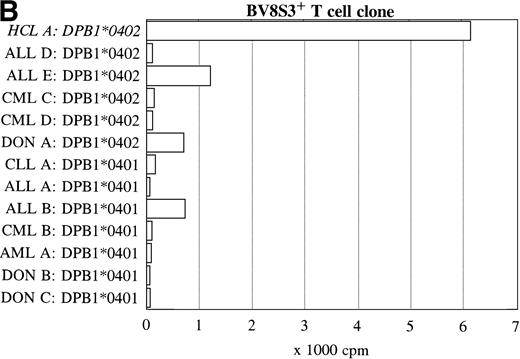
To further determine the specificity of recognition of the T-cell clones, blood or bone marrow samples from HLA-DR4DQ3+(DQA1*03 DQB1*0301/0302) and DPB1*0401/0402+ healthy controls and patients with different hematologic malignancies were used as stimulator cells. FACS analysis showed that all donor and other malignant cell samples used expressed HLA-DQ and HLA-DP. Both the BV2+ and the BV8S3+ T-cell clones showed no proliferation in response to almost all malignant cell samples from 13 patients with CLL, NHL, CML, AML, ALL, and 3 donor samples (Fig 6). The cells from 1 patient with ALL (B) behaved differently because the malignant cells weakly stimulated both the BV2+ and the BV8S3+ T-cell clones, although the ALL cells were DQB1*0302+ and DPB1*0401+. Proliferation of the BV2+ and BV8S3+ T-cell clones in response to the ALL cells (B) could be blocked by HLA-DQ and HLA-DP MoAbs, respectively. The BV8S3+ T cells also showed weak proliferation in response to bone marrow mononuclear cells from donor A and malignant cells from ALL patient E, which expressed DPB1*0401/0402.
Reactivity of the BV2+ and BV8S3+ T-cell clones with malignant cells from patients with other hematologic malignancies. Proliferation of the BV2+ T-cell clones 4F10 and 1F2 (A) and the BV8S3+ T-cell clone (B) in response to malignant cell samples and normal cell samples from HLA-DR4DQ3+DPB1*04+ patients with CLL, NHL, ALL, CML, AML, and healthy individuals, respectively.
Reactivity of the BV2+ and BV8S3+ T-cell clones with malignant cells from patients with other hematologic malignancies. Proliferation of the BV2+ T-cell clones 4F10 and 1F2 (A) and the BV8S3+ T-cell clone (B) in response to malignant cell samples and normal cell samples from HLA-DR4DQ3+DPB1*04+ patients with CLL, NHL, ALL, CML, AML, and healthy individuals, respectively.
Characterizations of the T-cell clones 4F10, 1F2, and BV8S3.
Ten days after restimulation with autologous HCL cells, the T-cell clones were analyzed by flow cytometry. All T-cell clones were CD4+, CD28+, CD45RO+, and expressed CD25. The T-cell clones did not express a typical cytokine profile of Th1 or Th2 T cells because both BV2+ T-cell clones and the BV8S3+ T-cell clone showed cytokine gene expression of IL-2, IL-4, IL-5, IFN-γ, and IL-10.
DISCUSSION
We isolated autologous HCL-reactive T cells both from the spleen and blood of a patient with HCL. Patients with HCL frequently show a restricted TCRBV repertoire,8 which may partly explain the T-cell–related immune deficiency. In addition, other factors may cause T-cell dysfunction in vivo, such as IL-10 and tumor necrosis factor-α that are produced by the HCL cells,5,7,24-28 and lack or impaired expression of CD28 on especially the CD4+ T cells.29 Beside these factors, the HCL cells themselves showed impaired expression of adhesion30 or costimulatory molecules31 necessary for the completion of the antitumor response.32 Therefore, we used HCL cells activated in the CD40L system for the generation of the T-cell clones to overcome the lack of stimulation or induction of anergy by the nonactivated HCL cells.33-37 We generated two T-cell lines, one from the spleen and one from the blood, showing specific proliferation in response to autologous HCL cells. Both T-cell lines consisted of an identical BV2+ and BV8S3+ T-cell clone.
It is remarkable that the recognition of the HCL cells was restricted by HLA-DQ and DP, whereas DR-restricted T-cell responses are more common. Recognition of the HCL cells by both BV2+ T-cell clones was restricted by HLA-DQA1*03/DQB1*0301. HCL cells expressing other DQα- or DQβ-chains were not recognized. This is consistent with the data of Kwok et al38 that DQA1*0301/DQB1*0301 and DQA1*0501/DQB1*0301 dimers show different specificities for the AYK peptide, a modified poly-alanine peptide. The effect of polymorphisms of both DQα- and DQβ-chains on peptide binding is expected because both chains contribute residues for the binding pockets of the class II molecules.39 The BV8S3+ T-cell clone recognized all nine HLA-DPB1*04+ HCL cell samples tested, with recognition of DPB1*0402+ HCL cells being superior to DPB1*0401+ HCL cells. HLA-DPB1*04− HCL cell samples and DPB1*04+ cells from most other hematologic malignancies were not recognized by the BV8S3+ T cells, indicating recognition of an HCL-specific protein processed and presented in HLA-DPw4 molecules. Both BV2+ and the BV8S3+ T-cell clones weakly proliferated in response to ALL patient B’s malignant cells, which expressed DQB1*0302 and DPB1*0401 (Fig 6). Possibly, the ALL cells expressed an antigenic peptide similar to an HCL-associated peptide, which in combination with DQB1*0302 or DPB1*0401 was inefficiently recognized by the TCR. The BV8S3+ and BV2+ T cells may have given increased proliferation in response to the cells of ALL patient B if the cells had expressed DPB1*0402 and DQB1*0301, respectively.
It is possible that the BV2+ T cells recognize the same antigen as the BV8S3+ T cells. Several antigenic epitopes may be derived from one protein. Multiple class II molecules can bind to a single large denatured or partially cleaved protein at diverse sites,40,41 after which antigenic fragments may undergo additional proteolysis.42 It is as yet not known if HCL cells express proteins which may be related to the origin and development of the disease. Mutated proteins expressed by tumor cells can function as antigenic targets to which immune responses can be generated. Several antigenic peptides have been associated with autologous tumor-specific T-cell responses. These antigens include proteins encoded by the MAGE, BAGE, or GAGE families of genes; tissue-specific differentiation antigens; antigens encoded by genes that are overexpressed; viral antigens; and antigens as a result of a mutation.43-45
In other B-cell malignancies such as B-CLL, B-NHL, multiple myeloma, and in monoclonal gammopathy of undetermined significance, oligoclonal T-cell expansions have also been found.46-50 From blood of a CLL patient, a proliferative T-cell clone was generated that recognized autologous B-CLL cells restricted by HLA-DR11.51Farace et al52 observed in a patient with B-CLL a clonally expanded BV19+ T-cell subpopulation. After expansion in vitro, this BV19+ T-cell clone specifically recognized autologous CLL cells as measured by production of GM-CSF and IFN-γ.52 In contrast, in HCL patient A only the BV2+ T-cell clone 1F2 could be detected in the original spleen and blood at low levels, whereas the other two clones were negative. This suggests that the frequency of the T-cell clones was less than 1 out of 104 T cells in vivo. The T-cell clones generated in vitro were not from the same TCRBV family as the T cells clonally expanded in vivo, which expressed predominantly BV3.20 Previous results showed that 25% of all T cells expressed BV3, whereas only 3% to 6% expressed BV2 or BV8.20 Possibly, the increased costimulatory capacity of the HCL cells cultured in the CD40L system and the culture conditions preferentially favored the expansion of the CD4+ T-cell clones. Alternatively, the in vivo–expanded clones may have had too limited residual capacity left to be further expanded in vitro. Thus, the observation that different clones were isolated after in vitro stimulation as compared with the clonal expansion in vivo does not exclude the possibility that these clones in vivo may also recognize the HCL cells. Dietrich et al53 already described this discrepancy for T-cell clones from patients with renal cell carcinoma and glioblastoma. The T-cell clones overexpressed in vivo disappeared after restimulation with autologous tumor cells in vitro, whereas T cells with other Vβ-chains oligoclonally expanded.
In conclusion, autologous HLA-DQ or DP-restricted HCL-specific T-cell clones could be generated from the spleen and blood of a patient with HCL. These T-cell clones may be used to provide more insight into the T cell–HCL cell interaction, especially into the inhibitory and stimulatory factors which play a remarkable role in this disease. Furthermore, these HCL-reactive T-cell clones can be used for the detection of a putative HCL-specific tumor antigen.
ACKNOWLEDGMENT
We thank Dr F.H.J. Claas for the HLA-typing, and Dr F. Koning for critically reading the manuscript.
Supported by the Dutch Cancer Society (Koningin Wilhelmina Fonds), grant no. RUL 94-842.
The publication costs of this article were defrayed in part by page charge payment. This article must therefore be hereby marked “advertisement” in accordance with 18 U.S.C. section 1734 solely to indicate this fact.
REFERENCES
Author notes
Address reprint requests to Lisette van de Corput, PhD, Leiden University Medical Center, Department of Hematology, Bldg 1 C2-R, PO Box 9600, 2300 RC Leiden, The Netherlands.

