Abstract
The Cancer and Leukemia Group B (CALGB) has been conducting a prospective cytogenetic companion study (CALGB 8461) to all CALGB treatment protocols for newly diagnosed adults with acute lymphoblastic leukemia (ALL). These protocols underwent a significant change in 1988 when a new intensive chemotherapy program was introduced (CALGB 8811). We asked whether karyotype continued to represent a significant prognostic factor in adult ALL patients after the change. A total of 256 patients had adequate pretreatment cytogenetic analyses: 67 before 1988 and 189 subsequently. The complete remission (CR) rate for the whole group was 80%. Patients with t(9;22), t(4;11), −7, or +8 had significantly lower probabilities of continuous CR and survival at 5 years (.11 and .12) than patients with a normal karyotype (.38 and .37) and patients with miscellaneous cytogenetic abnormalities (.52 and .49;P < .001 for each comparison). When analyzed by treatment period, the CR rate before CALGB 8811 was 63%; subsequently, it was 86% (P < .001). Patients with cytogenetic abnormalities other than t(9;22), t(4;11), −7, or +8 had better CR rates, disease-free survival (DFS), and survivals (P = .001,P = .04, and P = .004, respectively) after the change to the more intensive chemotherapy regimens. Patients with normal cytogenetics had improved CR rate but no improved DFS or survival, whereas no significant benefit for patients with t(9;22), t(4;11), −7, or +8 was seen. In a multivariate analysis, karyotype retained its prognostic significance for DFS but not for survival; it remained the most important factor for DFS. We conclude that cytogenetic analysis at diagnosis should be used to guide treatment decisions in adults with ALL.
THE CLONAL CHROMOSOME abnormalities t(9;22)(q34;q11), t(4;11)(q21;q23), and the t(8;14)(q24;q32) are well known in adults with acute lymphoblastic leukemia (ALL).1,2The Cancer and Leukemia Group B (CALGB) has been conducting a prospective cytogenetic companion study (CALGB 8461) to all CALGB front-line ALL treatment protocols since 1984. These protocols (CALGB 8011, 8411, and 8513)3,4 underwent a significant change in 1988 when a new intensive chemotherapy program (CALGB 8811) was introduced.5 The two subsequent protocols (CALGB 9111 and CALGB 9311) were based on the same intensive regimen, with minor modifications.6 7
We asked whether karyotype continued to represent a significant prognostic factor in patients with ALL regardless of other initial clinical characteristics, ie, age, white blood cell (WBC) count, the presence of a mediastinal mass, French-American-British (FAB) classification, and immunophenotype, even after the treatment regimens had been intensified. Finally, we studied patients sequentially, at diagnosis, and at relapse to determine whether a change in karyotype at relapse occurred and, if so, if it had an impact on outcome.
MATERIALS AND METHODS
Patients.
Patients included in this analysis were enrolled on CALGB 8461, a prospective study of karyotype in acute leukemia, which has been a companion study to all CALGB ALL treatment protocols since 1984. Adults who were 15 years or older with previously untreated ALL as defined by the FAB classification system were eligible.8 9Patients with prior or concomitant malignancy, uncontrolled or severe cardiovascular disease, pre-existing liver disease, or uncontrolled infection were ineligible for these studies. Central review of the pathologic diagnosis was performed. The only patients excluded from this analysis based on morphology were those with FAB L3 (Burkitt’s-type ALL).
Cytogenetic analyses.
Chromosomal analyses of bone marrow (232 samples) and blood (24 samples) were performed in institutional CALGB cytogenetics laboratories, and karyotypes from all cases were centrally reviewed. Specimens were obtained at diagnosis from all patients. Specimens were processed using direct methods and unstimulated short-term (24-, 48-, and 72-hour) cultures. G-banding was usually performed, although Q-banding was acceptable for inclusion in this series. A minimum of 20 bone marrow metaphase cells were analyzed in each patient designated as having a normal karyotype, with the exception of 1 case in which 19 normal cells were analyzed. The criteria to describe a cytogenetic clone and description of karyotype followed the recommendations of the International System for Human Cytogenetic Nomenclature.10
Immunophenotyping.
Before April 1991, cases were classified by uniparameter flow cytometry using the criteria previously published.11 Subsequently, cases were classified by multiparameter flow cytometry.12In these cases, criteria for surface marker positivity was coexpression of an antigen by at least 10% of the leukemia blast population. Ten percent positivity was selected as a cutoff to eliminate the possibility that coexpression was due to a nonspecific binding process. B-lineage (B) antigen expression was defined as CD19 or CD20 positivity. T-lineage (T) antigen expression was defined as either (1) CD2 or CD7 positivity with CD1 or CD3 or CD4 or CD5 or CD8 positivity or (2) CD5 positivity without CD19 or CD20 positivity. Myeloid (My) antigen expression was defined as CD13 and/or CD33 positivity coexpressed with either B- or T-lineage antigens. Cases expressing combinations of myeloid antigens with either B- or T-lineage antigens were classified as BMy or TMy. Patients with myeloid antigens only were classified as acute myeloid leukemia and excluded from this analysis.
Treatment.
All patients were treated on one of the following six treatment studies. On CALGB 8011, patients received daunorubicin, prednisone, vincristine, L-asparaginase, and intrathecal methotrexate for induction.3 After attainment of complete remission (CR), patients were randomized to receive either intensive cytarabine and daunorubicin or cycles of mercaptopurine and methotrexate, followed by mercaptopurine, methotrexate, vincristine, and prednisone for 3 years of maintenance therapy. In CALGB 8411 mitoxantrone, vincristine and prednisone were used for induction.4 CALGB 8513 compared daunorubicin versus mitoxantrone in induction followed by a multidrug intensification over 8 months.4 In CALGB 8811, the induction regimen was redesigned to include cyclophosphamide, daunorubicin, vincristine, prednisone, and L-asparaginase. Patients who achieved CR received multidrug consolidation treatment, central nervous system prophylaxis, late intensification, and maintenance chemotherapy for a total of 24 months.5 CALGB 9111 used exactly the same chemotherapy regimen as CALGB 8811, but, in addition, patients were assigned in a double-blind fashion to receive granulocyte colony-stimulating factor (G-CSF) or a placebo during the induction and early intensification courses.6 CALGB 9311 also used exactly the same chemotherapy regimen as CALGB 8811, but, in addition, all patients received G-CSF after induction and, after the first consolidation course, patients with B-lineage ALL received anti-B4–blocked ricin therapy and patients with T-lineage ALL received high-dose cytarabine.7
Definition of response.
The definition of hematologic CR in these studies adhered to the criteria established previously.5 CR required a neutrophil count greater than 1,500/μL, platelet count greater than 100,000/μL, normal bone marrow cellularity (>25%) with trilineage hematopoiesis with less than 5% blasts, and resolution of all extramedullary disease. Patients with less than 25% lymphoblasts in the bone marrow after course I were allowed to continue through course II but were removed from the treatment protocols if they had not achieved CR by that time point. Patients with greater than 25% lymphoblasts in the bone marrow after course I were removed from the treatment studies.
Definition of relapse, disease-free survival (DFS), and survival duration.
Relapse was defined by the reappearance of more than 5% leukemic cells in bone marrow aspirates or extramedullary leukemia in patients with a previously documented CR. In patients who achieved CR, DFS was measured from the date of documented CR to ALL relapse (bone marrow or extramedullary) or death from any cause. Overall survival was measured from the time of entry on the treatment study to the time of death. Patients were censored for DFS and for survival only at the date last known to be in remission or alive, respectively.
Statistical analyses.
One of the main objectives of this study was to investigate the prognostic significance of karyotypic subgroups in the presence of other clinical and laboratory factors that have been shown to influence outcome. The other factors included age, WBC count, mediastinal mass, FAB subtype, immunophenotype, and treatment.6 The relationships between these factors and DFS or survival were analyzed using the Cox regression model.13 In the multivariate analysis, karyotype, categorized into the three risk groups, was analyzed as a variable with two degrees of freedom. Age was considered as a continuous variable and dichotomized as less than 60 years and ≥60 years; WBC count was dichotomized as less than 30,000/μL and ≥30,000/μL, as well as used as a continuous variable by taking the natural logarithm; mediastinal mass was dichotomized as present or absent; FAB subtype was dichotomized as L1 or L2; and immunophenotype was dichotomized as expression of B or B+myeloid (BMy) markers versus T or T+myeloid (TMy) markers. Treatment was dichotomized into earlier protocols (8011, 8411, and 8513) and later protocols (8811, 9111, and 9311). The distribution of time to a specific endpoint was estimated by the method of Kaplan and Meier,14 and 95% confidence intervals for estimated probabilities of surviving or remaining in CR were calculated by the method of Simon and Lee.15Differences among groups with respect to the distribution of times were tested with the logrank statistic.16 Two-group comparisons of pretreatment characteristics between the unfavorable risk group and the normal group and the miscellaneous risk group and the normal group were considered with the Wilcoxon rank sum test for medians and Fisher’s exact test for proportions.
RESULTS
Patient characteristics.
For the six CALGB treatment studies examined, 551 patients with ALL were registered between July 1984 and September 1994. No cytogenetic sample was available on 29 patients, 8 had missing data, 20 patients were ineligible for the treatment study due to non-ALL morphology after central review, and 210 patients had inadequate cytogenetic analyses. Inadequate cytogenetic analysis was defined by either poor quality of the banding, no mitoses, a normal karyotype but less than 20 cells analyzed from marrow, or a normal karyotype analyzed only by direct methods, ie, without culture. After central karyotype review, a total of 284 patients had adequate pretreatment cytogenetic analyses. Twelve of the 284 patients had the t(8;14)(q24;q32) or its variant and were excluded as Burkitt’s leukemia. Sixteen were classified as acute myeloid leukemia (usually FAB-M0) by central review of immunophenotype and were therefore excluded from this analysis. The remaining evaluable 256 patients were treated on ALL treatment studies CALGB 8011 (n = 12), 8411 (n = 4), 8513 (n = 51), 8811 (n = 70), 9111 (n = 82), and 9311 (n = 37). The median follow-up time of living patients is estimated to be 5.5 years (range, 1.6 to 12.3 years).
A comparison of patients with adequate cytogenetic analysis to those with inadequate samples showed that there was a higher proportion of patients with inadequate samples in the initial treatment period (40%v 26%; P = .002). There were no significant differences between the adequate versus inadequate cytogenetics groups with respect to age (P = .15), mediastinal mass (P = .87), WBC count (P = .24), CR rate (P = .91), DFS (P =.48), or survival (P = .62).
Cytogenetic groups.
Table 1 presents the frequency of the chromosome abnormalities and gives some indication of the frequency of multiple abnormalities. Table 2 gives clinical outcome, with respect to DFS and overall survival, for those abnormalities with at least 9 patients as well as for patients with a normal karyotype. A clonal cytogenetic abnormality was detected in 177 (69%) patients, and 79 (31%) patients had a normal karyotype. The clinical outcome for each specific abnormality is compared with the normal group.
Unfavorable cytogenetic groups.
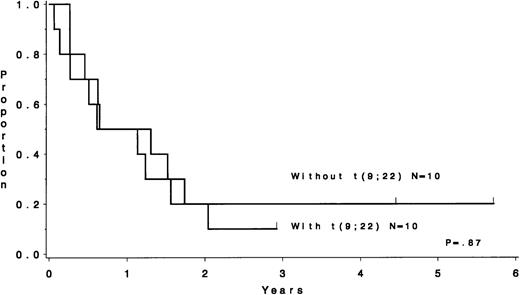
Groups with unfavorable outcome are the t(9;22), +8, and t(4;11) (P < .001, P = .007, and P = .002 for DFS andP < .001, P = .004, and P < .001 for survival, respectively). In addition, the −7 group had an unfavorable outcome (P = .01 for survival). It may seem that the group with +8 abnormality fared poorly by having 12 of 23 (52%) of the patients with a t(9;22) as well. However, as shown in Fig 1, those with a +8 abnormality without t(9;22) fared just as poorly (P = .87). Similarly, there were 14 patients with the −7 chromosome abnormality, 9 of whom had t(9;22) as well. The 5 patients with −7 abnormality but without t(9;22) fared as poorly. Hence, the unfavorable cytogenetic group was defined to be composed of the 100 patients with either t(9;22), t(4;11), −7, or +8 abnormality.
DFS for patients with the +8 cytogenetic abnormality. Those coharboring the t(9;22) have a similar outcome to those without the t(9;22) (P = .87).
DFS for patients with the +8 cytogenetic abnormality. Those coharboring the t(9;22) have a similar outcome to those without the t(9;22) (P = .87).
Miscellaneous and normal.
The 77 other patients with a chromosome abnormality were combined to form a miscellaneous risk group. The most common type of miscellaneous abnormalities included +21, del(9p) or t(9p), del(12p) or t(12p), t(14q11-q13), t(14q32) other than t(8;14), and del(6q) (Table 1). There were 5 patients with a hyperdiploid karyotype (>50 chromosomes but without any structural abnormalities). They all died at a median of 8 months (range, 3 months to 3.1 years). Patients without a detectable cytogenetic abnormality were classified as a normal group. The pretreatment characteristics of the 256 patients are summarized in Table 3 according to cytogenetic risk group.
Favorable cytogenetic groups.
In Table 2, the group with del(12p) or t(12p) (n = 11) is suggestive of having better survival compared with the normal group [probability of survival at 5 years, .82 v .37; P = .10; excluding the 2 cases with t(9;22)]. A possible explanation is that these patients are somewhat younger than the normal group (median ages, 21 v30 years; P = .06). Another group that may have a favorable prognosis compared with the normal group is t(14q11-q13) [n = 9; excluding 2 patients with t(9;22)]. This group was composed of 8 patients with t(14q11-q13) and 1 patient with inv(14)(q11q32). Among them, 4 patients had t(10;14)(q24;q11), all of whom remain in continuous CR from 6.2 to 8.0 years. Longer survival (P = .04) and DFS (P = .05) was observed in the group with t(14q11-q13), which is usually associated with T-cell ALL. In this study, among the 11 patients, phenotype was performed in 9; 7 patients had T-lineage, whereas 2 had B-lineage [including 1 patient with t(9;22)].
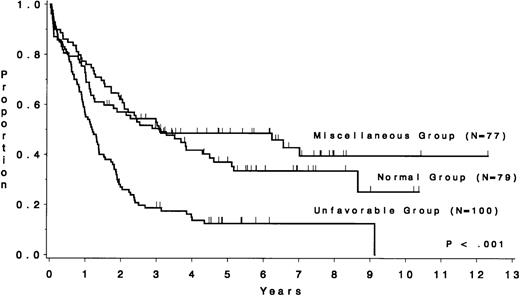
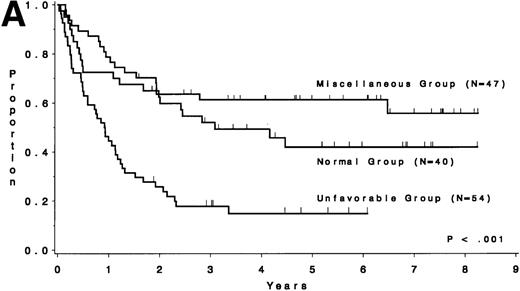
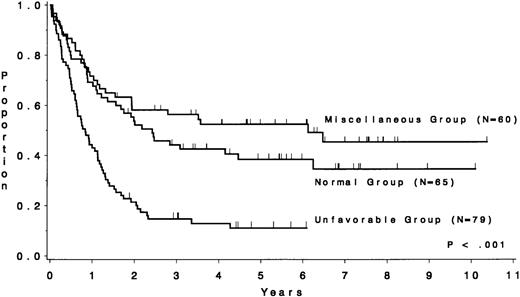
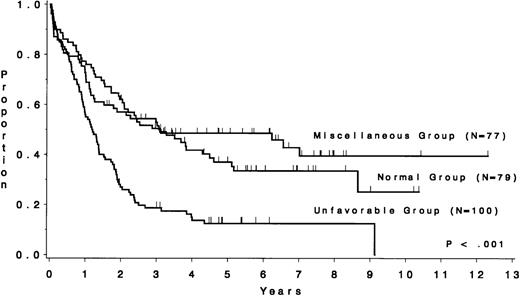
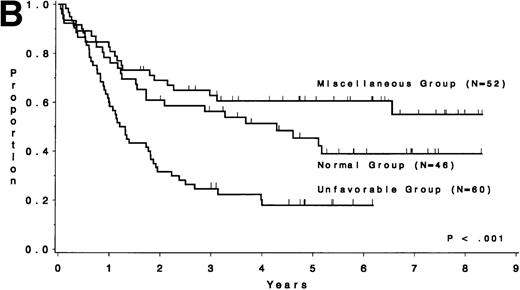
The CR rate for the 256 patients was 80%, with 52 patients not achieving CR. When analyzed by treatment period, the CR rate before initiation of CALGB 8811 was 63%; subsequently, it was 86% (P< .001). When all patients were considered, the CR rate was 79% for the unfavorable risk group, 78% for the miscellaneous abnormalities group, and 82% for the normal group (P = .77). The probability of continuous CR (CCR) at 5 years was .11 for the unfavorable risk group, .52 for the miscellaneous abnormalities group, and .38 for the normal group (Fig 2 and Table 4). The probability of survival at 5 years was .12 for the unfavorable risk group, .49 for the miscellaneous abnormalities group, and .37 for the normal group (Fig 3 and Table 4). The unfavorable risk group differs significantly from both of the other groups for both endpoints (P < .001 for each comparison). However, the miscellaneous group had comparable CCR and survival to the normal group (P = .53 and P = .91, respectively). The 9 long-term (at least 3 years) survivors who had either t(9;22) or t(4;11) all underwent allogeneic bone marrow transplantation (BMT), except for 2 patients with t(4;11) who are alive and in continuous CR 4.5 and 4.8 years after chemotherapy alone (CALGB 9111). There are 3 long-term survivors who had +8; they are surviving 3.0, 4.5, and 5.8 years and only 1 [with t(9;22), surviving 3.0 years] is known to have undergone allogeneic BMT. Because of the importance of allogeneic BMT in prolonging survival for these patients, we have analyzed our data for those less than 60 years of age who were treated with the more intensive regimens. Figure 4A and B show similar results to Figs 2 and 3, respectively.
DFS by cytogenetic risk group for 204 complete responders. The unfavorable risk group (n = 79), consisting of patients with the t(4;11), t(9;22), −7, or +8, had a median duration of nearly 10 months, whereas the miscellaneous abnormality group (n = 60) had a median of 5.5 years and the normal group (n = 65) had a median of 2.3 years.
DFS by cytogenetic risk group for 204 complete responders. The unfavorable risk group (n = 79), consisting of patients with the t(4;11), t(9;22), −7, or +8, had a median duration of nearly 10 months, whereas the miscellaneous abnormality group (n = 60) had a median of 5.5 years and the normal group (n = 65) had a median of 2.3 years.
Survival by cytogenetic risk group for 256 ALL patients. The unfavorable risk group (n = 100), consisting of patients with t(4;11), t(9;22), −7, or +8, had a median survival of 1.2 years, whereas the miscellaneous abnormality group (n = 77) had a median of 3.1 years and the normal group (n = 79) had a median of 2.9 years.
Survival by cytogenetic risk group for 256 ALL patients. The unfavorable risk group (n = 100), consisting of patients with t(4;11), t(9;22), −7, or +8, had a median survival of 1.2 years, whereas the miscellaneous abnormality group (n = 77) had a median of 3.1 years and the normal group (n = 79) had a median of 2.9 years.
DFS and overall survival of patients less than 60 years of age treated on the intensive treatment protocols (≥8811) by cytogenetic risk group. (A) DFS; (B) overall survival.
DFS and overall survival of patients less than 60 years of age treated on the intensive treatment protocols (≥8811) by cytogenetic risk group. (A) DFS; (B) overall survival.
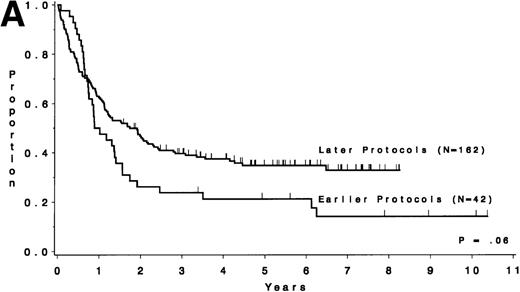
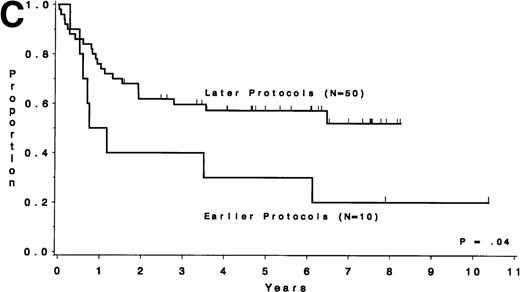
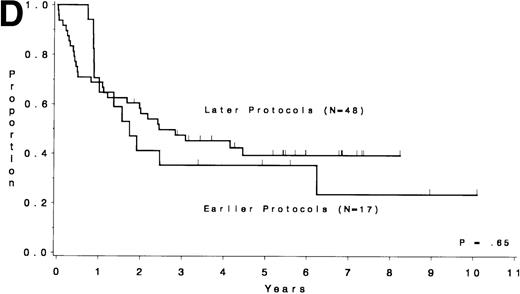
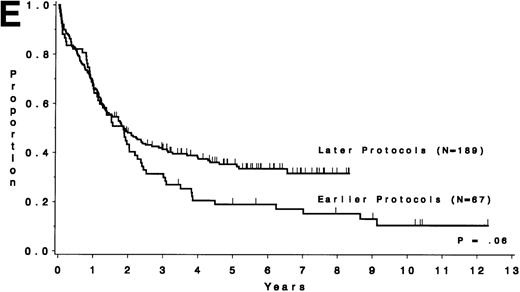
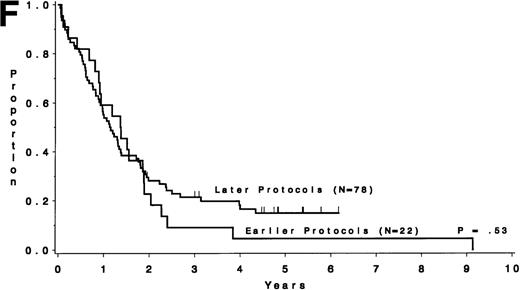
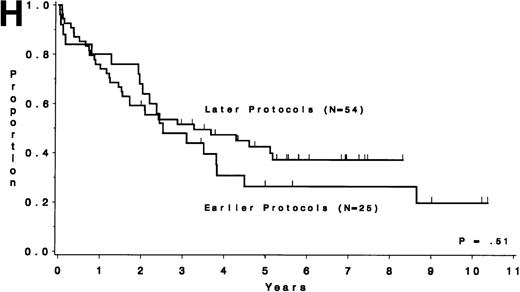
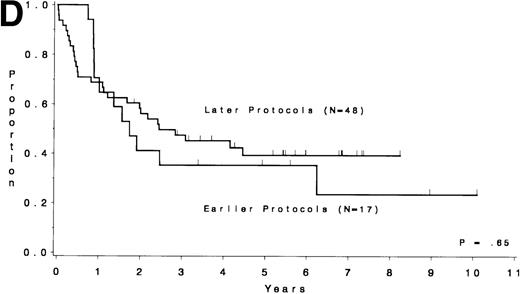
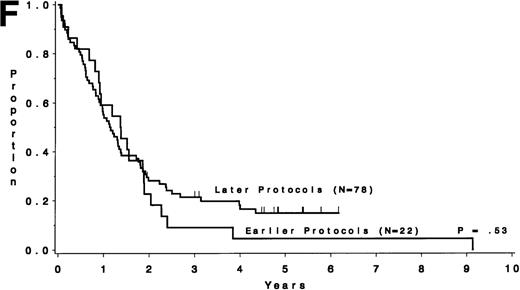
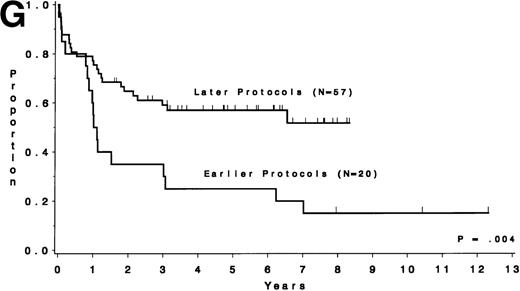
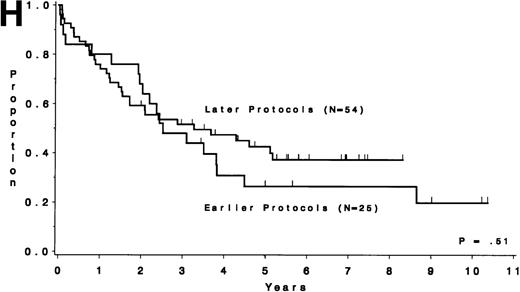
Table 5 compares the outcome by treatment protocols and by cytogenetic risk groups. When only the three earlier protocols (before 8811) are considered, the CR rates are 68% for the unfavorable risk group, 50% for the miscellaneous abnormalities group, and 68% for the normal group (P = .40). The probability of CCR at 5 years was .00 for the unfavorable risk group (all patients failed before 2 years), .30 for the miscellaneous abnormalities group, and .35 for the normal group (P < .001 for comparison of unfavorable and normal; P = .15 for comparison of unfavorable and miscellaneous; and P = .82 for comparison of miscellaneous and normal). The probability of survival at 5 years was .05 for the unfavorable risk group, .25 for the miscellaneous abnormalities group, and .26 for the normal group (P = .005 for comparison of unfavorable and normal; P = .63 for comparison of unfavorable and miscellaneous; and P = .55 for comparison of miscellaneous and normal). For the later protocols (8811 and after), the CR rates are 82% for the unfavorable risk group, 88% for the miscellaneous abnormalities group, and 89% for the normal group (P = .52). The probability of CCR at 5 years was .14 for the unfavorable risk group, .57 for the miscellaneous abnormalities group, and .39 for the normal group (P = .004 for comparison of unfavorable and normal; P < .001 for comparison of unfavorable and miscellaneous; and P = .43 for comparison of miscellaneous and normal). The probability of survival at 5 years was .15 for the unfavorable risk group, .57 for the miscellaneous abnormalities group, and .43 for the normal group (P = .001 for comparison of unfavorable and normal; P < .001 for comparison of unfavorable and miscellaneous; and P = .56 for comparison of miscellaneous and normal). Figure 5A through H shows the comparison between early and later protocols with respect to DFS and survival for each risk group. Thus, the change in therapy had its major impact in patients with miscellaneous cytogenetic abnormalities. It improved the CR rate for patients with normal cytogenetics and had no significant impact for patients with unfavorable risk cytogenetics.
DFS and overall survival by cytogenetic risk groups and treatment periods (earlier protocols: 8011, 8411, and 8513; later protocols: 8811, 9111, and 9311). (A through D) DFS; (E through H) overall survival. (A and E) all patients; (B and F) unfavorable risk group; (C and G) miscellaneous cytogenetic abnormalities group; (D and H) normal cytogenetics group.
DFS and overall survival by cytogenetic risk groups and treatment periods (earlier protocols: 8011, 8411, and 8513; later protocols: 8811, 9111, and 9311). (A through D) DFS; (E through H) overall survival. (A and E) all patients; (B and F) unfavorable risk group; (C and G) miscellaneous cytogenetic abnormalities group; (D and H) normal cytogenetics group.
Univariate analyses.
Table 4 depicts the results of univariate analyses for DFS and survival. For each category of the variables considered, the median times and estimated probabilities of remaining in CR for more than 5 years and surviving for at least 5 years are given, with 95% confidence intervals. With respect to DFS, the following variables were found to be significantly related to shorter remissions: unfavorable cytogenetic group (P < .001), higher log WBC count (P< .001), absence of a mediastinal mass (P < .001), age as a continuous variable (P < .001), and B or BMy immunophenotype (P = .01). Similarly, with respect to survival, unfavorable cytogenetic group (P < .001), higher log WBC count (P < .001), higher age when considered as a continuous variable (P < .001), absence of a mediastinal mass (P< .001), and B or BMy immunophenotype (P = .004) were significantly related to a poorer outcome.
Multivariate analyses.
To determine the relationship of these variables when considered jointly, stepwise multivariate analyses were performed with the Cox regression model. Because nearly complete data were available for all variables except FAB and immunophenotype, the first approach excluded these two variables. For DFS, analysis of 199 cases identified unfavorable cytogenetic group as the most significant factor related to shorter remission (P < .001). After adjusting for cytogenetic risk group, the other significant factors, in order selected to the model, were higher log WBC count (P < .001), absence of a mediastinal mass (P = .002), age (P = .008), and treatment protocol (P = .03), where the P values are adjusted for factors already in the model. Table 6 shows these results and gives the adjusted hazard ratios for each variable in the final model. For DFS, in a model also including immunophenotype (n = 161), expression of B or BMy markers was not associated with outcome after adjustment was made for these five significant factors (P = .16). In a model adding FAB (L1 or L2) (n = 184) instead of immunophenotype, there was additional prognostic information (L2 was associated with poor DFS) after adjusting for the five variables listed above (P = .03). For survival, analysis of 251 cases identified age as the most significant factor related to poor outcome (P < .001). After adjusting for age, the other significant factors, in the order selected to the model, were higher log WBC count (P < .001), absence of a mediastinal mass (P = .001), and treatment protocol (P = .02), where the P values are adjusted for factors already in the model (Table 6). After adjusting for age and log WBC, cytogenetics retains marginal prognostic significance (P = .051). For survival, in a model adding immunophenotype (n = 203), expression of B or BMy markers was not associated with outcome after adjustment was made for age, WBC, mediastinal mass, and treatment protocol (P = .20). In a model adding FAB (L1 or L2) (n = 228) instead, there was also no additional prognostic information after adjusting for these same variables listed above (P = .07).
Sequential chromosome analyses.
Chromosome analyses from diagnosis and at the time of first relapse were evaluable on 34 patient samples to study clonal evolution. Only samples obtained from the same tissue at diagnosis and at relapse, ie, either bone marrow or blood, were included. These patients were divided into two major groups. One group of 23 (68%) patients had a karyotype change upon relapse. These changes could be separated into four groups: (1) abnormal karyotype at diagnosis that changed to a normal karyotype at the time of relapse (n = 4); (2) abnormal karyotype at diagnosis that underwent clonal regression (n = 4); (3) abnormal karyotype at diagnosis that underwent clonal progression (n = 11); and (4) normal karyotype that evolved to an abnormal karyotype (n = 4). The second group consisted of 11 (32%) patients who had no change in karyotype upon relapse. This included 5 patients with abnormal karyotype at diagnosis that remained the same at the time of relapse and 6 patients with normal karyotype at diagnosis. Of 34 patients, 13 (38%) were in the unfavorable cytogenetic group [1 with t(4;11), 9 with t(9;22) of whom 1 had also +8 and another had −7, 1 with −7, and 2 with +8 and other structural abnormalities]. Ten of these 13 were in the group that developed a karyotypic change upon relapse; the other 3 had no karyotypic change upon relapse.
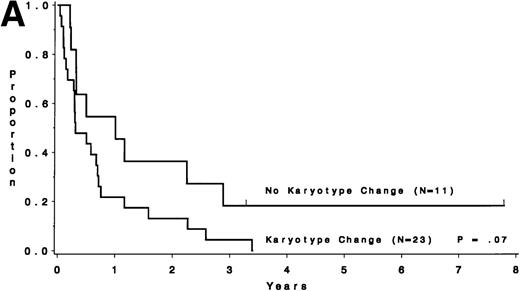
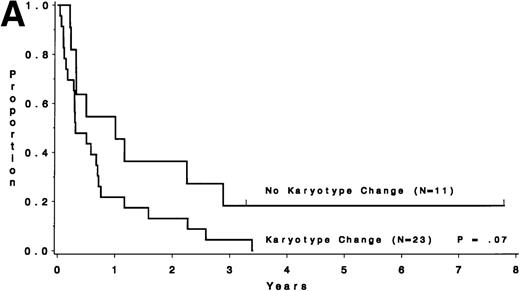
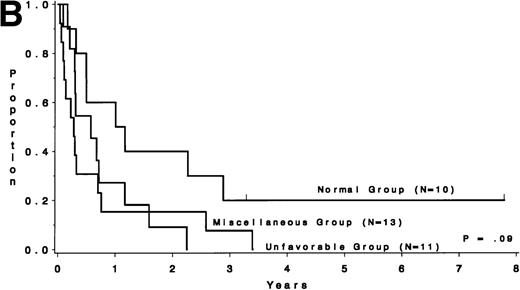
Survival after relapse was suggested to be longer for patients without a karyotype change (median, 9.0 months) than for those who had a different karyotype at the time of relapse (median, 3.6 months;P = .07; Fig 6A). Survival after relapse by cytogenetic group is shown in Fig 6B. The survival after relapse in the normal group is similar to that in the no karyotype group (Fig 6A) and is suggested to be longer than that for the miscellaneous and unfavorable groups (P = .09). There are 2 patients in the normal group who are surviving after relapse for at least 3 years. There was no difference in survival from study entry for these same patients (P = .18).
Survival after relapse by karyotype at first relapse. (A) Patients without a karyotype change (n = 11) had a median survival after relapse of 9.0 months, whereas those with a change (n = 23) had a median of 3.6 months (P = .07). (B) Survival after relapse by cytogenetic risk group.
Survival after relapse by karyotype at first relapse. (A) Patients without a karyotype change (n = 11) had a median survival after relapse of 9.0 months, whereas those with a change (n = 23) had a median of 3.6 months (P = .07). (B) Survival after relapse by cytogenetic risk group.
DISCUSSION
There are few reported studies looking at the prognostic significance of chromosome analysis in a large number of adult ALL patients.17-19 Our study emphasizes that karyotype remained an independent prognostic factor in adult ALL even after more intensified treatment regimens were introduced. However, in a multivariate analysis, karyotype retained its prognostic significance only for DFS and not for overall survival. We do not think that this discrepancy resulted from induction mortality, because the distribution of these events was comparable between the risk groups. After adjusting for age and log WBC, cytogenetics retains marginal prognostic significance with respect to survival.
Little data exist on the effect of the karyotypes after different treatments. The overall improvement in CR rate in the treatment protocols since 1988 is most probably related to the addition of cyclophosphamide. Furthermore, these more intensive regimens improved the outcome of patients with normal karyotype or miscellaneous cytogenetic abnormalities. However, they did not markedly change the poor outcome of patients with t(9;22), t(4;11), −7, or +8, for whom novel therapeutic approaches are urgently needed. The data suggest that karyotype should continue to be analyzed at diagnosis for all adult ALL patients and treatment be assigned according to the karyotype.
It is known that adult ALL patients with t(9;22) have a short CR duration and survival. Investigators at the University of Minnesota and Memorial Sloan-Kettering Cancer Center, using a variety of treatment regimens for induction and maintenance, showed a similar short median survival for patients with this translocation.20,21 Using vincristine, doxorubicin, and dexamethasone for an induction regimen followed by a 2-year rotating chemotherapy maintenance program and concluding with autologous BMT, investigators at M.D. Anderson Cancer Center also showed a median CR duration of only 7 months for patients with the t(9;22).22 Similar data were described in a clinical trial at the University of California at San Francisco, where multiple courses of non–cross-resistant chemotherapy were used after attainment of CR; the presence of the t(9;22) was associated with 100% risk of relapse within 3 years.23 Our results for patients with t(9;22) were similar whether they were treated before or after the initiation of CALGB 8811. Therefore, the t(9;22) continues to be a poor prognostic factor for patients with ALL and a major challenge for new therapies.
Patients with the t(4;11) are also known to have a poor outcome. They either fail to achieve remission or their disease relapses within the first year of therapy.24 The Groupe Francais de Cytogenetique Hematologique studied 443 adult patients and correlated the cytogenetic analyses with clinical data and outcome.18In their series, patients with t(9;22) and t(4;11) had median event-free survivals of 5 and 7 months, respectively. There were no long-term surviving patients in the t(9;22) and in the t(4;11) groups beyond 3 years and 1 year, respectively.
It is clear that other treatment modalities are needed for adults with t(9;22) and t(4;11) ALL. Allogeneic transplantation is currently the treatment of choice, providing CCR in 22% to 46% of transplanted patients with t(9;22).25-28 Similar data are available for patients with t(4;11) (IBMTR, unpublished data). Our data are compatible with this, because all our long-term survivors underwent BMT except for 1 patient. However, patients should be relatively young (<60 years old) and have a healthy and histocompatible donor to be candidates for allogeneic BMT. For those who do not meet these criteria, other treatment modalities are needed. Novel approaches have been suggested for patients with the t(9;22). These include the use of interleukin-4 that has been shown to exert inhibitory activity against cells with the t(9;22)29; CGP 57148, a synthetic protein kinase inhibitor that has been shown to induce complete inhibition of proliferation of colonies with the t(9;22) with no inhibition of normal colony formation30; and specific inhibitors of the fusionBCR/ABL mRNA such as ribozymes and antisense oligonucleotides.31 32 Clearly, novel approaches are also needed for patients with the t(4;11). In the meantime, allogeneic BMT is the only potentially curative therapy for these patients.
This is the first report to show that patients with trisomy 8 represent an unfavorable prognostic group in adult ALL even if they do not have t(9;22). Previous reports have presumably included patients with +8 along with patients who had miscellaneous cytogenetic abnormalities instead of analyzing them separately. Trisomy 8 as the sole abnormality is infrequent and has been described in 4 of 413 (1.0%), 3 of 350 (0.9%), and 2 of 256 (0.4%) adult ALL patients (The Groupe Francais de Cytogenetique Hematologique,18 Secker-Walker et al,19 and this study). A study of a larger cohort of patients analyzing the effect of −7 and +8 as independent prognostic factors in adult ALL patients is warranted.
Our study supports the concept that there may be some favorable cytogenetic abnormalities in adult ALL. Deletions or translocations of the short arm of chromosome 12 have been shown to represent a group with favorable prognosis in adult ALL, regardless of other prognostic factors, by Secker-Walker et al.19 In our study, it seems that this group was younger than the normal group. Because age is a known independent statistical prognostic factor for survival in adult ALL, additional studies looking at larger groups of patients with del(12p) or t(12p) are warranted. Similar to our data, the Groupe Francais de Cytogenetique Hematologique demonstrated that t(10;14)(q24;q11) conferred a better prognosis for adult ALL.18 However, to study the effect of rearrangement involving t(14q11-q13) as an independent prognostic factor, a larger study is needed. Identifying groups with favorable outcome has the potential of reducing treatment intensiveness and thus toxicity without negatively affecting treatment outcome.
Karyotypic changes at first relapse occurred in 68% of patients in the current study. Normal karyotype changing to an abnormal karyotype or the reverse may be the result of failing to identify the abnormal clone. However, because other groups reported sequential studies in patients with normal karyotype, we did the same. Although the number of patients analyzed at diagnosis and at relapse represents only a fraction of the total number of patients who relapsed, this is nevertheless the largest such series published. Similar degrees of karyotypic change have been described by Chucrallah et al33in 21 of 32 patients (66%) and by Secker-Walker et al34 in 11 of 21 patients (53%). The stability of unfavorable risk karyotypes as compared with miscellaneous karyotypes has been studied by all three groups, although the other groups did not include −7 or +8 as an unfavorable risk group. Similar to our findings, Chucrallah et al33 demonstrated that 5 of 6 patients with unfavorable risk cytogenetics were in the group that developed karyotypic changes at relapse, whereas only 1 patient in the unfavorable risk cytogenetic group had a stable clone at relapse. In contrast, Secker-Walker et al34 demonstrated that 4 of 4 patients with unfavorable risk abnormalities had stable clones at relapse. The numbers are small, but when combined, there were 23 patients with unfavorable risk abnormalities in all three series (Chucrallah et al,33Secker-Walker et al,34 and this study). Of these, 15 (65%) had a karyotypic change at relapse and 8 (35%) had stable karyotypes at relapse. Therefore, having an unfavorable risk karyotype does not necessarily suggest a higher probability for a change in karyotype at relapse. This implies that additional changes other than those detectable cytogenetically may be involved in the early relapse seen in these patients.
Our data support the observations reported by the M.D. Anderson Cancer Center group33 that survival after relapse was shorter for patients with changes in the karyotype. Our data were of marginal statistical significance but show a similar trend, based on relatively few patients. Our data do not support the findings of shorter survival from time of study entry. Continued cytogenetic evaluation at relapse is needed to evaluate further the significance of clonal evolution.
We conclude that adult patients with ALL with the t(9;22), t(4;11), −7, and +8 have a poor outcome even when more intensive therapeutic regimens are used. New treatment modalities are clearly needed for this group of patients. For relapsed ALL, patients with additional karyotypic changes may also represent an unfavorable risk group.
The following CALGB institutions, principal investigators, and cytogeneticists participated in this study (in alphabetical order): Columbia University (New York, NY), Rose R. Ellison and Ram S. Verma (Grant No. CA12011); Dana Farber Cancer Institute (Boston, MA), George P. Canellos and Ramana Tantravahi (Grant No. CA32291); Dartmouth Medical School (Lebanon, NH), Herbert Maurer and T.K. Mohandas (Grant No. CA04326); Duke University Medical Center (Durham, NC), Jeffrey Crawford and Mazin Qumsiyeh (Grant No. CA47577); Eastern Maine Medical Center (Bangor, ME), Thomas Ervin and Laurent Beauregard (Grant No. CA31946); Finsen Institute (Copenhagen, Denmark), Nis I. Nissen and Preben Philip; Long Island Jewish Medical Center (New Hyde Park, NY), Marc Citron and Prasad R.K. Koduru (Grant No. CA11028); Massachusetts General Hospital (Boston, MA), Michael L. Grossbard and Leonard Atkins (Grant No. CA12449); McGill Department of Oncology (Montreal, Quebec, Canada), Brian Leyland-Jones and Jacqueline Emond (Grant No. CA31809); Medical Center of Delaware Christiana Hospital (Newark, DE), Irving Berkowitz and Digamber Borgaonkar (Grant No. CA45418); Medical College of Virginia (Richmond, VA), John D. Roberts, Colleen Jackson-Cook and Judith A. Brown (Grant No. CA52784); Medical University of South Carolina (Charleston, SC), Mark R. Green and Eduardo Cantú; Mount Sinai Hospital (New York, NY), James F. Holland and Vesna Najfeld (Grant No. CA04457); New York Hospital-Cornell Medical Center (New York, NY), Ted P. Szatrowski and Ram S. Verma (Grant No. CA07968); North Shore University Hospital (Manhasset, NY), Daniel R. Budman and Prasad R.K. Koduru (Grant No. CA35279); Parkview Memorial Hospital (Fort Wayne, IN), David Sciortino and Patricia I. Bader; Rhode Island Hospital (Providence, RI), Louis A. Leone and Hon Fong Louie Mark (Grant No. CA08025); Roswell Park Cancer Institute (Buffalo, NY), Ellis G. Levine and AnneMarie W. Block (Grant Nos. CA37027 and CA59518); SUNY Health Science Center at Syracuse (Syracuse, NY), Stephan Graziano and Constance K. Stein (Grant No. CA21060); SUNY-Methodist Hospital of Brooklyn (New York, NY), Sameer Rafla and Ram S. Verma; University of Alabama at Birmingham (Birmingham, AL), Robert Diasio and Andrew J. Carroll (Grant No. CA47545); University of California at San Diego (San Diego, CA), Stephen Seagren and Renee Bernstein (Grant No. CA11789); University of Chicago Medical Center (Chicago, IL), Nicholas Vogelzang, Michelle M. LeBeau and D. Roulston (Grant No. CA41287); University of Iowa Hospitals (Iowa City, IA), Gerald Clamon and Shivanand R. Patil (Grant No. CA47642); University of Maryland Cancer Center (Baltimore, MD), Ernest Borden and Judith Stamberg (Grant No. CA31983); University of Massachusetts Medical Center (Worcester, MA), F. Marc Stewart and Vikram Jaswaney (Grant No. CA37135); University of Minnesota (Minneapolis, MN), Bruce A. Peterson and Diane C. Arthur (Grant No. CA16450); University of Missouri/Ellis Fischel Cancer Center (Columbia, MO), Michael Perry and Tim Huang (Grant No. CA12046); University of North Carolina at Chapel Hill (Chapel Hill, NC), Thomas C. Shea and Kathleen W. Rao (Grant No. CA47559); University of Tennessee (Memphis, TN), Alvin M. Mauer and Sugandhi A. Tharapel (Grant No. CA47555); Wake Forest University School of Medicine (Winston-Salem, NC), Robert M. Cooper and Mark J. Pettenati (Grant No. CA03927); Walter Reed Army Medical Center (Washington, DC), Nancy Dawson and Ratwal B. Surana (Grant No. CA26806); Washington University-Barnes Hospital (St Louis, MO), Daniel C. Ihde and Michael Watson (Grant No. CA47456).
Supported in part by National Cancer Institute Grants No. CA77658, CA16058, and CA31946 and by the Coleman Leukemia Research Fund (St Paul, MN). The contents are solely the responsibility of the authors and do not necessarily represent the official views of the National Cancer Institute.
The publication costs of this article were defrayed in part by page charge payment. This article must therefore be hereby marked “advertisement” in accordance with 18 U.S.C. section 1734 solely to indicate this fact.
REFERENCES
Author notes
Address reprint requests to Meir Wetzler, MD, Division of Medicine, Roswell Park Cancer Center, Buffalo, NY 14263; e-mail:wetzler@SC3101.med.buffalo.edu.


