The Kit and PDGFRa receptor tyrosine kinases are encoded in close proximity at the murine white spotting (W) and patch (Ph) loci. Whereas W mutations affect hematopoiesis, melanogenesis, and gametogenesis, the Ph mutation affects melanogenesis and causes early lethality in homozygotes. TheWsh, W57, and Phmutations diminish Kit expression in certain cell types such as mast cells and enhance it in others. The Wsh,W57, and Ph mutations arose from deletions and inversions affecting sequences in between the Kit andPDGFRa genes. We have determined the precise location of the breakpoint of the Wshinversion and the endpoints of the W57deletion upstream of the Kittranscription start site and examined the effect of these mutations on Kit expression in mast cells and hematopoietic stem cells and lineage progenitors. Our results indicate that positive elements controlling Kit expression in mast cells mapping in between −23 and −154 kb from the transcription start site can be dissociated from negative elements controlling Kit misexpression during embryonic development in the vicinity of the PDGFRa gene. In addition, we have identified two clusters of hypersensitive sites in mast cells at −23 −28 kb and −147 −154 kb from the Kit gene transcription start site. Analysis of these hypersensitive sites in mutant mast cells indicates a role for HS4-6 in Kit expression in mast cells. These findings provide a molecular basis for the phenotype of these Kit expression mutations and they provide insight into the complex mechanisms governing the regulation ofKit expression.
THE Kit RECEPTOR TYROSINE kinase (RTK) is encoded at the white spotting (W) locus on mouse chromosome 5.1,2W mutations affect hematopoiesis, melanogenesis, and gametogenesis. In agreement with the pleiotropic functions of the Kit receptor kinase in several cell systems during embryonic development and in the adult animal, Kit expression is restricted to distinct cell types in which the Kit receptor is known to function, including: hematopoietic cell types, primordial germ cells, spermatogonia, oocytes, melanoblasts, melanocytes, neuronal cell populations, and interstitial cells of Cajal.3 4 Therefore, the study of the mechanisms that control Kit expression in various cell types is of great interest.
Many different W mutations have been identified and characterized. Most of these mutations are structural Kitmutations or null mutations that affect the different cellular functions similarly.3,5,6W mutations that affectKit expression have been characterized as well. The study of such mutations provides the opportunity to gain insight into the mechanism of tissue-specific Kit expression. Wsh,Wbd, W57, and Ph areKit mutations that diminish Kit expression in certain cell types and enhance it in others. The Wsh andWbd mutations affect only melanogensis and tissue mast cells and therefore these mice are fertile and not anemic, but they are black-eyed whites and lack tissue mast cells.7,8Whereas the mast-cell deficiency in Wsh mice results from lack of Kit expression, enhanced Kitexpression in somitic dermatomes at the time of melanoblast migration from the neural crest to the periphery may cause the pigmentation defect.9,10Ph/+ mice exhibit a pigmentation deficiency similar to that of heterozygousWsh/+ mice. Our previous analysis showed that the pigmentation deficiency in Ph/+ mice may also arise from an effect of the Ph mutation on Kit expression during embryogenesis.11 The W57 mutation exerts a weak effect on melanogenesis and mast-cell numbers, but does not affect erythropoiesis and gametogenesis. This mutation diminishes Kit expression in mast cells as well as in some other cell types.12,13 These observations suggested that theWsh, W57, and Phmutations affect some of the same distant 5′ upstream elements controlling Kit gene expression.9 10
The Kit RTK gene comprises 21 exons contained in 70 kb and maps on mouse chromosome 5 in the vicinity of the receptor tyrosine kinasesPDGFRa and flk1.1,2,14 Long-range mapping previously placed PDGFRa 200 to 400 kb 5′ of Kitand flk1 400 kb 3′ of Kit. The molecular basis of the Wsh, Wbd,W57, and Ph mutations had been investigated by using pulsed-field gel electrophoresis (PFGE). Both theWsh and Wbd mutations were shown to derive from the inversion of a 2 cmol/L segment of mouse chromosome 5 with a proximal breakpoint between the Tec and theGabrb1 genes and a distal breakpoint between the PDGFRagene and Kit.9,11,13,15 The Ph mutation was shown to arise from deletion of the entire PDGFRagene16 and the W57 mutation from deletion of an 80 kb segment in between the PDGFRa andKit genes.13 Furthermore, the Kit coding sequence is not altered in the Wsh,Wbd, and W57alleles.9 13
Enhancers and promoters of transcriptionally active genes are usually associated with chromosomal regions that are in an open configuration and are sensitive to nuclease digestion (DNase I hypersensitive sites).17,18 Chromatin remodeling, the interaction of transcription factors with cis-acting regulatory sequences contained in DNase I hypersensitive sites and their interaction with the general transcription machinery are essential steps in tissue-specific gene expression.19 20 Therefore, the identification of DNase I hypersensitive sites may serve as an important first step in unraveling mechanisms governing this process. To gain insight into mechanisms controlling Kit expression, we have investigated the molecular basis of the Wsh, W57, and Phmutations and determined the precise location of the 3′ breakpoint of the Wsh inversion and the endpoints of the W57 deletion. This information enabled us to identify two clusters of hypersensitive sites near theW57 deletion endpoints at −21 to −28kb and at −147 to −154kb upstream of the c-kit transcription start site in mast cells. In Wsh andW57 mast cells the 3′ hypersensitive sites, HS4, HS5, and HS6, were found to be in a closed configuration implying a critical role for these sites in mediating c-kit expression in mast cells. These findings provide a molecular basis for the phenotype of these Kit expression mutations and they provide insight into the complex mechanisms involved in the regulation of Kit gene expression.
MATERIALS AND METHODS
Mice.
C57BL/6J and C57BL/6 Ph/+ mice were purchased from the Jackson Laboratory (Bar Harbor, ME). C57BL/6Wsh/Wsh were originally obtained from Rudolf Jaenisch (Massachusetts Institute of Technology, Cambridge, MA) and C57BL/6 Ph/Wsh mice were provided by Katia Manova.
Isolation and characterization of P1 clones.
Hybridization probes were derived by polymerase chain reaction (PCR) amplification of various regions upstream of the Kit transcription start site and used to screen a murine P1 library (Genome Systems, St Louis, MO). PCR reactions were performed in a 50 mL reaction volume using Perkin Elmer-Cetus (Norwalk, CT) recommendations. In the initial screening of the library, one clone was identified. P1 recombinant plasmid DNA was prepared using a modified alkaline lysis procedure (P1 manual; Genome Systems). The DNA was digested with different enzymes and analyzed using PFGE or conventional electrophoresis. For the isolation of P1 end sequences, we used the plasmid rescue method. The P1 DNA was digested with a restriction enzyme with a 6 base pair recognition sequence, that did not digest the vector internally (Sac1, XbaI, BamH1). The vector was recircularized, ligated, and used to transform Esherichia Coli. The insert sequence was determined and used to derive hybridization probes for rescreening of the P1 library. More than 5 P1 clones were isolated to characterize more than 200 kb of upstream Kit sequences.
PFGE.
The preparation of samples for PFGE, enzyme digestions, and electrophoresis was as described previously.9 After electrophoresis gels were stained with EtBr for 30 minutes, exposed to ultraviolet light for 20 seconds, destained for 15 minutes, and soaked in 0.4 mol/L NaOH and 1.5 mol/L NaCl for 15 minutes. DNA was transferred to Zeta-Probe Nylon membranes from Bio-Rad (Hercules, CA) in 0.4 mol/L NaOH and 1.5 mol/L NaCl overnight. After blotting, the membranes were washed in 0.5 mol/L Tris for 5 minutes and then in 2× SSC (1× SSC: 150 mmol/L NaCl, 15 mmol/L EDTA). Filters were prehybridized in 0.72 mol/L sodium chloride, 40 mmol/L sodium phosphate pH 7.6, 4 mmol/L EDTA, 0.2% polyvinylpyrrolidone, 0.2% ficoll 400, 0.1% sodium dodecyl sulfate (SDS), 2 mg denatured salmon sperm DNA at 65°C, and hybridized in 0.72 mol/L sodium chloride, 40 mmol/L sodium phosphate pH 7.6, 4 mmol/L EDTA, 0.2% polyvinylpyrrolidone, 0.2% ficoll 400, 0.1% SDS, 2 mg denatured salmon sperm DNA, and 10% dextran sulfate with 106 cts/min/mL at 65°C overnight. Filters were washed 15 minutes at room temperature in 2 × SSC , 0.1% SDS, and 3 × 30 minutes in 0.1 × SSC and 0.1% SDS at 65°C.
Cell culture.
Mast cells were grown from bone marrow of adult mice in RPMI 1640 supplemented with 10% fetal calf serum (FCS), 10% conditioned medium from X63 interleukin (IL)-3 producing cells, nonessential amino acids, sodium pyruvate. Nonadherent cells were harvested and fed weekly and maintained at a cell density of 5 × 10⁵cells/mL.33 HCD57 cells were kindly provided by Harvey Lodish (MIT) and they were grown in Iscoves’s modified Dulbecco’s medium (IMDM) supplemented with 20% FCS and 1UmL−1eosinophil peroxidase (EPO). The Melan-a cell line was kindly provided by Dot Bennett (St George Hospital Medical School, London, UK) and they were grown in RPIM 1640 supplemented with 10% FCS and 200 nmol/L 12-o-tetradecanoylphorbol-13 acetate (TPA).
RNA and DNA isolation and blot analysis.
Total cellular RNA was extracted from each of the samples by treatment with guanidine-HCl followed by phenol extraction and ethanol precipitation according with the method of Chirgwin et al.22 Total cellular RNA was fractionated in 1% agarose-formaldehyde gels, transferred to nylon membranes (Nytran; Schleicher and Schuell, Keene, NH), and prehybridization and hybridization performed as previously described.23,24The murine 3.7 kb Kit complementary DNA (cDNA) labeled with32P-dCTP, prepared by the random primer method, was used as a probe for hybridization.25
Genomic DNA was extracted from samples by treatment with SDS and proteinase K followed by extraction with phenol/chloroform and ethanol precipitation.26 Conditions for DNA transfer, prehybridization, hybridization, and washing were the same as for PFGE.
Preparation of nuclei.
Nuclei were prepared as described by Siebenlist et al.27Approximately 2 × 10⁸ mast cells or HCD57 cells were harvested, washed in cold phosphate-buffered saline (PBS), and resuspended in 10 mL of ice-cold nuclear isolation buffer (60 mmol/L KCL, 15 mmol/L NaCl, 5 mmol/L MgCl2, 0.1 mmol/L ethyleneglycoltetracetic acid (EGTA), 15 mmol/L Tris-HCl (pH 7.4), 0.5 mmol/L dithiothreitol (DTT), and 0.1 mmol/L phenylmethylsulfonyl fluoride (PMSF). Cells were disrupted by mixing in 0.7 mL of a cold 10% Igepal CA-630. This solution was then layered onto 27 mL of ice-cold nuclear isolation buffer containing 1.5 mol/L sucrose. Nuclei were collected by sedimentation at 3,000 rpm. The procedure to isolate nuclei from liver was essentially as described. One gram of liver was homogenized using a Dounce homogenizer in 10 mL of a buffer containing 10 mmol/L hepes pH 7.6, 16 mmol/L KCl, 0.15 mmol/L spermine, 0.5 mmol/L spermidine, 1 mmol/L EDTA, 1.5 mol/L sucrose, 10% glycerol, 0.5 mmol/L DTT, 0.5 mmol/L PMSF, 1% Igepal CA-630. The homogenate was layered onto 27 mL of the above solution and sedimented in an SW24 rotor at 24,000 rpm.
DNAse l digestion of nuclei.
The nuclear pellet was resuspended in 1 mL of a solution containing 10 mmol/L tris pH 7.5, 1.5 mmol/L MgCl2, 250 mmol/L sucrose, 0.5 mmol/L DTT, 1 mmol/L PMSF, and 5% glycerol. The nuclei were counted and aliquoted in a volume of 500 mL each and digested with 0.025 mg/mL of DNAse l (Worthington, Lakewood, NJ) for 2, 3, 4, 6, 8, and 10 minutes at 37°C and the reaction was terminated by addition of 100 mL of 250 mmol/L of EDTA, 300 mL of 1% of SDS and 0.1 mg/mL proteinase K. DNA was subsequently isolated by repeated organic extractions and ethanol precipitations. Restriction digests, electrophoresis, transfer of DNA, and hybridization were performed as described above.
Antibodies.
Monoclonal antibodies against the following surface molecules were used: biotin-labeled anti-CD3 (145-2C11), biotin-labeled anti-B220 (RA3-6B2), biotin-labeled anti–Mac-1 (M1/70), biotin-labeled anti-GR1 (8C5), biotin-labeled anti-erythroid antigen (TER119), phycoerythrin (PE)-labeled anti–Sca-1 (E13), fluorescein isocyanate (FITC)-labeled anti-Kit (2B8 and ACK2). Biotinylated lineage cocktail antibodies were visualized with streptavidin Per CP (Becton Dickinson, Mountain View, CA).
Preparation and staining of bone marrow and bone marrow mast cells (BMMC).
Bone marrow was obtained by flushing the femurs and tibias with PBS containing 2% calf serum. Erythrocytes were eliminated by lysis with NH4Cl. The remaining cells stained with the indicated combinations of antibodies. Cell were stained in PBS with 2% calf serum for 15 minutes on ice, washed in PBS with 2% calf serum, and centrifuged through a serum layer. The labeled cells were analyzed with single-laser fluorescence-activated cell sorter (FACS; Becton Dickinson). Kit expression of BMMC was determined using FITC-labeled anti-Kit ACK2 antibodies.
RESULTS
Molecular cloning of the Kit upstream region and characterization of the breakpoint and deletion endpoints of theWshand W57mutations.
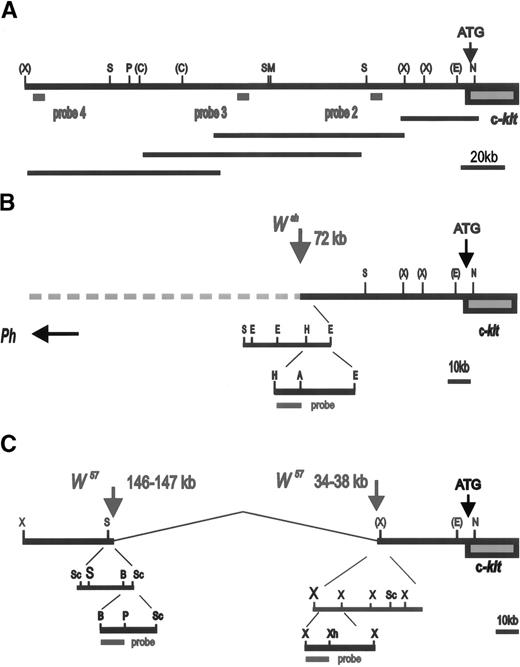
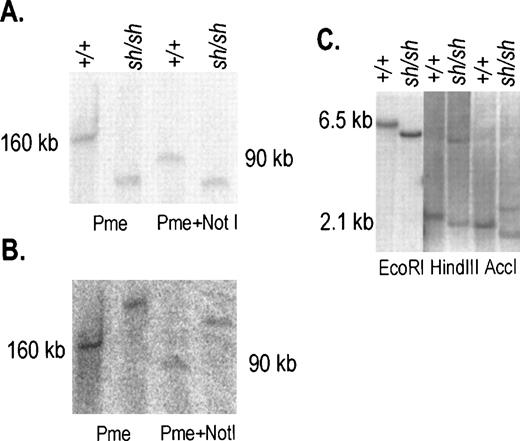
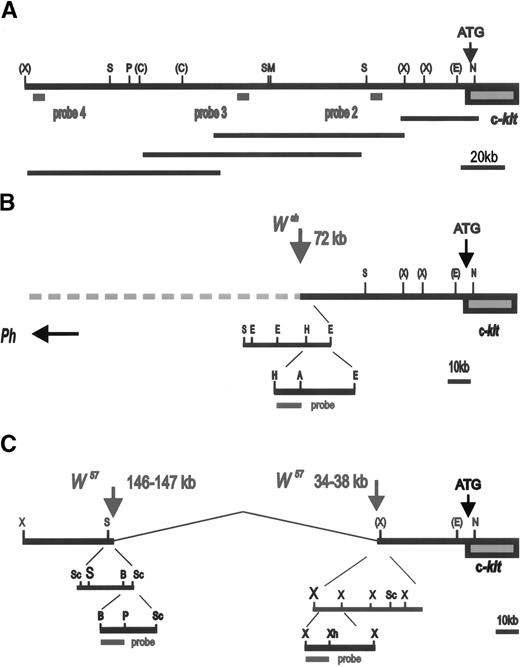
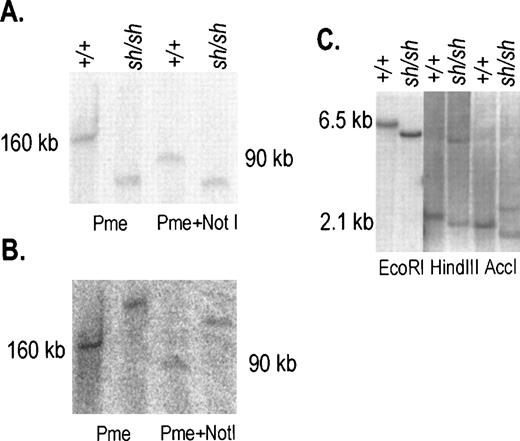
We had previously identified the Wsh breakpoint in the upstream region of the Kit gene by using PFGE.11 In addition, an 80 kb deletion in the Kit upstream region was recently reported in the W57 allele.13 To define the nature of these two mutations more precisely, 200 kb of the Kit upstream region was molecularly cloned by identifying overlapping P1 clones obtained from Genome Systems and a map was established with several restriction enzymes (Fig 1A). DNA from control and Wsh/Wsh mice was digested with the enzymes Pmel and Pmel+Notl, resolved by PFGE and then transferred to a blotting membrane. Blots were hybridized with various probes corresponding to Kit upstream sequences (Fig 1A). Probe 2 consisting of a Kpnl-Alul fragment located at −24 Kb upstream from the Kit transcription start site, detected a Pmel fragment of 160 Kb and a Pmel+Notl fragment of 90 kb in control DNA, in contrast in Wsh/Wsh DNA smaller fragments were detected (Fig 2A). Hybridization of the same blot with probe 3 consisting of aXbal-Bglll fragment located at −106 kb from the Kit transcription start site, identified the same restriction fragments in control DNA as with probe 2, whereas inWsh/Wsh DNA two larger fragments were detected (Fig 2B). These results suggested that the 3′Wsh/Wsh breakpoint is located between the two probes. To characterize the breakpoint more precisely, blots containing control and Wsh/Wsh DNA digested with several restriction enzymes and resolved by agarose gel electrophoresis were hybridized with different probes derived from sequences between the Alul-Kpnl and the XbaI-BglII probes. A 0.9 kb Hindlll-Accl fragment corresponding to sequences at −72 kb from the Kit transcription start site identified distinct Wsh/WshEcoR1, HindIII, and AccI fragments defining theWsh breakpoint at −72 kb (Fig 1B, 2C). InHindIII and AccI digested Wsh/Wsh DNA (Fig 2 C), two fragments were detected that we presume to represent breakpoint fragments from both the two endpoints of the inversion.
Schematic representation of W/Kit upstream region: (A) Restriction map of Kit upstream region. Sites for the restriction enzymes Not1 (N), EcoR1 (E), XbaI (X),SalI (S), MluI (M), ClaI (C ),PmeI (P), HindIII (H), AccI (A), Sac1 (Sc), BamH1 (B), PstI (Ps) are indicated. Sites for restriction enzymes determined for the entire region are shown without brackets. Sites for enzymes for which only a partial map exists are indicated with brackets. Scale in kilobases is shown. The relative position and size of overlapping P1 clones used to establish this restriction map is shown below. (B) Scheme used for the determination of the Wsh breakpoint. The relative position of probes used is indicated. A 0.9 kbHindIII-AccI fragment located at −72 kb was used to identify Wsh breakpoint. (C) Schematic of the identification of the W57deletion endpoints located −34 to −38 kb and −146 to −147 kb upstream of the Kit transcription start site. The 0.6 kbBamH1-PstI and the 0.8 kb Xbal-Xhol probes used for the identification of the 5′ and the 3′, respectively, deletion endpoints are indicated.
Schematic representation of W/Kit upstream region: (A) Restriction map of Kit upstream region. Sites for the restriction enzymes Not1 (N), EcoR1 (E), XbaI (X),SalI (S), MluI (M), ClaI (C ),PmeI (P), HindIII (H), AccI (A), Sac1 (Sc), BamH1 (B), PstI (Ps) are indicated. Sites for restriction enzymes determined for the entire region are shown without brackets. Sites for enzymes for which only a partial map exists are indicated with brackets. Scale in kilobases is shown. The relative position and size of overlapping P1 clones used to establish this restriction map is shown below. (B) Scheme used for the determination of the Wsh breakpoint. The relative position of probes used is indicated. A 0.9 kbHindIII-AccI fragment located at −72 kb was used to identify Wsh breakpoint. (C) Schematic of the identification of the W57deletion endpoints located −34 to −38 kb and −146 to −147 kb upstream of the Kit transcription start site. The 0.6 kbBamH1-PstI and the 0.8 kb Xbal-Xhol probes used for the identification of the 5′ and the 3′, respectively, deletion endpoints are indicated.
Characterization of the 3′ inversion breakpoint inWsh/Wsh DNA. (A, B) DNA from spleen cells was prepared in agarose plugs, digested with the restriction enzymes PmeI and PmeI+Not1 and resolved by PFGE. The blot was hybridized sequentially with probes 2 and 3 (see Fig 1A), panels A and B, respectively. In +/+ DNA both probes identified same-size fragments. In contrast in Wsh DNA the two probes identified two different fragments. (C) Hybridization of a blot containing Wsh/Wsh and +/+ DNA digested with EcoR1, HindIII, and AccI and hybridized with the 0.9 kb HindIII-AccI probe (see Fig1B) corresponding to sequences at −72 kb identified fragments of distinct sizes in Wsh/Wsh. Size markers are indicated.
Characterization of the 3′ inversion breakpoint inWsh/Wsh DNA. (A, B) DNA from spleen cells was prepared in agarose plugs, digested with the restriction enzymes PmeI and PmeI+Not1 and resolved by PFGE. The blot was hybridized sequentially with probes 2 and 3 (see Fig 1A), panels A and B, respectively. In +/+ DNA both probes identified same-size fragments. In contrast in Wsh DNA the two probes identified two different fragments. (C) Hybridization of a blot containing Wsh/Wsh and +/+ DNA digested with EcoR1, HindIII, and AccI and hybridized with the 0.9 kb HindIII-AccI probe (see Fig1B) corresponding to sequences at −72 kb identified fragments of distinct sizes in Wsh/Wsh. Size markers are indicated.
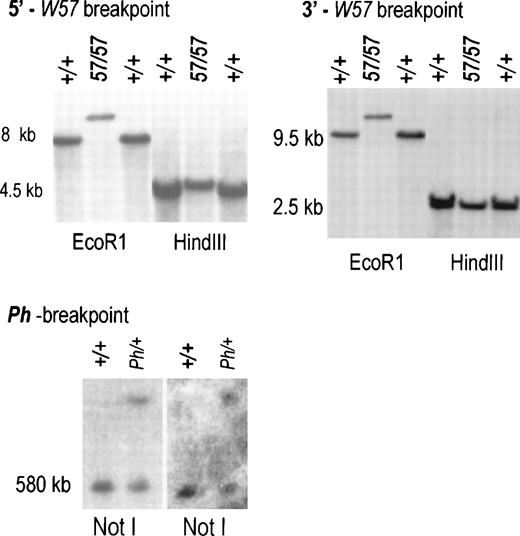
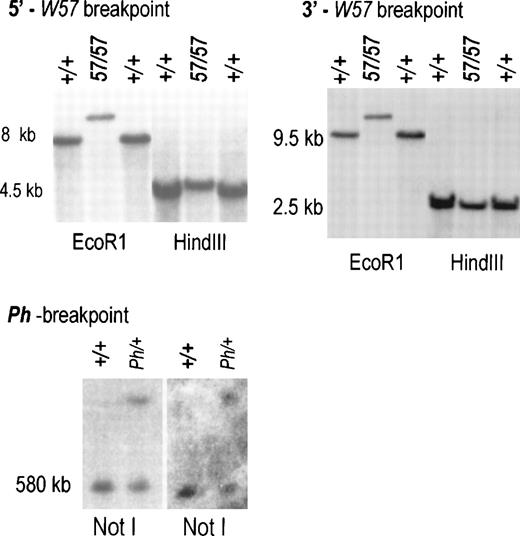
To identify the W57 deletion endpoints, PFGE and regular Southern blots containingW57/W57 and control DNA digested with various enzymes were hybridized with a panel of probes corresponding to upstream Kit sequences. A BamHl-Pstl fragment corresponding to sequences at −148 kb identified distinct W57/W57EcoR1 andHindIII fragments defining the 5′ deletion endpoint at −146−147 kb (Fig 1C, 3A). AnXbal-Xhol fragment corresponding to sequences at −34 kb identified the same polymorphic EcoRl fragment as the 5′ BamHl-Pstl probe (Figs 1C and 3B). Therefore, theW57 3′ deletion endpoint is located −34 to −38 kb from the Kit transcription start site. In agreement with this conclusion, an XbaI-XbaI probe corresponding to sequences at −39 kb was unable to detect any fragments in W57 DNA.
Characterization of deletion endpoints inW57/W57 and Ph/+ DNA. (A) Blot hybridization using a 0.6 kb BamH1-PstI probe corresponding to sequences at −147 kb showed novel DNA fragments inW57 DNA digested with the restriction enzymesEcoR1 and HindIII (see Fig 1C). (B) Blot hybridization using a 0.8 kb XbaI-Xhol probe corresponding to sequences at −34 identified the same EcoRl fragment as theBamHl-Pstl probe (see Fig1C). PFGE analysis of high molecular weight DNA from +/+ and Ph/+ mice digested with Not1. Sequential hybridization with probes 2 and 4 (see Fig 1) is shown. Identical fragments were detected in Ph DNA with both probes. Size markers are indicated.
Characterization of deletion endpoints inW57/W57 and Ph/+ DNA. (A) Blot hybridization using a 0.6 kb BamH1-PstI probe corresponding to sequences at −147 kb showed novel DNA fragments inW57 DNA digested with the restriction enzymesEcoR1 and HindIII (see Fig 1C). (B) Blot hybridization using a 0.8 kb XbaI-Xhol probe corresponding to sequences at −34 identified the same EcoRl fragment as theBamHl-Pstl probe (see Fig1C). PFGE analysis of high molecular weight DNA from +/+ and Ph/+ mice digested with Not1. Sequential hybridization with probes 2 and 4 (see Fig 1) is shown. Identical fragments were detected in Ph DNA with both probes. Size markers are indicated.
The Ph mutation arose as a result of a deletion of the PDGFRa chain gene. The 3′ endpoint of this deletion lies in between the PDGFRa and the Kit genes, but its precise location is not known. To further define the 3′ Ph deletion endpoint, a PFGE blot containing Ph/+ and control DNA digested with Not I was hybridized with probe 2 and then with probe 4, a Hindlll fragment corresponding to sequences at −200 kb from the Kit transcription start (Fig 1A). Both probes identified identical control and Ph restriction fragments, indicating that the 3′ deletion endpoint in thePh allele is located more than 200 kb upstream of theKit transcription start site (Fig 3C).
Effect of the Wsh, W57, andPh mutations on Kit expression in mast cells and in hematopoietic progenitors.
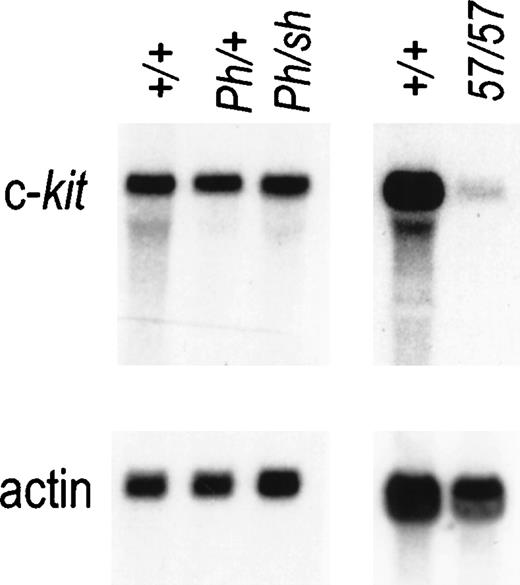
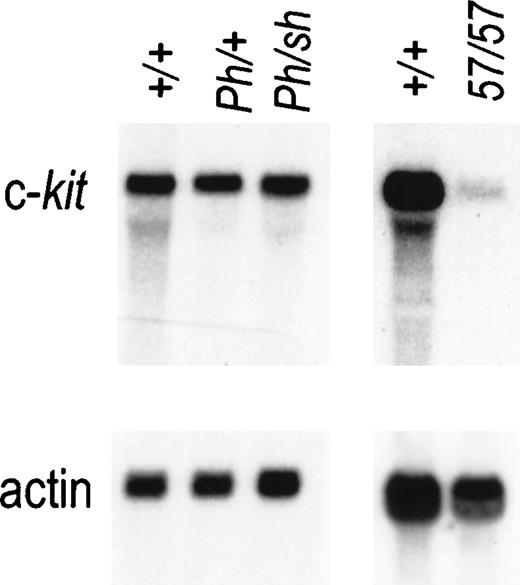
Although the Wsh and Ph mutations both cause ectopic Kit expression in dermatomal cells during embryonic development,9,11 the Wsh andW57 mutations abolish9 or severely diminish13 Kit expression in mast cells, and mutant mice have a mast-cell deficit (Fig 4). It was therefore of interest to determine whether the Ph mutation affects Kit expression in mast cells as well. Because homozygousPh/Ph mutant mice die early during embryogenesis, we chose to analyze Kit RNA expression in BMMC derived fromPh/Wsh mice. The levels of Kit RNA in normal and mutant mast cells determined by Northern blot analysis are shown in Fig 4. The Kit RNA levels inPh/Wsh mast cells are comparable to those in +/+ and Ph/+ BMMC, implying that the Phmutation does not affect Kit expression in these cells.
Expression of Kit RNA in mast cells from +/+,Ph/+, Ph/Wsh, andW57/W57 mice. Total RNA prepared from bone marrow–derived mast cells was fractionated by gel electrophoresis and analyzed by blot hybridization. Total cellular RNA (10 mg) was used per lane and hybridization was performed with a Kit cDNA probe. Hybridization with an actin probe is shown below to indicate equal loading.
Expression of Kit RNA in mast cells from +/+,Ph/+, Ph/Wsh, andW57/W57 mice. Total RNA prepared from bone marrow–derived mast cells was fractionated by gel electrophoresis and analyzed by blot hybridization. Total cellular RNA (10 mg) was used per lane and hybridization was performed with a Kit cDNA probe. Hybridization with an actin probe is shown below to indicate equal loading.
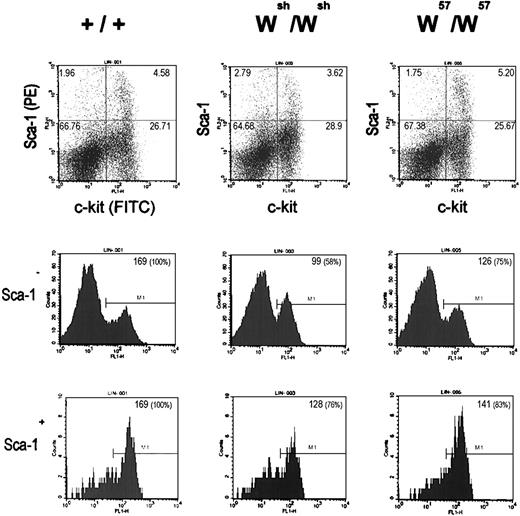
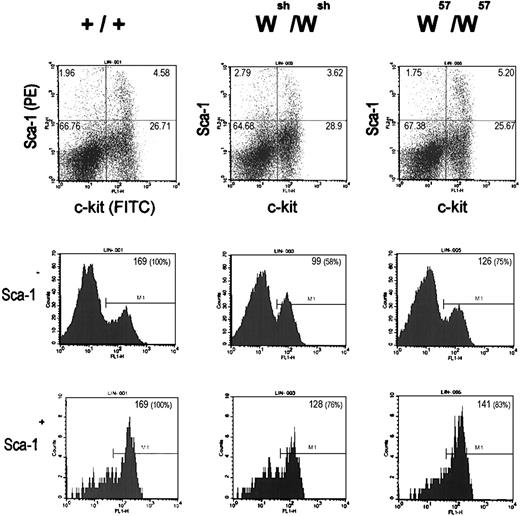
Hematopoietic stem cells and progenitors of the lymphoid, myeloid, and erythroid lineages, as well as mast cells, all express high levels of the Kit gene products. Because Kit expression is abolished or diminished in mast cells from Wsh andW57 mutant mice, it was of interest to determine whether Kit expression levels in hematopoietic stem cells and lineage progenitors were affected in Wsh andW57 mutant mice. For this purpose, Kit protein expression levels in lineage minus Sca+ and Sca− bone marrow cells from Wsh,W57, and C57Bl6/J mice were determined by FACS (Fig 5). Although the size of the Sca+, Kit+ and Sca−, Kit+ cell populations were comparable in the bone marrow from Wsh, W57, and C57Bl6/J mice, the mean fluorescent intensity of these cell populations was diminished in both the samples from the Wsh andW57 mutant mice. The relative levels of Kit expression in the Wsh/Wshlin−, Sca+, Kit+, and lin−, Sca−, and Kit+compared with normal C57Bl6 bone marrow cells was 76% and 58%, respectively, and in W57/W57bone marrow cells, Kit expression levels were less reduced, 83% and 75%, respectively. These results imply that control elements affected by these mutations are necessary to obtain normal levels of Kitexpression in hematopoietic stem cells and progenitor cell populations.
Flow cytometric analysis of wild-type (+/+), Wsh/Wsh, andW57/W57 lin − bone marrow progenitor cells. Dot plots (top) displaying Sca-1 (PE) and Kit (FITC) surface expression of lin − bone marrow progenitor cells from +/+ (left),Wsh/Wsh (center), andW57/W57 (right) mice. The number in the top corner of quadrants indicates subpopulation percentages. Histograms show Kit (FITC) surface expression in the Sca-1 − fraction (middle) and the Sca-1+ fraction (bottom) of lin− bone marrow progenitor cells from +/+ (left), Wsh/Wsh (center), and W57/W57 (right) mice. The number in the top right corner of histogram boxes indicates mean fluorescence of the particular gate.
Flow cytometric analysis of wild-type (+/+), Wsh/Wsh, andW57/W57 lin − bone marrow progenitor cells. Dot plots (top) displaying Sca-1 (PE) and Kit (FITC) surface expression of lin − bone marrow progenitor cells from +/+ (left),Wsh/Wsh (center), andW57/W57 (right) mice. The number in the top corner of quadrants indicates subpopulation percentages. Histograms show Kit (FITC) surface expression in the Sca-1 − fraction (middle) and the Sca-1+ fraction (bottom) of lin− bone marrow progenitor cells from +/+ (left), Wsh/Wsh (center), and W57/W57 (right) mice. The number in the top right corner of histogram boxes indicates mean fluorescence of the particular gate.
Identification of DNase 1 hypersensitive sites in the vicinity of the W57 deletion endpoints.
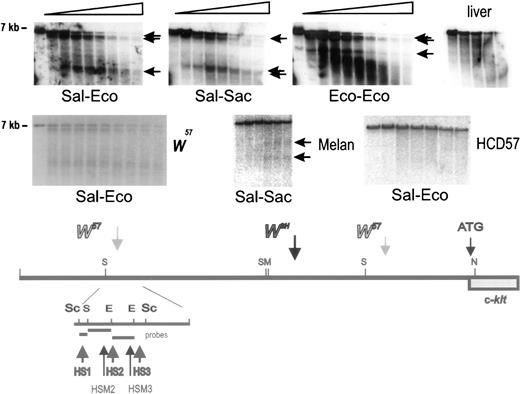
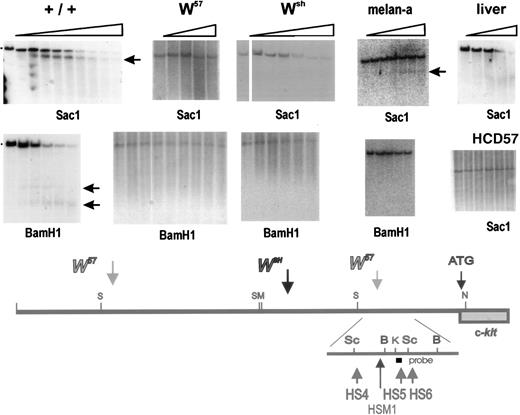
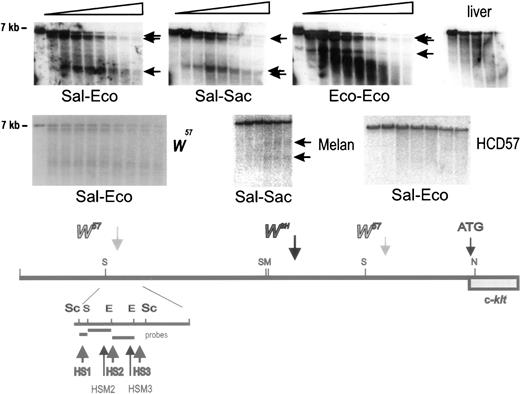
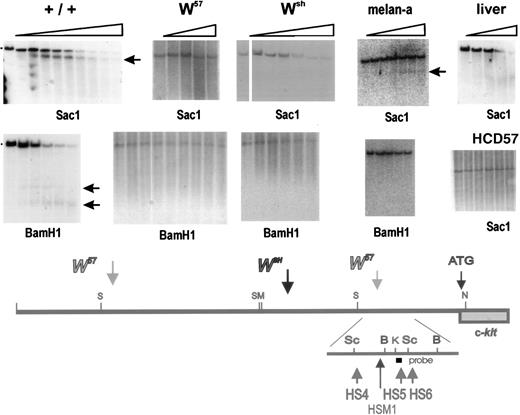
Because in W57/W57 mutant miceKit expression in mast cells is severely diminished (Fig4),13 and in Wsh/Wsh mice Kit expression is abolished completely,9 it seemed reasonable to presume that mast cell control elements were located in the vicinity of the W57 deletion endpoints. To identify these elements, we performed a DNase1 hypersensitive site analysis with nuclei isolated from normal BMMC, Kit-expressing erythroid HCD57 cells, Kit-expressing melan-a cells (a melanocyte cell line), and liver as a negative control for Kit expression. Nuclei were digested with DNase 1 for increasing time periods and DNA isolated from these nuclei was digested with different restriction enzymes, and analyzed by blot hybridization using various probes. These analyses showed one cluster of at least three hypersensitive sites (HS1, HS2, HS3) upstream of the 5′ W57deletion endpoint, and a second cluster of three hypersensitive sites (HS4, HS5, HS6) downstream of the 3′ deletion endpoint in normal BMMC (Figs 6 and 7) and three hypersensitive sites (HSM1, HSM2, HSM3) in the melanocyte cell line melan-a. To detect the 5′ hypersensitive sites, we used three different probes (Sal-Eco, Sal-Sac, and Eco-Eco) contained within a 5.5 kb Sac fragment corresponding to sequences located at −147−154 kb from the Kit transcription start site (Fig 6). A Kpn-Alu probe corresponding to sequences located at −24 kb, identified the hypersensitive site HS4 in a Sacl fragment, and the hypersensitive sites HS5 and HS6 in a BamHl fragment in DNA from BMMC (Fig 7). Analysis of nuclei from melan-a cells detected three new hypersensitive sites, HSM1-3, two sites, HSM2 and HSM3, in the 5′ cluster at −150 kb, and one site, HSM1, in the 3′ cluster at −24 kb (Fig 6 and 7). However, no hypersensitive sites were detected when nuclei from Kit-expressing erythroid HCD57 cells or Kit-negative liver cells were analyzed (Figs 6and 7). Analysis of these upstream hypersensitive sites in mutant mast cells enabled us to investigate their role in directing Kitexpression in mast cells more precisely. Interestingly, DNase I hypersensitive site analysis with nuclei from mutantW57/W57 andWsh/Wsh BMMC indicated that the 3′ hypersensitive sites HS4, HS5, and HS6 were in a closed configuration in both mutant BMMC and no hypersensitive site was generated, suggesting that this hypersensitive site may be important for mast cell–specific Kit expression (Fig 7). In contrast, the 5′ hypersensitive sites HS1, HS2, and HS3 inW57/W57 BMMC remained in an open configuration (Fig 6).
Identification of DNase I hypersensitivity site cluster at −147 −154 kb in upstream Kit region. Nuclei were prepared from +/+ BMMC, HCD57 cells, melan-a cells and liver, and digested with DNaseI for increasing periods of time. Subsequently, DNA was restricted with Sac1, fractionated by electrophoresis and analyzed by blot hybridization using different probes. The Sal-Eco, Sal-Sac, and Eco-Eco hybridization probes derived from a Sac1 restriction fragment at −147 −154 kb detected a cluster of hypersensitive sites in mast cells (BMMC) and two sites in melan-a cells in the vicinity of the 5′W57 breakpoint. DNA from liver nuclei contained no hypersensitive sites in this region. Size markers are indicated. A schematic representation of the hypersensitive sites in the distal Kit promoter region around −147 −154 kb is shown below.
Identification of DNase I hypersensitivity site cluster at −147 −154 kb in upstream Kit region. Nuclei were prepared from +/+ BMMC, HCD57 cells, melan-a cells and liver, and digested with DNaseI for increasing periods of time. Subsequently, DNA was restricted with Sac1, fractionated by electrophoresis and analyzed by blot hybridization using different probes. The Sal-Eco, Sal-Sac, and Eco-Eco hybridization probes derived from a Sac1 restriction fragment at −147 −154 kb detected a cluster of hypersensitive sites in mast cells (BMMC) and two sites in melan-a cells in the vicinity of the 5′W57 breakpoint. DNA from liver nuclei contained no hypersensitive sites in this region. Size markers are indicated. A schematic representation of the hypersensitive sites in the distal Kit promoter region around −147 −154 kb is shown below.
Identification of DNase I hypersensitive sites at −23 −28 kb in the upstream Kit region. Nuclei were prepared from +/+,Wsh/Wsh andW57/W57BMMC and from Kit expressing HCD57 and melan-a cells and liver, and digested with DnaseI. DNA was restricted with the restriction enzymes Sac1 and BamH1 (as indicated), fractionated by electrophoresis, and analyzed by blot hybridization. A Kpnl-Alul probe detected one hypersensitive site in the Sac1 fragment located at −23 −28 kb in +/+ BMMC, near the 3′ W57 deletion endpoint. No hypersensitive site was detected in DNA from W57and Wsh BMMC and from liver nuclei. The same Kpnl-Alul probe detected two hypersensitive sites in theBamHl fragment located at −21 −25 in +/+ that were absent in W57 BMMC. Whereas in DNA from melan-a cells HS4-6 were absent, a new hypersensitive site HSM1 was detected. Horizontal arrows identify sub-bands generated by hypersensitive sites. Size markers are indicated. A schematic representation of the hypersensitive sites in the distal Kit promoter region around −21 to −28 kb is shown below.
Identification of DNase I hypersensitive sites at −23 −28 kb in the upstream Kit region. Nuclei were prepared from +/+,Wsh/Wsh andW57/W57BMMC and from Kit expressing HCD57 and melan-a cells and liver, and digested with DnaseI. DNA was restricted with the restriction enzymes Sac1 and BamH1 (as indicated), fractionated by electrophoresis, and analyzed by blot hybridization. A Kpnl-Alul probe detected one hypersensitive site in the Sac1 fragment located at −23 −28 kb in +/+ BMMC, near the 3′ W57 deletion endpoint. No hypersensitive site was detected in DNA from W57and Wsh BMMC and from liver nuclei. The same Kpnl-Alul probe detected two hypersensitive sites in theBamHl fragment located at −21 −25 in +/+ that were absent in W57 BMMC. Whereas in DNA from melan-a cells HS4-6 were absent, a new hypersensitive site HSM1 was detected. Horizontal arrows identify sub-bands generated by hypersensitive sites. Size markers are indicated. A schematic representation of the hypersensitive sites in the distal Kit promoter region around −21 to −28 kb is shown below.
DISCUSSION
The Kit gene is expressed and functions in several hematopoietic cell types, including lineage progenitors, megakaryocytes, mast cells, gametogenesis, melanogenesis, neuronal cell populations, and interstitial cells of Cajal. Thus, understanding of the mechanisms controlling the temporal and spatial expression ofKit both during embryogenesis and in the adult is of great importance. In this study, we have determined the molecular basis of three different W mutations known to affect Kitexpression differentially: Wsh,W57, and Ph. Previous analysis of theWsh, W57, and Phmutations by PFGE showed that they were formed as a result of an inversion of a 2 cmol/L segment of mouse chromosome 5 with one breakpoint located between the Kit and the PDGFRagenes, an 80-kb deletion located between the Kit and PDGFRa genes and deletion of the entire PDGFRa receptor gene, respectively. Our analysis localizes the Wsh breakpoint to −72 kb and the W57 deletion endpoints to −34−38 and −146−147 kb, respectively. Furthermore, the Ph deletion endpoint was determined to be more than 200 kb upstream of the kit transcription start site. In a recent study, another pigmentation mutation Rw that is associated with a 30 cmol/L inversion of mouse chromosome 5 was shown to have a distal breakpoint located between −160 and −220 kb from the Kit transcription start site.36
Chromosomal deletions and/or rearrangements are known to cause position effects and influence tissue-specific expression of genes over long distances. Position effects may arise by several mechanisms. First, juxtaposition of euchromatic (transcriptionally active) with heterochromatic (transcriptionally silent) regions in chromosomes may affect the expression of genes in the vicinity of breakpoints. Second, position effects may arise as a result of a rearrangement whereby a gene and its regulatory regions are placed next to regulatory elements of another gene thus affecting its expression. Third, position effects may interrupt cis-regulatory elements involved in the control of tissue-specific gene expression.28 The phenotypes that result from the chromosomal rearrangements and/or deletions found in the Wsh, Wbd, W57, Ph, and Rw. alleles are consistent with cell-type–specific position-effect mutations.29 Thus, in these mutant mice, chromosomal rearrangements or deletions may either remove part of the regulatory region of the Kit gene or affect chromatin conformation preventing the binding of trans-acting factors to cis-regulatory elements.
Previously, we showed ectopic Kit expression at distinct sites during embryogenesis in Wsh and Ph mutant mice.9 11 These observations suggested that inWsh, Wbd, and Ph mice tissue-specific silencers involved in the regulation of Kitexpression during embryonic development were lost or inactivated. Based on our mapping of the 3′ extent of the Ph deletion, these negative control elements that are active during embryogenesis probably lie more than 200 kb upstream from Kit. The presence of positive tissue-specific regulatory elements is supported by the finding that Kit expression is abolished or greatly diminished in mast cells derived from of Wsh, Wbd, and W57 mutant mice. The positive elements controlling Kit expression in mast cells could be located between −34−38 kb and −146−147 kb and may be affected in the Wsh, Wbd, andW57 mutations. These positive elements are not affected by the Ph mutation, because mast cells from Ph/+ andPh/Wsh mutant mice exhibit normal levels ofKit RNA expression. The observation of a slight but significant reduction of Kit expression in hematopoietic stem cells and progenitors in both Wsh and W57mutant mice further suggests that the upstream elements, affected by both the Wsh and the W57mutations, are necessary for optimal Kit expression in these cells.
The chromatin in the vicinity of actively transcribed genes may be altered, giving rise to short regions that are hypersensitive to nucleases. We have used endonuclease DNase l sensitivity as a means to identify and correlate changes in chromatin conformation in theKit upstream region with tissue-specific transcription of theKit gene. A cluster of at least three hypersensitive sites, HS1, HS2, and HS3 was identified between −147 and −154 kb and another cluster of three hypersensitive sites, HS4, HS5, and HS6 between −23 and −28 kb upstream of the Kittranscription start site, in Kit-expressing normal BMMC, but not in Kit-expressing erythroid HCD57 cells and melanocyte-derived melan-a cells and Kit-negative liver cells. Interestingly, hypersensitive sites HS4, HS5, and HS6 were found to be in a closed configuration in BMMC isolated from Wshand W57 homozygous mutant mice. These results suggest that we have identified control elements that may be critical for Kit expression in mast cells. Furthermore, we identified three additional hypersensitive sites, HSM1, HSM2, and HSM3, in the melanocyte cell line, melan-a, within the 5′ and the 3′ hypersensitive site clusters. Because of their respective localizations within the 5′ and 3′ hypersensitive site clusters it is tempting to speculate that HSM1-3 have a role forKit expression in melanocytes.
The finding of tissue-specific hypersensitivity sites in the upstreamKit region is reminiscent of the locus-control region (LCR) of the β-globin locus. The globin LCR contains 4 hypersensitive sites and directs position-independent and copy-number–dependent expression of β-globin transgenes.30,31,32 The hypersensitive sites within the LCR have been ascribed distinct functions. HS3 directs an activity that opens and remodels chromatin structure. Other sites display enhancer activity.33,34 Furthermore, the factors binding to these hypersensitive sites in the LCR synergize with each other to produce optimal levels of β-globin expression.33 35 By analogy, the hypersensitive sites we have identified may be part of a LCR that controls Kitexpression in mast cells. In Wsh the 5′ hypersensitive site region is displaced, hypersensitive sites HS4, HS5, and HS6 are in a closed configuration and Kit expression in mast cells is abolished, wherease in W57 the 5′ hypersensitive sites (HS1, HS2, and HS3) are in an open configuration, the 3′ hypersensitive sites HS4, HS5, and HS6 are in a closed configuration in mast cells and Kit expression in mast cells is diminished. Hypersensitive site HS4, HS5, and HS6 may be in a closed configuration, in both the Wsh and theW57 mutations, because they require an interaction with upstream elements located in the displaced chromosomal segments to mediate Kit expression in mast cells. In addition, these results imply that the 5′ and the 3′ hypersensitive sites in the Kit upstream region may function in synergy to produce optimal Kit expression in mast cells. Future studies will be aimed at the elucidation of the nature of the hypersensitive sites HS1-HS6 and the mechanism by which they control Kit expression.
ACKNOWLEDGMENT
We thank Drs Frederic Gilles and Andre Goy for helpful technical advice and discussions and Dr Katia Manova for mutant mice and discussions, Dr Jeffrey Ravetch for letting us use his FACS machine and discussions, and Drs Dale Dorsett, Rosemary Bachvarova, and Elizabeth Lacy for numerous stimulating discussions. We thank Dr Dot Bennett for the melan-a cells, Dr Harvey Lodish for HCD57 cells, and Dr Shin-Ichi Nishikawa for a gift of ACK2 MoAb. We also thank Rose Manziano for her dedicated help in the preparation of many reagents.
Supported by grants from the National Institutes of Health and the National Cancer Institute, R37 CA32926 and RO1-HL/DK55748 (P.B.).
The publication costs of this article were defrayed in part by page charge payment. This article must therefore be hereby marked “advertisement” in accordance with 18 U.S.C. section 1734 solely to indicate this fact.

