Abstract
Tumor-related immunoglobulin heavy-chain (IgH) rearrangements are markers for polymerase chain reaction (PCR) detection of minimal residual disease (MRD) in B-cell malignancies. Nested PCR with patient IgH allele-specific oligonucleotide primers can detect 1 tumor cell in 104 to 106 normal cells. In childhood acute lymphoblastic leukemia (ALL), persistence of PCR-detectable disease is associated with increased risk of relapse. The clinical significance of qualitative PCR data can be limited, however, because patients can harbor detectable MRD for prolonged periods without relapse. Recent studies indicate that a quantitative rise in tumor burden identifies patients who are at high risk for relapse. Therefore, an efficient and reliable PCR method for MRD quantification is needed for ALL patients. We have developed a real-time PCR method to quantify MRD with IgH VH gene family consensus fluorogenically labeled probes. With this method, a small number of probes can be used to quantify MRD in a large number of different patients. The assay was found to be both accurate and reproducible over a wide range and capable of detecting approximately 1 tumor cell in 5 × 10⁴ normal cells. We demonstrate that this methodology can discriminate between patients with persistence of MRD who relapse and those who do not. This technique is generally applicable to B-cell malignancies and is currently being used to quantify MRD in a number of prospective clinical studies at our institution.
Although patients with B-cell malignancies can achieve clinical complete remission, many ultimately relapse. These relapses result from residual cancer cells that persist in patients below the limits of detection by standard techniques. Therefore, considerable effort has been directed at developing techniques that sensitively detect minimal residual disease (MRD). In B-cell malignancies, polymerase chain reaction (PCR) assays have been established that use tumor-specific immunoglobulin heavy-chain (IgH) or T-cell receptor rearrangements as markers of disease.1-4 These highly sensitive assays have the potential to detect 1 malignant cell in up to 106 normal cells. PCR detection of MRD holds the promise not only of providing important prognostic information regarding clinical outcome, but could also be a useful tool for monitoring patients' response to therapy.5-8 If PCR methods are capable of clearly identifying patients at risk for relapse, the goal of therapy could be the achievement of a “molecular complete remission” and the therapeutic endpoint for treatment could be determined by PCR.9 Additionally, if MRD detection is established as a surrogate marker of subsequent relapse, such assays could be used to rapidly evaluate experimental treatment approaches for the management of cancer.
The clinical significance of PCR-detectable MRD, however, is not always clear. Patients with a variety of malignancies can have long-term persistence of PCR-detectable MRD without relapse.10-12Recent studies in acute lymphoblastic leukemia (ALL) have indicated that both MRD levels and the kinetics of tumor reduction early in therapy may be more informative of a patient's risk of relapse than simple detection.5,13,14 Thus, it is desirable to develop and use methods that can quantitatively assess the levels and dynamics of MRD rather than simply its presence or absence. Several methods are available that permit a quantitative or semiquantitative assessment of MRD levels, including limiting dilutions and various competitive PCR strategies.6 15-20 The application of these quantitative assays to large studies can be limited, however, by their low throughput because of their requirement for extensive post-PCR processing and relatively limited dynamic range.
Real-time quantitative PCR is a method that has been developed to address deficiencies of traditional quantitative PCR strategies.21-23 This method exploits the 5′-3′ nuclease activity associated with Taq polymerase and uses a fluorogenically labeled target-specific DNA probe. This probe is designed to anneal between the forward and reverse oligonucleotide primers used for PCR amplification. The nuclease activity of Taq polymerase cleaves the labeled probe during the extension phase of PCR amplification, producing a fluorescent signal that can be detected in solution. The amount of fluorescence produced in a reaction by this method is proportional to the starting DNA target number during the early phases of amplification. Thus, when this reaction is performed on a combined thermal cycler/sequence detector such as the PE Biosystems 7700 (Foster City, CA), a quantitative assessment of input target DNA copy number can be made in the tube as the reaction proceeds. This method eliminates the need for post-PCR sample processing and thereby greatly increases throughput. Real-time PCR also reduces the potential for false positive results by adding the additional level of specificity provided by the hybridization of a probe to sequences internal to amplification primers and offering a closed tube assay system. Significant for purposes of MRD studies, real-time PCR has a relatively wide dynamic range. Thus, it is possible to accurately quantify MRD in samples with greatly differing levels of tumor contamination.
Real-time quantitative PCR has been applied to the assessment of MRD levels in several diseases in which chromosomal translocations are the targeted tumor marker.24-27 Under these circumstances, 1 or several probes are suitable for MRD quantitation of a large number of different patients. Its application to MRD quantitation when IgH rearrangements are the targeted marker, however, is not as simple. The assembly of IgH genes from their constituent variable (VH), diversity (DH), and joining (JH) regions creates a DNA target that is complex and unique to each patient. Although the use of patient-specific probes is possible,28this approach would be prohibitively expensive for large studies because of the high cost of producing an individual fluorogenically labeled probe specific for each patient.
In the present report, we describe an assay that uses a limited number of probes designed to consensus sequences in the framework region 3 (FR3) of the VH gene families. These probes are used together with patient IgH allele-specific oligonucleotides (ASO) for real-time PCR reactions to detect and quantify MRD. This assay allows the application of an accurate and reliable quantitative method to the study of the clinical significance of MRD in large patient studies and, in addition, can be applied to a number of B-cell malignancies.
Materials and methods
Patients, samples, and cell lines
Patient samples were obtained from children undergoing initial therapy for ALL. Bone marrow and peripheral blood samples were available at the time of diagnosis and at intervals during their treatment. Institutional review board approval was obtained for the treatment protocol as well as for procurement of samples. The ALL cell lines NALM-6 and 697 were a kind gift from Jerome Ritz (Dana-Farber Cancer Institute, Boston, MA).
DNA sample preparation
Mononuclear cells were isolated by Ficoll gradient centrifugation (Pharmacia, Uppsala, Sweden) and then lysed and DNA-extracted as previously described.29 Prior to PCR amplification, DNA samples were heated at 96°C for 10 minutes to denature proteinase K.
Polymerase chain reaction
To identify patient tumor-related and cell-line IgH rearrangements, genomic DNA extracted from cell lines or patient diagnostic samples was PCR-amplified using a series of 7 VH family FR1 consensus primers and a JH consensus primer in a modification of a method previously described.2 Individual VHfamily consensus primers were used to ensure that all sequences from patients with oligoclonal rearrangements were identified at diagnosis for subsequent use in MRD analyses. PCR amplifications were performed in 100 μL with 1 to 2 μg of genomic DNA, 10 μL of 10 × PCR Buffer II: 100 mM of Tris-HCl, pH 8.3; 500 mM of KCl (PE Biosystems); 10 μL of 25 mM MgCl2 (PE Biosystems); 200 μM each of dATP, dCTP, dTTP, and dGTP; 1.25 units of AmpliTaq DNA polymerase (PE Biosystems); and 20 pmol of VH and JH consensus primers. Amplifications were performed on a Perkin Elmer DNA Thermal Cycler 9600 as follows: 94°C for 1 minute, 62°C for 30 seconds, and 72°C for 30 seconds for 30 cycles, followed by a 7-minute final extension at 72°C before cooling to 4°C. “Hot start,” to increase specificity, was achieved either by the use of AmpliTaq Gold (PE Biosystems) or the addition of Ampliwax PCR Gem wax beads (PE Biosystems). A total of 15 μL of the completed reactions were electrophoresed on 3% agarose gels with ethidium bromide and visualized under UV light. Amplification of clonal rearrangements gave a sharp band of the 300 to 350 base pairs. Well-established precautions were taken to prevent carryover contamination of PCR reactions.30
Clonal PCR products were excised and purified using Wizard PCR Preps (Promega, Madison, WI). Purified PCR fragments were sequenced directly by the Molecular Biology Core Facility at the Dana-Farber Cancer Institute with a Perkin Elmer/Applied Biosystems AB 373A DNA Sequencer (PE Biosystems). The relevant VH family and JH consensus primers were used as sequencing primers to obtain the sequence information from both strands, and sense and antisense sequences were aligned. VH, DH, JH, and regions of N-nucleotide addition were identified by BLAST Search network service (National Center for Biotechnology Information, Bethesda, MD). Antisense CDRIII region patient ASO primers were designed to have annealing temperatures of approximately 60°C and synthesized by Gibco BRL (Gaithersburg, MD). Seminested PCR amplification was then performed as previously described using ASO primers for each IgH sequence identified at diagnosis for each patient.31
Patient standard and GAPDH plasmid construction
Patient tumor and cell-line IgH sequences were PCR-amplified as described above and cloned using TA Cloning Kits (Invitrogen, Carlsbad, CA) following recommended procedures. Briefly, about 10 ng of fresh PCR product was ligated to 20 ng of pCR2.1 overnight at 16°C. TOP10F'-competent Escherichia coli were transformed with 20% of the ligation reaction and plated on LB agar with 100 μg/mL of ampicillin, which were spread with 40 μL of 40 mg/mL X-gal and 40 μL of 100-mM IPTG for blue/white selection. A small number (8 to 16) of white colonies were analyzed by PCR to identify clones bearing recombinant plasmids. Recombinant plasmids were recovered with Wizard Plus Miniprep DNA purification system (Promega) and sequenced as described above to confirm their identity.
To construct the glyceraldehyde-3-phosphate dehydrogenase (GAPDH) plasmid, a 175–base pair fragment spanning exons 3 and 4 of the GAPDH genomic locus was amplified using the forward primer 5′-gtattgggcgcctggtcac-3′ and reverse primer 5′-ctcctggaagatggtgatgg-3′. PCR amplifications were performed in 50-μL volumes with 0.5 μg of target DNA, 5 μL of 10 × PCR Buffer II: 100 mM of Tris-HCl, pH 8.3; 500 mM of KCl (PE Biosystems); 5 μL of 25 mM MgCl2 (PE Biosystems); 200 μM each of dATP, dCTP, dTTP, dGTP; 1.25 units of AmpliTaq DNA polymerase (PE Biosystems); and 20 pmol of each primer. Samples were amplified in a Perkin Elmer DNA Thermal Cycler 9600 as follows: 94°C for 3 minutes, 30 cycles of the following: denaturation at 94°C for 30 seconds, annealing at 60°C for 30 seconds, extension at 72°C for 30 seconds, with a final extension cycle at 72°C for 7 minutes. This fragment was cloned using TA Cloning Kits as described above and the resulting plasmid sequenced to confirm its identity.
TaqMan probes
TaqMan probes were synthesized by PE Biosystems. The IgH probes were labeled at the 5′ end with 6-carboxy fluorescein (FAM) and 6-carboxy-tetramethyl rhodamine (TAMRA) at the 3′ end. The GAPDH probe was labeled at the 5′ end with 2,7-dimethoxy-4,5-dichloro-6-carboxy-fluorescein (JOE) and TAMRA at the 3′ end. Probes were aliquoted to 20 μL and stored at −20°C until use.
Real-time quantitative PCR
Quantitative PCR analysis was performed using the TaqMan PCR Core Reagent Kit (PE Biosystems). Reactions for patient tumor-related IgH quantitation were performed in 50 μL with about 250 ng of DNA; 5 μL of 10 × TaqMan Buffer A (500 mM of KCl; 100 mM of Tris-HCl, pH 8.3); 5 μL of 25 mM MgCl2; 200 μM each of dATP, dCTP, dTTP, dGTP; 0.5 U uracil-N-glucosidase (UNG); 1.25 U of Platinum Taq DNA polymerase (Gibco BRL); 100 nM of TaqMan probe; and 400 nM of VHconsensus and patient ASO primers. Wherever possible, the following FR3 VH consensus primers were used to limit the size of amplicons: VH1Q 5′-GAAG- TTYCAGGGCAGRGTCAC-3′, VH2Q 5′-CATCTCTGAAGAGCAGG- CTC-3′, VH3Q 5′-GGCCGRTTCACCATCTCC-3′, VH4Q 5′-CCCTCAAG- AGTCGAGTYACC-3′, VH5Q 5′-GTCCTTCCAAGGCCAGGTC-3′, and VH6Q 5′GTCGAATAACCATCAACCCAG-3′. The amplification conditions for quantitation were an initial 2 minutes of incubation at 50°C (to allow UNG to destroy any contaminating templates), 10 minutes at 95°C (to activate the enzyme), 3 cycles of denaturation at 97°C for 15 seconds, annealing/extension at 60°C for 1 minute (to ensure optimal denaturation of genomic DNA), followed by 37 cycles of denaturation at 95°C for 15 seconds and annealing/extension at 60°C for 1 minute. The amplifications were performed on an ABI Prism 7700 sequence detector equipped with a 96-well thermal cycler. Data were collected and analyzed with Sequence Detector v1.6 software (PE Biosystems). Reactions for quantifying GAPDH copy number were performed exactly as described above except for the use of the forward primer 5′-caaagctggtgtgggagg-3′, reverse primer 5′-ctcctggaagatggtgatgg-3′, and the GAPDH probe described above. IgH values were corrected for the values obtained for GAPDH from the same DNA samples to obtain the values reported. Briefly, the mean of experimentally obtained GAPDH copy numbers obtained from a sample run in triplicate was divided by the expected value based on the amount of DNA added to a reaction to obtain a GAPDH normalizing value. Triplicate experimental IgH copy number values were then individually divided by this normalizing value and the mean reported as IgH/GAPDH normalized.
Statistical analysis
For each dilution, Fisher's sign test was used to evaluate accuracy and test the null hypothesis that the observed IgH copies equals the expected IgH copies (in log 10 scale).32 Corresponding 95% confidence intervals for each dilution were constructed. Wilcoxon rank-sum test was used to determine the reproducibility between days by testing the difference observed between days. Nonparametric 95% confidence intervals for the difference of each dilution were also constructed. All P values were 2-sided.
Results
Consensus probes
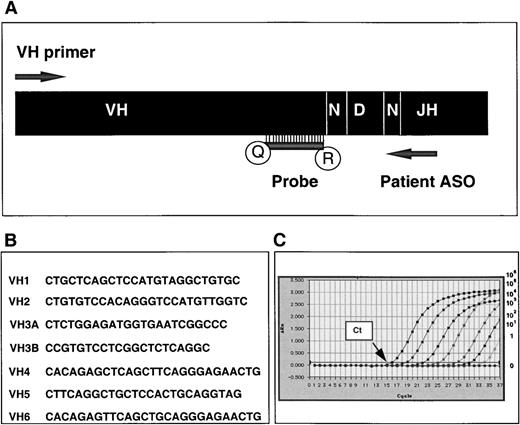
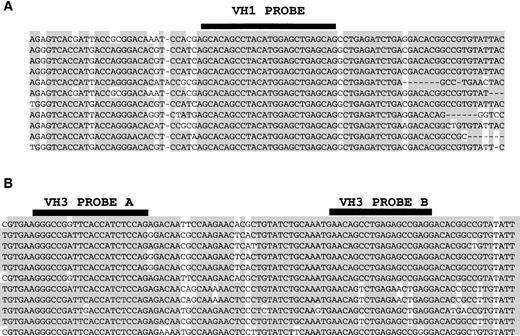
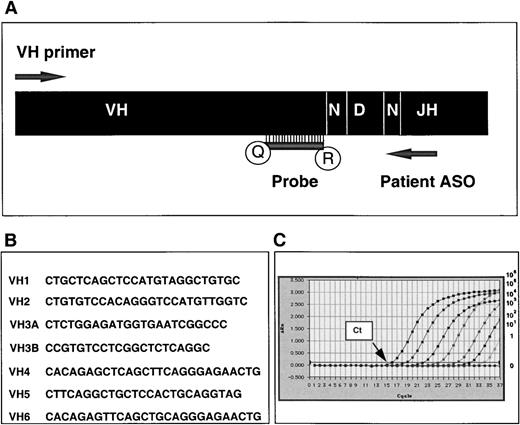
A major factor limiting the use of TaqMan real-time quantitative PCR for MRD studies in B-cell malignancies is the high cost of producing probes unique to each patient's tumor-specific IgH rearrangement. We therefore sought to design probes to consensus sequences in the variable gene (VH) region of IgH rearrangements to reduce the number of probes required for MRD studies in large numbers of patients. Although it is possible to design probes to JHgenes,33 we felt that deletions in this region, which can at times accompany VDJ recombination, might limit their broad use as consensus probes. To identify sequences within each of the major VH gene families appropriate for the design of consensus TaqMan probes, 151 clonal IgH rearrangements from pediatric ALL patients were PCR-amplified and sequenced. These sequences were characterized, grouped by VH gene family, and aligned by GeneJockey II software (data not shown). Sequences were aligned from 20 VH1, 11 VH2, 76 VH3, 23 VH4, 4 VH5, and 17 VH6 patient sequences. Short regions of sequence identity or homology in the FR3 were selected that met the criteria established by PE Biosystems for TaqMan probes (no 5′ G residue, no runs of more than 3 consecutive G residues, and a melting temperature of about 70°C). Figure 1 illustrates the design of probes for both VH1 and VH3 IgH gene families. While short regions of sequence identity appropriate for the design of a single probe were found for VH1, VH2, VH4, VH5, and VH6, this was not possible for the large and diverse VH3 gene family. Therefore, 2 probes were designed for patients with VH3 IgH rearrangements in regions of sequence homology. These probes appear to be functional for most ALL patients with VH3 rearrangements, although additional probes may be needed to quantify all possible VH3 rearrangements. Antisense probes were designed in all cases so that PCR extension from the antisense patient ASO primers would result in cleavage of the fluorescent-labeled probe (Figure 2A). The sequences of the consensus IgH probes are shown in Figure 2B. These probes were tested in quantitation reactions on serially diluted patient IgH plasmids, and each gave a characteristic sigmoid amplification plot (representative data shown in Figure 2C). Here, it can be seen that each dilution has a unique threshold cycle number (Ct) where increasing fluorescence produced by cleavage of the probe during PCR amplification rises above the background level of fluorescence and that this number has an inverse relationship with plasmid copy number.
Alignment of ALL patients' tumor-related VH1 and VH3 IgH sequences to illustrate design of consensus IgH probes.
Alignments show FRIII VH consensus regions to which TaqMan probes (reverse complement) are designed. (A) Alignment of 11 VH1 tumor-related IgH sequences showing consensus sequence of the VH1 TaqMan probe. (B) Alignment of 11 VH3 tumor-related sequences showing the sequences to which 2 VH3 TaqMan probes are designed.
Real-time PCR quantification strategy for IgH tumor-related sequences and TaqMan probe sequences.
(A) Quantitative PCR is performed with appropriate VHconsensus primer, patient tumor-specific (ASO) primer, and VH gene family-specific consensus TaqMan probe. Antisense probes are labeled at the 5′ end with reporter dye (R) 6-carboxy fluorescein (FAM) and at the 3′ end with quencher activity (Q) 6-carboxy-tetramethyl rhodamine (TAMRA). (B) Sequences of VH gene family-specific consensus TaqMan probes. (C) Representative amplification plot showing increasing fluorescence (ΔRn) detected through the final 37 cycles of a 40-cycle PCR amplification reaction on a 10-fold serial dilution of a plasmid-encoded tumor-related VH5 IgH sequence with the VH5 consensus probe (IgH copy numbers ranging from 106 to 0). Ct represents the threshold cycle at which fluorescence is first detected above background.
Standard curve
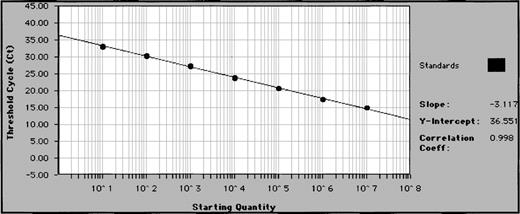
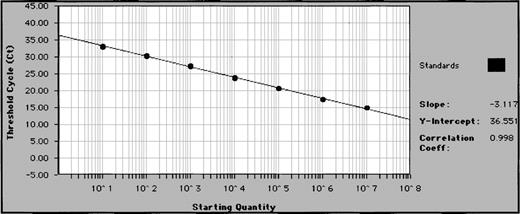
A standard curve is required to quantify MRD levels in patient follow-up samples by real-time PCR. This is typically produced by serially diluting a known amount of target DNA and performing TaqMan PCR on the series alongside patient samples. Although a dilution series of patient sample DNA with a well-characterized tumor involvement could be used, this is frequently not possible because availability of pure leukemia cell samples can be limited. We therefore molecularly cloned patient IgH rearrangements into plasmids for our standard curves. After construction (see “Materials and methods”), patient IgH plasmids were quantified by spectrophotometry and serially diluted 10-fold into normal donor peripheral blood mononuclear cell DNA (plasmid copy numbers ranging from 106 to 100). This was done to mimic a patient sample that would contain tumor cells and their clonal IgH rearrangement within the polyclonal rearrangements of normal B cells. The patient IgH plasmid dilution series were PCR-amplified by TaqMan real-time PCR as described above, using as primers the patient ASO together with the appropriate VH consensus primer and TaqMan probe (Figure 2A). Standard curves with correlation coefficients greater than 0.970 were produced from the data collected for each patient plasmid dilution. Results obtained on serial dilutions of a patient's cloned IgH rearrangement using the VH5 probe are shown in Figure 3. Similar standard curves were produced using each of the other consensus TaqMan probes, demonstrating that this approach can be used for each of the VH families (data not shown).
Representative standard curve for quantifying patient samples.
Patient IgH plasmids are diluted 10-fold in 7 increments (copy numbers ranging from 106 to 1) and subjected to real-time quantitative PCR in triplicate. Plasmid copy number (starting quantity) of standards is plotted against Ct (threshold cycle—cycle number at which fluorescence first rises above background) to create a standard curve for quantification of unknown samples.
Internal control
To ensure that quantitation of MRD in serial samples was not affected by differences in the amount of DNA added to PCR reactions or sample-to-sample differences in levels of PCR inhibition, an internal control reaction was run alongside the IgH reactions. We targeted the GAPDH locus for which a well-characterized GAPDH TaqMan probe is commercially available (PE Biosystems). Oligonucleotide primers were designed to amplify a small region spanning intron C and exon 4 to eliminate the possibility of cross-reactions with processed pseudo genes elsewhere in the genome. The primers were tested by standard endpoint PCR, and the single band that was obtained was sequenced directly to ensure its identity (data not shown). The standard curve for GAPDH quantitation was produced by serially diluting the GAPDH plasmid 10-fold into water (copy numbers ranged from 106 to 100) and performing real-time PCR as described. Standard curves from the data collected in triplicate reproducibly resulted in correlation coefficients of more than 0.970 (data not shown). The GAPDH values were used to normalize IgH values as described in “Materials and Methods.” Attempts to multiplex the IgH and GAPDH reactions consistently resulted in a loss of sensitivity for both reactions (data not shown). This problem was not significantly corrected by limiting the concentrations of either IgH or GAPDH primers (data not shown). Therefore, in all experiments reported, these reactions were performed in separate tubes to ensure maximum sensitivity.
Sensitivity and accuracy
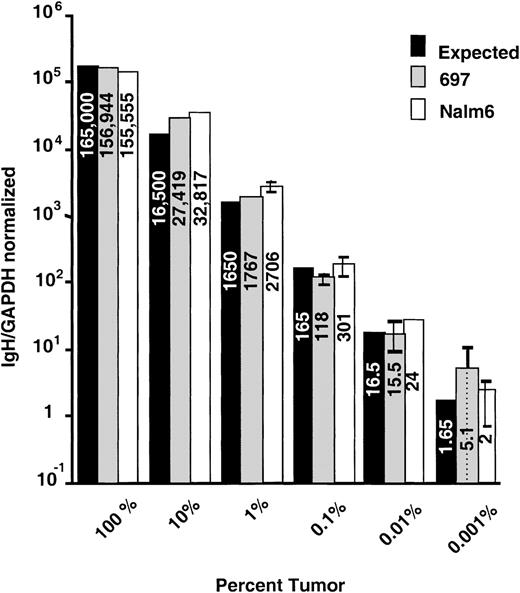
Important to MRD analysis in hematologic malignancies is that the assay is both accurate and sufficiently sensitive to detect tumor cell contamination of blood or bone marrow samples over a wide range. To determine both the sensitivity and accuracy of real-time quantitation using consensus IgH probes and standard curves produced from serially diluted patient IgH plasmids, we performed quantitative PCR on dilution series of known amounts of cells with characterized IgH rearrangements. The ALL cell lines NALM-6 and 697 were serially diluted in 7 10-fold increments into normal peripheral blood mononuclear cells and the DNA prepared as described. These dilutions resulted in DNA samples with ratios of malignant:normal lymphocytes ranging from 100% to 0.001% tumor. Standard curves for quantifying these cell lines were made by serially diluting plasmids that contained cell line–associated IgH rearrangements into normal peripheral blood lymphocyte DNA as described. For each reaction, 0.5 μg of DNA, or the equivalent of 165,000 cells total, was subjected to quantitative analysis. Representative results from 1 experiment performed in triplicate for each cell line is shown in Figure 4. These data demonstrate that this real-time method can consistently detect 1 tumor cell in 104 to 105 normal cells. While sensitivity of detection could vary from patient to patient due to the use of unique patient primers and different consensus probes, the results from NALM-6 and 697 (which use VH1 and VH4 probes respectively and unique ASOs) show that similar sensitivities are possible. Cell-line dilution experiments were repeated 5 times and the data pooled together for statistical analysis of accuracy (data not shown). For each concentration, there was no statistical difference (P values ranged from .14 to .5) between expected and calculated number of IgH copies.
Evaluation of accuracy using ALL cell-line dilutions.
The ALL cell lines 697 and NALM-6 were diluted into normal peripheral blood mononuclear cells to produce samples that had tumor cell contamination values ranging from 100% to 0.001%. These samples were subjected to quantitative PCR in triplicate. Mean IgH/GAPDH normalized values with standard deviations are plotted with the expected values based on the amount of DNA added to the reactions.
Reproducibility
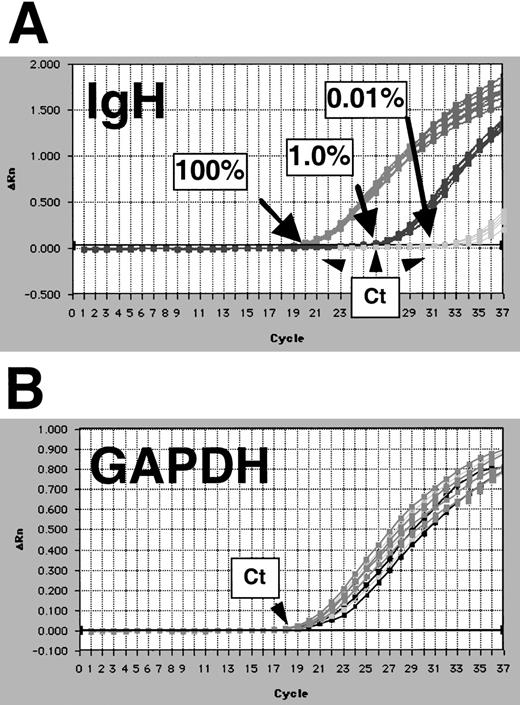
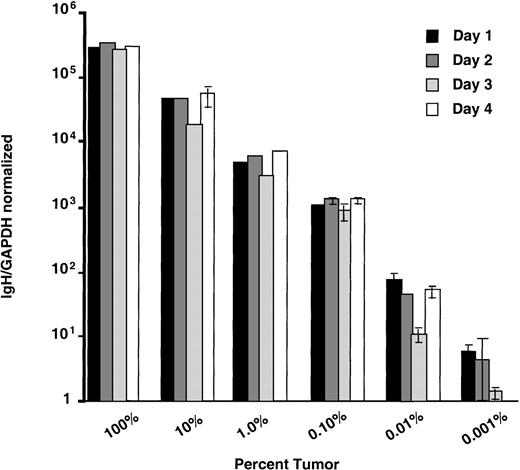
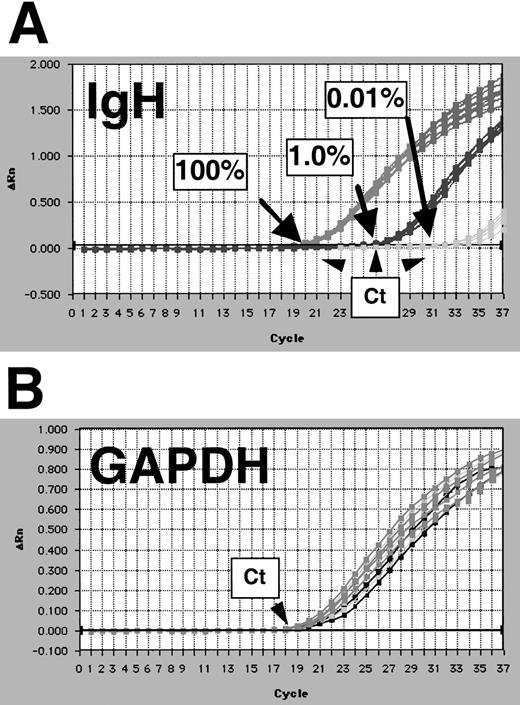
We examined the reproducibility of the quantitation method by comparing results obtained from replicate samples both during the same reaction run (intra-run variability) and those obtained on different days (inter-run variability). Intra-run variability analysis was performed on 697 cell-line dilution samples that were 100%, 1%, and 0.01% tumor cells in normal peripheral blood lymphocytes. For this experiment, 7 replicates for each dilution were amplified. Results are shown in Figure 5. There was little variability in the Ct of the 7 replicates at each concentration of tumor cell (Figure 5A). Of note, the amount of DNA in each sample analyzed was constant as assessed by quantification of GAPDH copy number where Ct values are nearly identical (Figure 5B). We assessed inter-run variability by performing quantitative PCR as described above on a series of 6 10-fold dilution samples of NALM-6 cells on 4 separate days (Figure 6). When the means of 3 replicate measures at each dilution level from each day are compared, no pair of results had a difference of more than 1 log. Although some measurement variability can be seen, we believe this variability would not be clinically relevant because it is likely that only log differences in tumor burden (and thus MRD levels) would reflect success or failure of therapy in patients.
Evaluation of intra-assay reproducibility of IgH real-time quantitation.
Intra-assay reproducibility is demonstrated by quantifying 7 replicates of samples that contained 100%, 1.0%, and 0.01% 697 cells in normal peripheral blood mononuclear cells. Amplification plots show results for IgH (A), and GAPDH reactions on these samples are shown (B). Threshold cycle (Ct) positions are indicated by arrows.
Evaluation of inter-assay reproducibility.
Inter-assay reproducibility is demonstrated by performing quantitative PCR on dilutions of NALM-6 cells on 4 separate occasions. Samples with ratios of NALM-6 to normal peripheral blood mononuclear cells ranging from 100% to 0.001% were quantified in triplicate on 4 successive days. IgH/GAPDH normalized values for the means of triplicate reactions of each sample on each day are plotted.
Quantitation of acute leukemia follow-up samples
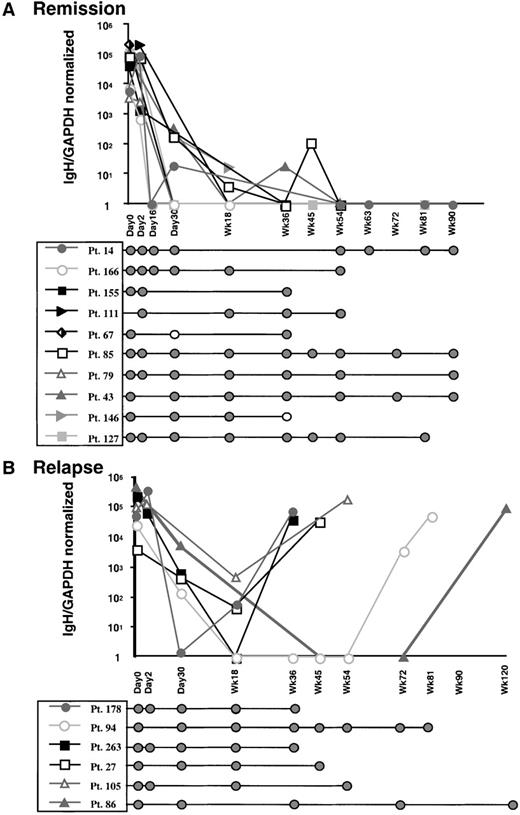
An important objective for quantitative analysis of MRD is to discriminate between patients who are persistently PCR-positive and will subsequently relapse and those who will not relapse. To address whether real-time PCR analysis would be helpful in discriminating between these patient groups, we quantified samples obtained from the time of diagnosis to last follow-up from 16 patients with pediatric ALL. From patients who were persistently PCR-positive using standard qualitative seminested PCR, at least 1 representing each of the VH gene families was analyzed to ensure that each probe was capable of quantifying unknown samples. Each patient's tumor-related IgH sequences had previously been characterized (unpublished results). Individual standard curves were produced as described above. Bone marrow or peripheral blood samples obtained from each patient during the course of treatment were analyzed by both qualitative and quantitative PCR analysis. Patients 14, 43, 67, 79, 85, 111, 127, 146, 155, and 166, who remained in remission, had starting levels of MRD between 5 × 10³ to 5 × 10⁵copies IgH/normalized GAPDH, which then dropped to levels that were undetectable (Figure 7A). As indicated, these patients were persistently PCR-positive by seminested PCR, which has a level of sensitivity greater than the single amplification of this quantitative method. This demonstrates that the level of tumor contamination in these patients is below 10-4 (the level of MRD that can be detected by real-time PCR) but more than 10-6 (the level of MRD that can be detected by seminested qualitative PCR). In contrast, although patients 27, 86, 94, 105, 178, and 263 appeared to have an initial decrease in tumor burden, subsequent samples showed quantitative increase in tumor burden. These patients all relapsed at the time of the last sample analyzed (Figure 7B).
Discussion
We have developed a real-time PCR method that uses tumor-related IgH rearrangements for quantitative assessment of MRD in B-cell malignancies. The assay employs consensus V region probes in addition to patient-specific ASO and VH gene consensus primers. The advantage of this approach is that only a limited number of probes is required to quantify MRD for a large number of patients. This PCR method is accurate, reproducible over a wide range, and allows a high throughput of samples. We demonstrate that this method can be used in patient samples to quantify MRD during and after therapy. We are currently examining the clinical significance of MRD dynamics in a large cohort of patients undergoing therapy for ALL in a prospective study, but we are encouraged to find that this method allowed discrimination of patients who had persistence of MRD and have not relapsed and patients who subsequently relapsed. Our finding that patients with persistence of detectable disease might be further risk-stratified demonstrates the importance of accurate quantification of MRD in this patient population.
We developed this quantitative PCR method for the MRD studies under way in our laboratory that follow large numbers of patients. Therefore, it was important that the method be both efficient and cost-effective. Of note, these are also important considerations if this assay is to be clinically relevant. We chose a real-time PCR method because it requires no post-PCR processing and is therefore the least labor-intensive method of quantitative PCR available. Real-time PCR amplification, in our hands, was considerably less labor-intensive than limiting-dilution or competitive PCR analysis. Using this method, accurate quantification of MRD levels can be obtained in just over 2 hours with the appropriate patient primer, calibration standard, and probe. Real-time PCR is transformed into a cost-effective method of MRD quantification for B-cell malignancies by the innovation of consensus FR3 V gene family probes. We find that the 7 probes described above are sufficient to quantify MRD in almost all of the ALL patients in our large, prospective study for whom suitable IgH sequences have been obtained. Therefore, with our assay, savings can be realized not only by using a small number of probes but also by having the freedom to order probes in bulk, further decreasing the price of probes nearly 10-fold.
The GAPDH internal reference reaction we employ provides a method of normalizing IgH copy number so that quantitation values can be compared from samples obtained at different times during a patient's treatment. DNA prepared from peripheral blood and bone marrow often contains inhibitors of the PCR reaction that vary from sample to sample and could result in spurious quantitation values.34 It is likely that such PCR inhibition would affect both the IgH and internal reference reactions. Additionally, it is important to compensate for errors that are possible while calculating the amount of DNA to add to PCR reactions. Ideally, an internal reference reaction should be performed in multiplex, or in the same tube as the primary reaction. This would also allow for compensation in errors in pipetting and differences in PCR block position (which could potentially impact quantification values). We expended considerable time and effort attempting to optimize a multiplex reaction for our quantitation method. However, we consistently found that multiplexing this particular reaction resulted in an unacceptable high loss of sensitivity of detection of IgH copies. This appeared to result from competition between the IgH and GAPDH PCR reactions and was not significantly improved when the amounts of either IgH or GAPDH primers were reduced (data not shown). Although the internal reference could be run in multiplex with the primary PCR reaction when the number of tumor copies is high, this technique was not suitable for sensitive assessment of disease when patients achieve minimal disease states. We therefore chose to perform the IgH and internal reference reactions in separate tubes.
The primary advantage of real-time quantitative PCR is that the analysis is performed at the start of the exponential phase of amplification, when reaction components are not limiting. This permits accurate quantitation over a wider dynamic range than endpoint quantitation assays. A limitation this method presents for MRD studies, however, is that the analysis takes place during a single amplification. In our hands, a single amplification reaction by standard endpoint PCR typically has a sensitivity of 1 tumor cell in approximately 104 normal cells. This also appears to be the limit of sensitivity for our quantitative reactions as demonstrated by cell-line dilution experiments. This is in contrast to nested or seminested PCRs, which have the potential to detect 1 tumor cell in more than 105 normal cells.31 Additionally, this method is impacted by its sensitivity to excessive amounts of genomic DNA. Whereas we can add 1 to 2 μg of DNA to seminested PCR reactions, in our hands it appears that 0.5 μg is the optimal amount of DNA for 50-μL quantitation reactions. Thus, fewer total genomes can be analyzed in a given reaction. This factor would particularly affect the quantitation of samples with low levels of tumor cell contamination.
Taken together, these factors explain the results presented in Figure7. Here, some patient samples lacking quantifiable MRD were nonetheless PCR-positive for MRD by qualitative seminested PCR. Indeed, only patients 27, 86, 94, 105, 178, and 263, who have relapsed, had significant quantifiable levels of MRD beyond week 18. Patients whose samples have discordant qualitative and quantitative results therefore must have MRD levels of more than 1 tumor cell in 105 to 106 but less than 1 in 104. We believe this indicates that the level of sensitivity of this assay is appropriate for distinguishing patients who have clinically relevant levels of MRD from those who have persistent but low levels of MRD. These data also illustrate the complementary nature of qualitative and quantitative PCR data. We presently use qualitative data from seminested PCR to guide our quantitative analyses to determine the prognostic significance of persistently detectable MRD in pediatric ALL.
Quantitative and qualitative PCR analysis of MRD for patients receiving primary induction therapy for childhood ALL.
Bone marrow or peripheral blood lymphocyte samples from 16 patients were examined. (A) Plot showing quantitative and qualitative MRD analysis for patients remaining in remission. Mean values of IgH/GAPDH normalized for quantification reactions performed in triplicate are shown plotted against sample therapeutic time frame. Qualitative seminested PCR results for MRD in the same patient samples demonstrated persistence of PCR-detectable MRD throughout the period of treatment examined. (B) Plot showing quantitative and qualitative MRD analysis for patients who relapsed. Qualitative PCR results for the same samples are shown below.
The method we describe here was designed for quantitative analysis of MRD in childhood ALL but was developed with a view to applying it to MRD studies that are under way in our laboratory in a variety of B-cell malignancies. Thus, it was important that the assay be flexible and able to accommodate IgH rearrangements from B cells with both immature and mature phenotypes. This is significant because clonal IgH sequences of immature ALL cells are typically in germline configuration, whereas IgH sequences from more mature B-cell malignancies are characterized by somatic hypermutations.35 36 These mutations can alter sequences in regions to which consensus primers and probes are designed. We have found that this quantitative method can be adapted to quantify MRD effectively in mature B-cell malignancies by employing several additional probes and using different primers (unpublished observation). In addition, we have found that consensus probes can function for IgH rearrangements that do not perfectly match the consensus regions sequence (unpublished observation). Therefore, the methodology described here has broad application to assess the clinical significance of quantitative changes in MRD in the whole range of B-cell malignancies. In addition, we are developing similar real-time PCR methods to quantify MRD using T-cell receptor rearrangements as targeted markers. T-cell receptor rearrangements are less subject to clonal evolution than IgH rearrangements, and quantitative data using these markers should complement the IgH data from patients for whom we have multiple markers. In addition, T-cell receptor assays will increase the number of patients we can follow by quantitative PCR on our ALL study.
Acknowledgments
We thank Stephen Sallan, MD, and members of the Dana-Farber Cancer Institute ALL consortium for contributing patient samples for the study. We thank Stacy Waters for sample procurement and Edie Weller for help with biostatistics.
J.G.G. supported by P01 CA68484 from the National Cancer Institute, Bethesda, MD.
Reprints:John W. Donovan, Dana Farber Cancer Institute, 44 Binney St, Boston, MA 02115; e-mail:john_william_donovan@dfci.harvard.edu.
The publication costs of this article were defrayed in part by page charge payment. Therefore, and solely to indicate this fact, this article is hereby marked “advertisement” in accordance with 18 U.S.C. section 1734.


