Abstract
Interleukin (IL)-4, IL-10, and IL-13, Th2 cell–derived cytokines, play major roles in the pathophysiology of allergic diseases. These cytokines up-regulate or down-regulate the production of arachidonic acid metabolites. In this study, we have investigated the effect of IL-4, IL-10, IL-13, and other cytokines on A23187-stimulated synthesis of leukotriene (LT) B4 in human polymorphonuclear leukocytes (PMNs). Production of LTB4 was measured by specific radioimmunoassay and high performance liquid chromatography. Messenger RNA (mRNA) expression of cytosolic phospholipase A2 (cPLA2), 5-lipoxygenase (5-LO), and LTA4 hydrolase, which were involved in the synthesis of LTB4, was determined by reverse transcription–polymerase chain reaction and Northern blot analysis. Protein synthesis of their enzymes was determined by Western blot analysis. IL-4 and IL-13 enhanced A23187-stimulated LTB4 synthesis and increased mRNA expression and protein synthesis of LTA4hydrolase, but not those of cPLA2 or 5-LO. These results indicate that IL-4 and IL-13 transcriptionally or post-transcriptionally up-regulate the synthesis of LTB4, a potent chemotactic factor to PMNs, at the enzyme level of LTA4 hydrolase, and this up-regulation mechanism may participate in the development of allergic inflammation.
Cytokines have been recognized as important bioactive substances produced in lymphocytes and various other cell types. It is accepted that they form a network with one another and regulate functions of other class mediators, such as arachidonic acid (AA) metabolites. Interleukin (IL)–4, IL-10, and IL-13, which are CD4 helper type 2 lymphocyte (Th2 cell)–derived cytokines, play major roles in the pathophysiology of allergic diseases. Th2 cell–derived cytokines potentiate mucosal inflammation and bronchial hyperreactivity in asthma patients.1-4 It was also reported that inhalation of IL-4 and IL-5 increased the number of eosinophils and neutrophils in bronchoalveolar lavage fluid (BALF) in human beings.5 6
In asthmatic patients, the number of polymorphonuclear leukocytes (PMNs) were increased in BALF after allergen challenge; neutrophils appeared first; then eosinophils replaced them.7-9 Although various kinds of chemoattractants are involved in the infiltration of PMNs, leukotriene (LT) B4 is one of the most potent chemotactic factors affecting PMNs. Neutrophils themselves are also a major source of LTB4 as well as prostaglandin (PG) E2 and thromboxane (TX) A2. Thus, LTB4 produced by neutrophils is possibly involved in the process of allergic inflammation. LTB4 is an AA metabolite of 5-lipoxygenase (5-LO) pathway and is synthesized by 3 consecutive enzymatic reactions of cytosolic phospholipase A2(cPLA2), 5-LO, and LTA4 hydrolase.
Recent studies demonstrated that the production of AA metabolites was enhanced by stimulation with various bioactive substances such as interleukins in various cell types, including PMNs. One mechanism of the enhanced production is a new induction of synthesizing enzymes such as cPLA2, cyclooxygenase (COX)-2, and 5-LO by transcriptional and/or post-transcriptional regulation of genes.10-19 We and others recently demonstrated that production of thromboxane and prostaglandin was transcriptionally up-regulated by lipopolysaccharide (LPS) at the enzyme levels of cPLA2 and COX-2 in PMNs.20-22 However, there have been few reports on whether similar regulatory mechanisms are present in the 5-LO pathway in PMNs. In this study, we have examined whether various cytokines, especially allergy-related Th2 cytokines, stimulate synthesis of LTB4, the final product of the 5-LO pathway in PMNs, and have further investigated the mechanisms of this regulation.
Materials and methods
Reagents
The following reagents were used: RPMI 1640, antibiotic-antimycotic solution (a mixture of penicillin G, streptomycin, and amphotericine B), moloney-murine leukemia virus reverse transcriptase and RNA ladder from Gibco BRL (Grand Island, NY); Ficoll-hypaque, oligo (thymidine [dT]) primer, RNA guard, ethidium bromide, and 100 base-pair (bp) DNA ladder from Pharmacia (Uppsala, Sweden); human type AB serum and diethyl pyrocarbonate (DEPC) from Sigma Chemical (St Louis, MO); Agarose MS-12 from Cosmo Bio (Tokyo, Japan); Norit A (activated charcoal) and EDTA from Wako (Osaka, Japan); recombinant human IL-4, IL-10, and IL-13 from R & D systems Inc (Minneapolis, MN); recombinant human IL-2 and IL-6 from Anapure Bioscientific (Beijing, China);Escherichia coli–derived LPS from Difco Laboratories (Detroit, MI); LTB4, TXB2, and 5-HETE from Funakoshi (Tokyo, Japan); [5, 6, 8, 9, 11, 12, 14, 15-3H]–LTB4 and [5, 6, 8, 9, 11, 12, 14, 15-3H]–TXB2 from DuPont NEN (Boston, MA); α[32P] deoxycytidine triphosphate (dCTP) from Toho Chemical (Tokyo, Japan); LTA4 methylester and antihuman LTA4 hydrolase rabbit polyclonal antibody from Cayman Chemical (Ann Arbor, MI); antihuman cPLA2 mouse monoclonal antibody and cPLA2 standard from Santa Cruz Biotechnology Inc (Santa Cruz, CA); antihuman 5-LO mouse polyclonal antibody from Transduction Laboratories (Lexington, KY); horseradish peroxidase (HRP)–conjugated antirabbit immunoglobulin (Ig)–G goat serum from Jackson Immunoresearch Laboratories Inc (West Grove, PA); HRP-conjugated antimouse IgG goat serum from Kirkegaard and Perry Laboratories Inc (Gaithersburg, MD); deoxyribonucleoside triphosphate (dNTP) mixture and recombinant Taq DNA polymerase from Takara Shuzo (Kyoto, Japan); isogen, random primer labeling kit, and human beta-actin DNA probe from Nippon Gene (Tokyo, Japan); polymerase chain reaction (PCR) primer pairs specific for beta-actin, cPLA2, 5-LO, 5-lipoxygenase activating protein (FLAP), and LTA4 hydrolase from Nippon Seifun (Tokyo, Japan); Genescreen from NEN Research Products (Boston, MA). Antisera to LTB4 and TXB2 were kindly provided by Dr Tai (University of Kentucky, Lexington, KY). Other materials were all special grade and purchased from commercial sources.
Isolation and culture of human PMNs
Heparinized venous blood was obtained from healthy volunteers. PMNs were separated as previously described.14 After treating whole blood with 3% dextran sedimentation, we removed erythrocytes by hypotonic lysis. PMNs were obtained by Ficoll-Hypaque gradient centrifugation and washed twice with phosphate-buffered saline (PBS) containing 137 mmol/L NaCl, 2.7 mmol/L KCl, 8.1 mmol/L NaH2PO4, and 1.5 mmol/L K2PO4 (pH 7.4). The purity of neutrophil preparation determined by May-Gruward-Giemsa staining was greater than 95%. The viability of cells was checked by trypan blue staining.
The PMNs were incubated in RPMI 1640 containing 5% heat-inactive human type AB serum with various concentrations of IL-4, IL-10, IL-13, IL-6, IL-2, or LPS for the indicated periods at 37°C under 5% CO2 at a cell density of 2 × 10⁶cells/mL in all studies except for Northern blot, in which cells were incubated at 5 × 10⁶ cells/mL. The cells were recovered after incubation, washed twice with PBS, and used for subsequent studies. In other sets of experiments, cell viability and A23187-stimulated production of LTB4 were examined after the incubation with IL-4, IL-10, and IL-13 for 0, 6, 9, 15, and 24 hours.
Radioimmunoassay for LTB4 and TXB2
PMNs were incubated for various periods of time with various concentrations of IL-4, IL-10, IL-13, IL-6, IL-2, or LPS as described above. After incubation and washing with PBS, the cells (1 × 10⁵ cells) were resuspended in 1 mL of RPMI medium without serum and stimulated with A23187 at 10−5 mol/L for 15 minutes at 37°C under 5% CO2 in air. The medium was collected for measurement of LTB4 and TXB2 by specific radioimmunoassay (RIA). RIA for LTB4 was performed as previously described.18 In brief, 100 μL of sample was incubated at 4°C for 10 hours with 100μL each of anti-LTB4 rabbit serum, [3H]-LTB4, and 50 mmol/L sodium phosphate buffer containing 0.9% NaCl and gamma globulin. After incubation, free [3H]-LTB4 was separated by centrifugation after the addition of 500 μL of gamma globulin–coated charcoal (Norit A) to the assay mixture. Radioactivity of the supernatant was measured with a liquid scintillation counter, Model LS 7500 (Beckman; Irvine, CA). The amount of LTB4 was calculated from a standard curve. The detectable range of LTB4 was from 16 to 100 pg/tube. RIA for TXB2was performed under the same conditions except that anti-TXB2 rabbit serum and [3H]-TXB2 were used instead of anti-LTB4 rabbit serum and [3H]-LTB4, respectively. The detectable range of TXB2 was from 32 to 1000 pg/tube.
Measurement of 5-LO products of AA metabolism by high performance liquid chromatography
Measurement of LTB4, 5-hydroxyeicosatetraenoic acid (5-HETE), and 6-trans LTB4 diastereoisomers by high performance liquid chromatography (HPLC) was performed as previously described.23 PMNs were incubated for various periods of time with various concentrations of IL-4, IL-10, and IL-13 as described above. After incubation and washing with PBS, the cells were resuspended in RPMI at 2 × 10⁶ cells/mL and stimulated with A23187 at 10−5 mol/L for 15 minutes. The medium was then removed and mixed with 3 mL methanol. The methanol samples were centrifuged at 3000 rpm for 5 minutes, and the supernatants were partially purified and concentrated by passing through a Sep Pak C18 cartridge (Waters; Milford, MA) and applied to HPLC system, model TOSO-8010 (Toso; Tokyo, Japan), equipped with a Nova Pak C18 column (Waters). The sample was delivered with acetonitorile, methanol, water, and acetic acid (31:17.68:51.24:0.68 [vol/vol]) for the assay of LTB4 and 6-trans LTB4diastereoisomers and (45:13.62:40.84:0.54 [vol/vol]) for the assay of 5-HETE, respectively. The flow rate was 0.8 mL/min, and the absorbance was monitored by a spectrophotometer at 280 nm for LTB4 and 6-trans LTB4 diastereoisomers, and at 235 nm for 5-HETE. Quantification of LTB4, 6-trans LTB4 diastereoisomers, and 5-HETE was based on the peak ratio area-to-standards.
Analysis of messenger RNA expression for cPLA2, 5-LO, FLAP, and LTA4 hydrolase by reverse transcription–PCR
PMNs were incubated with IL-4, IL-10, IL-13, IL-6, IL-2, or LPS as described above. After incubation, the cells were washed with PBS and obtained (5 × 10⁶ cells). RNA extraction from the cells was performed as previously described.18 The cells were lysed with 1 mL of isogen. After adding chloroform (200 μL) and centrifuging at 12 000g for 15 minutes at 4°C, we collected the aqueous phase. The sample was again centrifuged at 12 000g for 15 minutes at 4°C after the addition of isopropanol (500 μL): the supernatant was discarded. After the addition of 75% ethanol (1 mL) to the pellet, the sample was centrifuged at 12 000g for 5 minutes at 4°C. The supernatant was again discarded, and the pellet containing total RNA was dried under room air. The extracted total RNA was dissolved in DEPC-treated water and quantified by measurement of absorbance at 260 nm with a spectrophotometer, model DU-600 (Beckman).
Complementary DNA (cDNA) was synthesized by reverse transcription-PCR. The reaction mixture (final volume 20 μL) contained 1 μg of total RNA, 1 μg of oligo (dT) primer, 4 μL of 5 × reaction buffer, 2 μL of 0.25 mol/L dithiothreitol, 4 μL of dNTP mixture (each at 2.5 mol/L), 1 μL of RNA guard (5 units), and 1 μL of reverse-transcriptase (200 units).
PCR was carried out in a total volume of 50 μL containing 1 μL of the cDNA, 5 μL of 10 × PCR buffer, 4 μL of dNTP mixture, 0.25 μL of Taq DNA polymerase (5 unit/μL), 100 pmol of paired primers (cPLA2, 5-LO, FLAP, LTA4 hydrolase, or beta-actin), and DEPC-treated water. DNA amplification with cPLA2, 5-LO, FLAP, LTA4 hydrolase, and beta-actin was performed for 27 cycles of denaturation at 94°C for 30 seconds, annealing at 56°C for 30 seconds, and extension at 72°C for 1 minute. The following primers were used: cPLA2, 5′-ATTCTGGATTGTGCTACCTAC, 5′-AACCAGAAACGCCCAAAACTC; 5-LO, 5′-ACCATTGAGCAGATCGTGGACACGC, 5′-GCAGTCCTGCTCTGTGTAGAATGGG; FLAP, 5′-CACGAAAGCAGGACCCAGAA, 5′-CAGAGCACAGCGAGGAAAGT; LTA4 hydrolase, 5′-CCACCATCCTTCCCTTAT, 5′-AAACAATCGTCCGCAAAT; beta-actin, 5′-TCCTGTGGCATCACGAAACT, 5′-TAGCAGGTGGCGTTTACGAAG. The size of PCR products were 580 bp in cPLA2, 488 bp in 5-LO, 116 bp in FLAP, 216 bp in LTA4 hydrolase, and 314 bp in beta-actin. The PCR products were electrophoresed in 3% agarose gel with the use of TBE buffer (89 mmol/L Tris, 2 mmol/L EDTA, 89 mmol/L sodium borate) and then stained by ethidium bromide. Messenger RNA (mRNA) abundance was visualized under UV exposure and photographed with the use of an image analyzer, Image Master VDS (Pharmacia Biotech; Tokyo, Japan). For every PCR experiment, preliminary experiments were performed to identify the optimum number of cycles of amplification to avoid saturation of the PCR products.
Northern blot analysis for LTA4 hydrolase
PMNs were incubated with IL-4 (10 ng/mL), IL-10 (100 ng/mL), IL-13 (100 ng/mL), or LPS (100 ng/mL) for 6 hours. After incubation and washing with PBS, the cells (5 × 10⁷ cells) were obtained, and total RNA was isolated. Northern blot analysis was performed as previously described.24 Fifteen micrograms of total RNA was denatured at 65°C for 5 minutes in 50% formamide, electrophoresed through 1% agarose gel containing 6.6% formaldehyde, and transferred to a nylon membrane. A DNA fragment (216 bp) was prepared by RT-PCR with the use of a primer pair for LTA4hydrolase. The DNA fragment was labeled with α[32P] dCTP by means of a random primer labeling kit and used as a DNA probe for LTA4 hydrolase mRNA. Hybridization was done overnight at 60°C in 5 × saline sodium citrate containing 4 × Denhardt's solution, 1% sodium dodecyl sulfate (SDS), 50 mmol/L sodium phosphate, and 0.1 mg/mL of denatured salmon sperm DNA. The membrane was washed with 2 × SSC, 0.1% SDS at room temperature (4 times, 10 minutes each time), followed by 0.2 × SSC, 0.1% SDS at 60°C (twice, 30 minutes each time). The hybridized bands were visualized by autoradiography. The same membrane was rehybridized with a human beta-actin probe as a control.
Western blot analysis for enzyme proteins of cPLA2, 5-LO, and LTA4 hydrolase
PMNs were incubated for various periods of time with various concentrations of IL-4, IL-10, IL-13, IL-6, IL-2, or LPS as described above. Western blot analysis for cPLA2 protein was performed as previously described.20 In brief, after incubation and washing with PBS, the cells (1 × 10⁷cells) were obtained and lysed in 100 μL of solubulization buffer containing 1% Tween 20, 1 mmol/L phenylmethylsulfonyl fluoride, and 50 mmol/L Tris-HCl (pH 8.0) on ice. The cells were sonicated by means of a sonicator, model R-225R (Heat-Systems-Ultrasonics Inc; Plainview, NY), on ice 3 times for 5 seconds and centrifuged at 12 000g for 20 minutes. The supernatant was collected, and the protein concentration was determined by Lowry's method. The samples (20 μg each as protein amount) were separated by 8% SDS-polyacrylamide gel electrophoresis (SDS-PAGE) and electro-transferred onto nitrocellulose membrane. The membrane was incubated with blocking solution Block Ace (Dainihon Pharmaceutical; Tokyo, Japan) for 1 hour at room temperature, and then incubated with antihuman cPLA2 mouse monoclonal antibody diluted at 1:500 with the diluent solution containing 10% blocking buffer at room temperature for 1 hour. The membrane was incubated with HRP-conjugated antimouse IgG goat serum diluted at 1:10 000 with the diluent solution at room temperature for 1 hour. The enzyme protein of cPLA2 was visualized by the use of an enhanced chemiluminescence system, Supersignal Substrate Western Blotting (Pierce; Rockford, IL), and photographed by a luminescent image analyzer, LAS 1000 (Fuji Film; Tokyo, Japan). Western blot analysis for enzyme proteins for 5-LO and LTA4 hydrolase was performed under the same conditions except that antihuman 5-LO mouse polyclonal antibody diluted at 1:1000 and HRP-conjugated antimouse IgG goat serum were used for the 5-LO assay, and antihuman LTA4 hydrolase rabbit polyclonal antibody diluted at 1:500 and HRP-conjugated antirabbit IgG goat serum were used for the LTA4 hydrolase assay instead of antihuman cPLA2 mouse monoclonal antibody and HRP-conjugated antimouse IgG goat serum.
Analysis of LTA4 hydrolase activity
PMNs were incubated with IL-4, IL-10, IL-13, IL-6, IL-2, or LPS as described above. After incubation and washing, the cells (1 × 10⁷ cells) were obtained and resuspended in 100 μL of Hepes buffer (137 mmol/L NaCl, 2.6 mmol/L KCl, 0.36 mmol/L NaH2PO4, 10 mmol/L Hepes, and 1 mmol/L EDTA at pH 7.5) containing 1 mmol/L of dithiothreitol. The cells were sonicated on ice and centrifuged at 12 000g for 20 minutes. The supernatant was collected, and the lysate was used as an enzyme source after the protein concentration was determined by Lowry's method. LTA4-free acid prepared from LTA4 methylester was diluted with 20 μL of Hepes buffer containing 10 mg/mL of bovine serum albumin and incubated with 180 μL of the cell lysate containing GSH for 5 minutes at 37°C. The reaction was stopped by adding 2 mL of methanol. The production of LTB4 for determination of LTA4 hydrolase activity was measured by HPLC as described above.
Statistical analysis
Data were shown as mean ± SEM. Statistical analysis was performed by 1- way analysis of variance. P < .05 was defined as statistically significant.
Results
Effect of IL-4, IL-10, and IL-13 on A23187-stimulated production of LTB4 determined by RIA in human PMNs
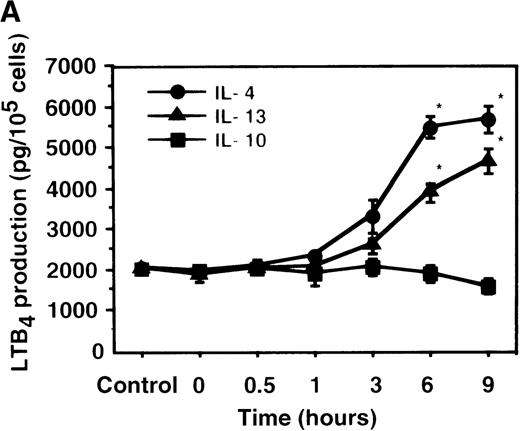
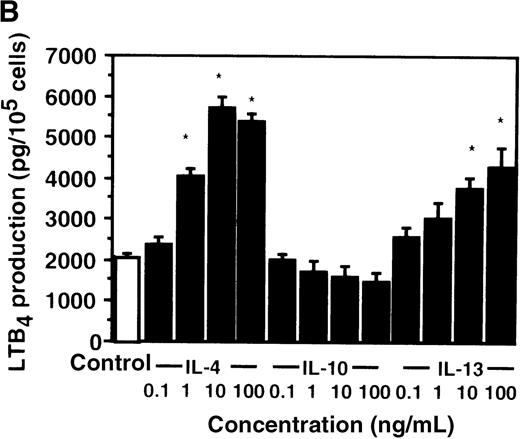
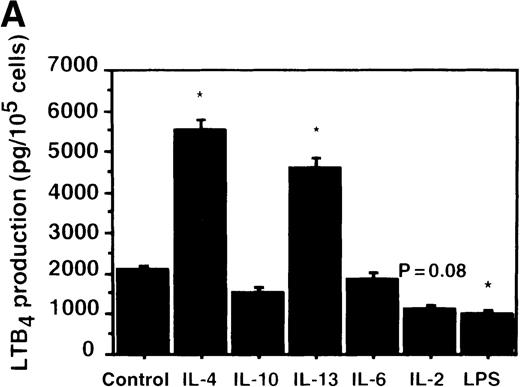
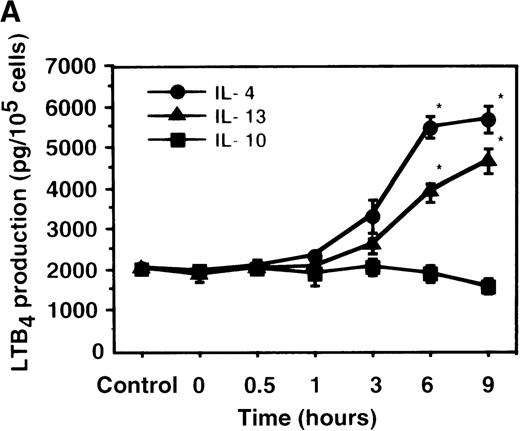
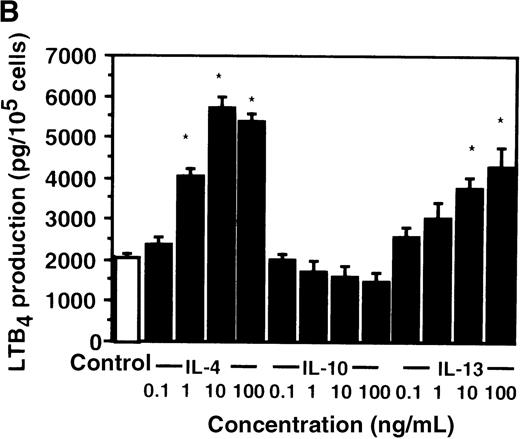
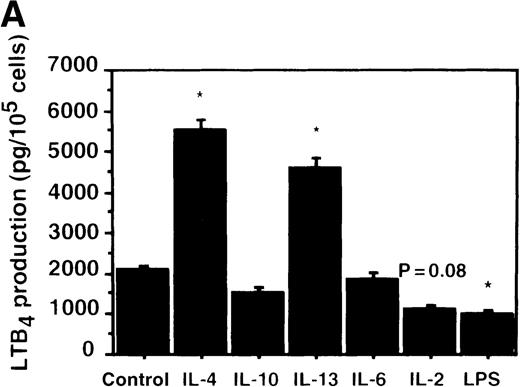
Cell viability in the control was 97.5 ± 0.6% (0-hour incubation time); this became 95.5 ± 0.6% after 9 hours' incubation and then decreased to 85.8 ± 1.5% (P < .05) and 73.7 ± 1.7% (P < .05) after 15 and 24 hours' incubation, respectively. IL-4, IL-10, and IL-13 had no significant effects on the cell viability after a 9-hour incubation period (data not shown). We therefore determined the effects of IL-4, IL-10, and IL-13 on LTB4 synthesis in human PMNs for up to 9 hours' incubation. LTB4 synthesis in PMNs was not detectable in the absence of A23187 stimulation with or without IL-4, IL-10, or IL-13. As shown in Figure1A, A23187-stimulated production of LTB4 was significantly increased from 2060 ± 108.9 pg/105 cells to 5505 ± 270.2 pg/105 cells by IL-4 (10 ng/mL) and to 3930 ± 218.1 pg/105 cells by IL-13 (100 ng/mL) after 6 hours' incubation. In a dose-dependent manner, IL-4 and IL-13 increased A23187-stimulated synthesis of LTB4, whose maximal values were obtained at 10 ng/mL and 100 ng/mL, respectively (Figure 1B). IL-10 showed no significant effects on LTB4 synthesis. The values of LTB4production after 15 and 24 hours' incubation with and without IL-4, IL-10, and IL-13 were measured in other sets of experiments, which were smaller than those after 6 and 9 hours' incubation (data not shown).
The effect of IL-4, IL-10, and IL-13 on A23187-stimulated LTB4 synthesis.
(A) Time-course study. PMNs were incubated with 10 ng/mL of IL-4, 100 ng/mL of IL-10, or 100 ng/mL of IL-13 for various periods of time. A23187-stimulated LTB4 production was measured by RIA as described in “Materials and methods.” Data represent mean ± SEM (n = 4). *P < .05 versus control. (B) Dose-response study. PMNs were incubated with various concentrations of IL-4, IL-10, or IL-13 for 6 hours, and A23187-stimulated LTB4 production was assayed.
Effect of IL-4, IL-10, and IL-13 on A23187-stimulated production of LTB4, 6-trans LTB4diastereoisomers, and 5-HETE determined by HPLC in human PMNs
We also measured the production of LTB4, 6-trans LTB4 diastereoisomers, and 5-HETE by using HPLC after 6 hours' incubation with IL-4, IL-10, or IL-13. As shown in Table1, A23187-stimulated production of LTB4 was significantly increased by the treatment with IL-4 or IL-13. However, no significant effects were shown by the treatment with IL-4, IL-10, or IL-13 in the production of 6-trans LTB4 diastereoisomers and 5-HETE.
Effect of IL-4 on mRNA expression for cPLA2, 5-LO, FLAP, and LTA4 hydrolase in human PMNs
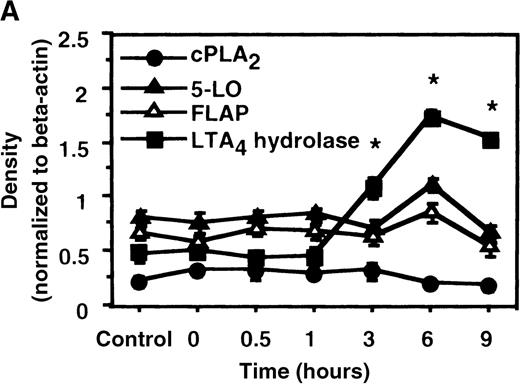
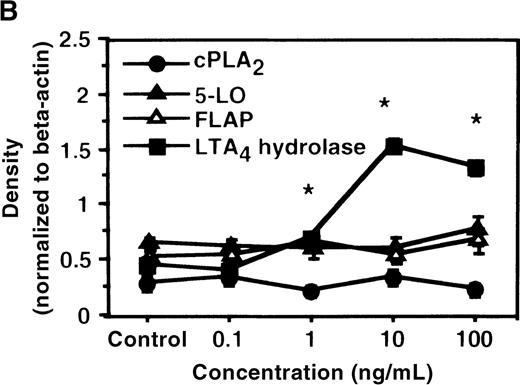
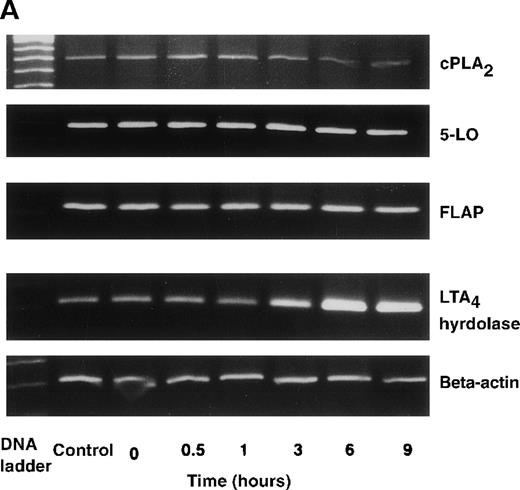
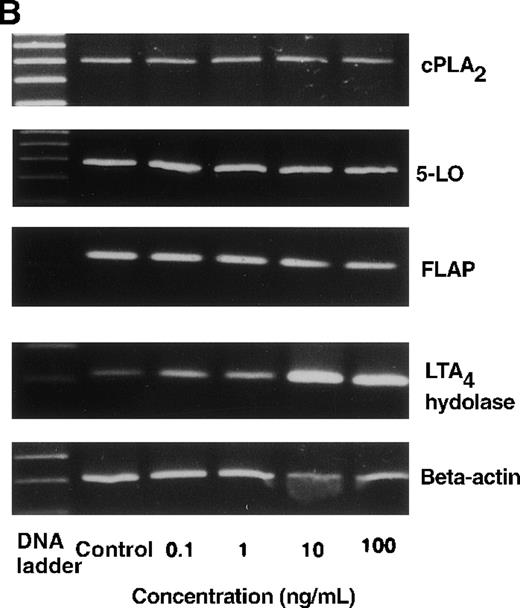
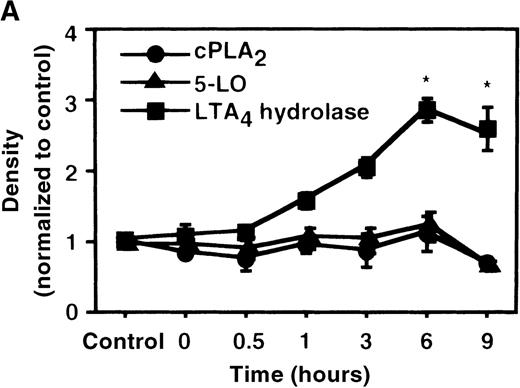
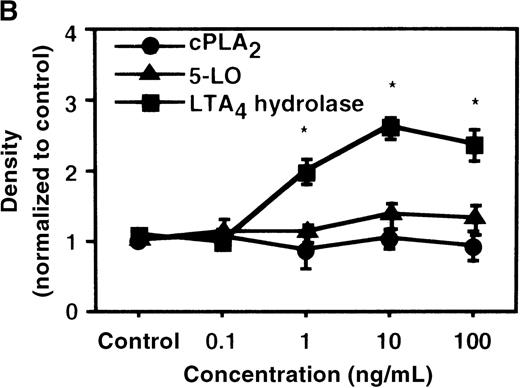
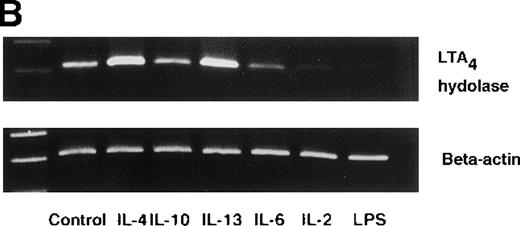
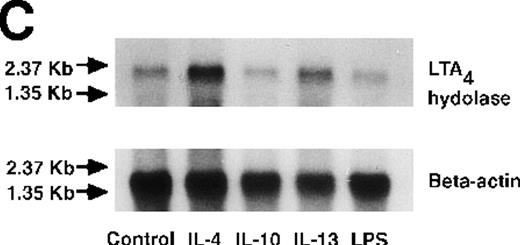
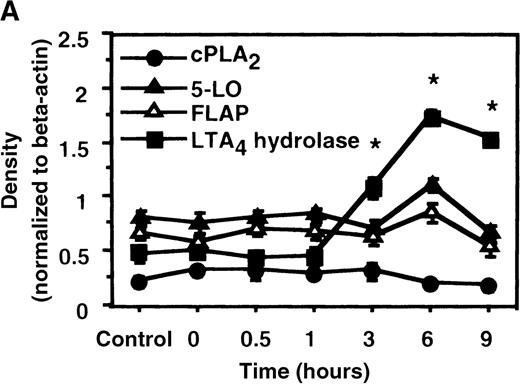
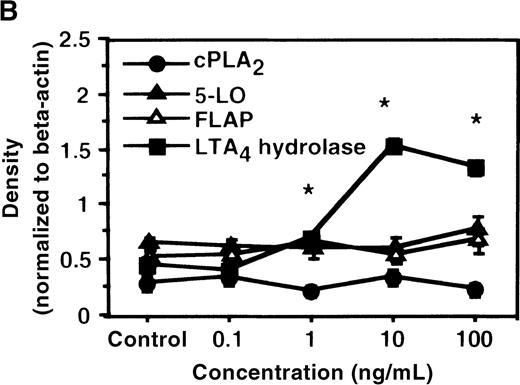
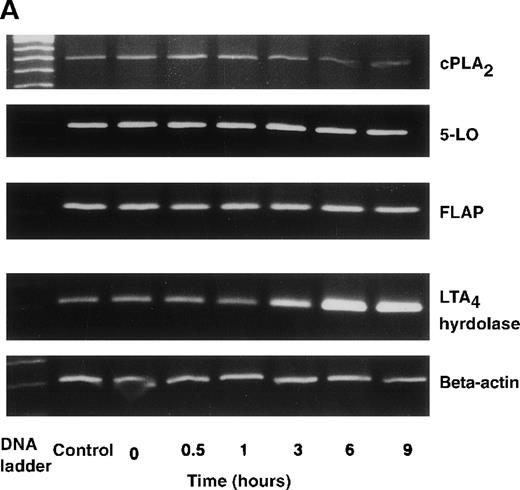
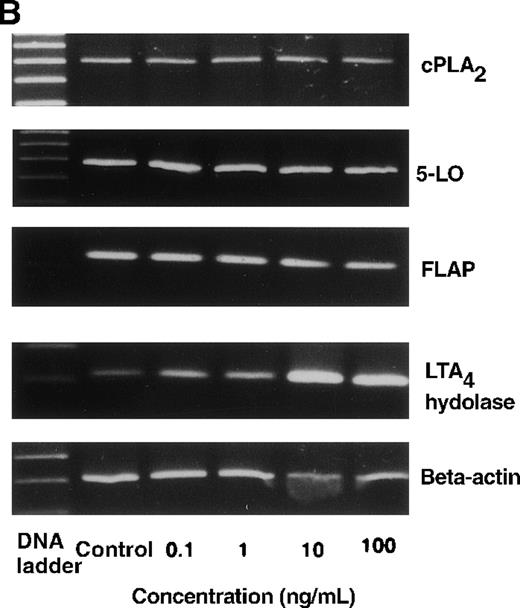
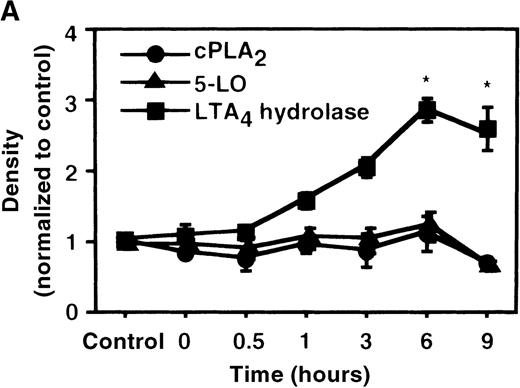
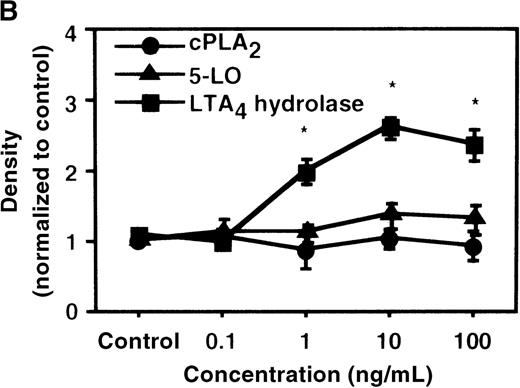
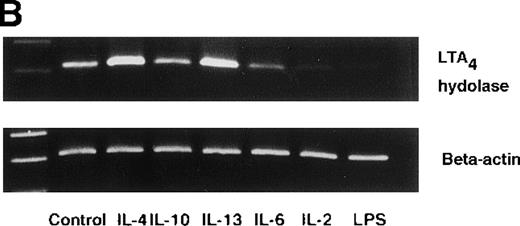
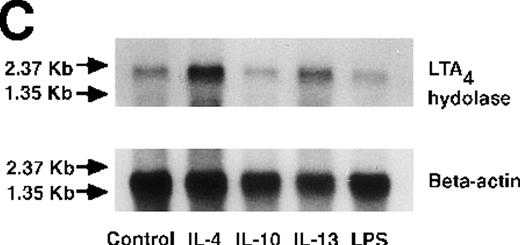
We determined mRNA expression for LTA4 hydrolase and other enzymes, cPLA2, 5-LO, and FLAP by using RT-PCR analysis. Time-course and dose-response studies treated with IL-4 are shown in Figures 2 and3. mRNA for LTA4 hydrolase began to increase after 3 hours' incubation with IL-4 and reached its peak value after 6 hours. Dose-response study demonstrated significant enhancement of LTA4 hydrolase mRNA at a concentration higher than 1 ng/mL. mRNA expression for cPLA2, 5-LO, and FLAP was not changed by IL-4-treatment. IL-13 also increased mRNA expression for LTA4 hydrolase after 6 hours' incubation at a concentration of 100 ng/mL (Figure 7B). Northern blot analysis demonstrated that mRNA expression for LTA4 hydrolase was markedly increased after 6 hours' incubation with IL-4 and IL-13, but not after incubation with IL-10 (Figure 7C).
The effect of IL-4 on mRNA expression for cPLA2, 5-LO, FLAP, and LTA4 hydrolase.
(A) Time-course study. After PMNs were incubated with 10 ng/mL of IL-4 for various periods of time, total RNA was isolated, and RT-PCR for cPLA2, 5-LO, FLAP, and LTA4hydrolase was performed as described in “Materials and methods.” The densities were measured and normalized by beta-actin. Results were shown as mean ± SEM (n = 4). *P < .05 versus control. (B) Dose-response study. After PMNs were incubated with various concentrations of IL-4 for 6 hours, total RNA was isolated, and RT-PCR for cPLA2, 5-LO, FLAP, and LTA4 hydrolase was performed.
The effect of IL-4 on mRNA expression for cPLA2, 5-LO, FLAP, and LTA4 hydrolase.
(A) Representative data of time-course study. Each lane indicates control, 0, 0.5, 1, 3, 6, and 9 hours' incubation with IL-4 (10 ng/mL). (B) Representative data of dose-response study. Each lane indicates incubation with IL-4 at 0, 0.1, 1, 10, and 100 ng/mL for 6 hours.
Effect of IL-4 on enzyme protein-synthesis of cPLA2, 5-LO, and LTA4 hydrolase in human PMNs
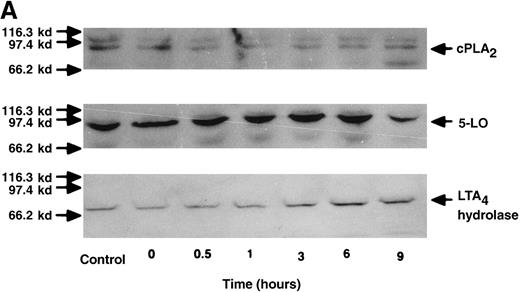
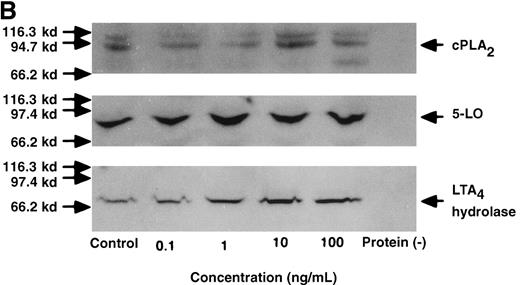
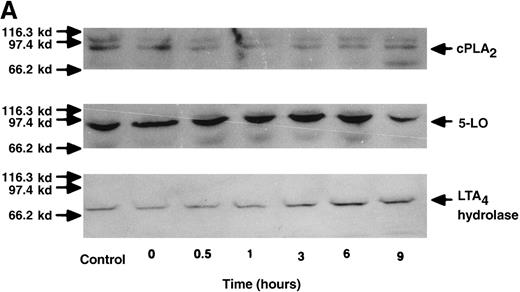
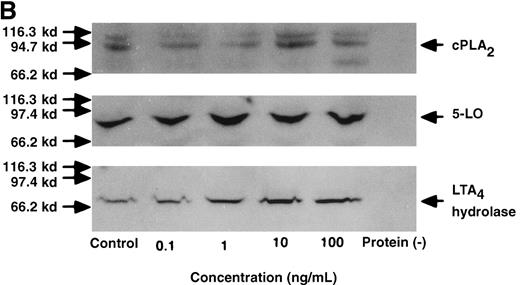
We used Western blot analysis to determine the effects of IL-4 on the synthesis of 3 enzymes that were involved in LTB4 synthesis: cPLA2, 5-LO, and LTA4 hydrolase. As shown in Figure4A, protein synthesis of LTA4hydrolase was significantly increased to 2.8 ± 0.2-fold after 6 hours' incubation. The dose-response study demonstrated significant increase at a concentration higher than 1 ng/mL (Figure 4B). Densities of cPLA2 and 5-LO proteins were not changed by IL-4 treatment. Representative results of the time-course and the dose-response studies are shown in Figure5. IL-13 also increased the amount of LTA4 hydrolase after 6 hours' incubation at the concentration of 100 ng/mL (Figure 7D).
The effect of IL-4 on protein expression of cPLA2, 5-LO, and LTA4 hydrolase.
(A) Time-course study. After PMNs were incubated with 10 ng/mL of IL-4 for various periods of time, the cell lysates were prepared and applied (20 μg protein) on 8% SDS-PAGE and electro-transferred onto nitrocellulose membrane. Western blot analysis was performed with anti-cPLA2, 5-LO, or LTA4 hydrolase antibodies as described in “Materials and methods.” The densities were measured and normalized by control values that were expressed as 1.0. Results were shown as mean ± SEM (n = 4). *P < .05 versus control. (B) Dose-response study. After PMNs were incubated with various concentrations of IL-4 for 6 hours, the cell lysates were applied on SDS-PAGE. Results are shown as mean ± SEM (n = 4). *P < .05 versus control.
The effect of IL-4 on protein expression of cPLA2, 5-LO, and LTA4 hydrolase.
(A) Representative data of time-course study. Each lane indicates control, 0, 0.5, 1, 3, 6, and 9 hours' incubation with IL-4 (10 ng/mL). The positions of molecular marker proteins (left side) and standards (right sides) are indicated by arrows. (B) Representative data of dose-response study. Each lane indicates incubation with IL-4 at 0, 0.1, 1, 10, and 100 ng/mL for 6 hours.
Effect of IL-4 on LTA4 hydrolase activity in human PMNs
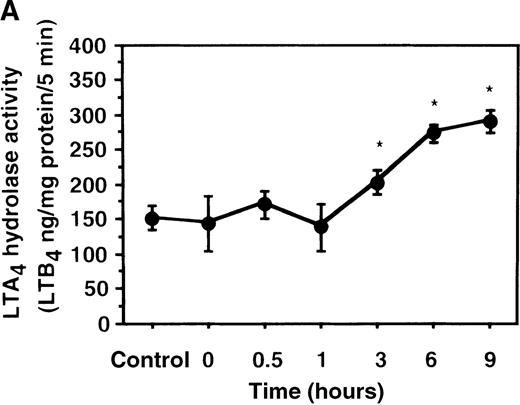
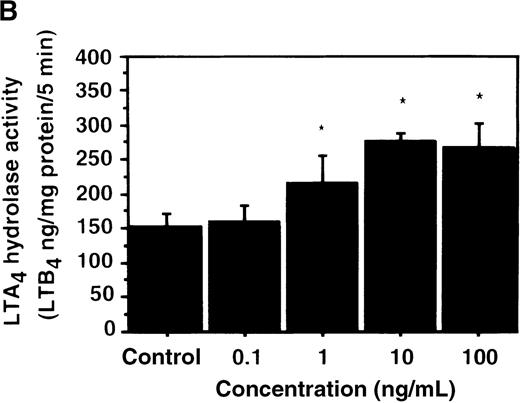
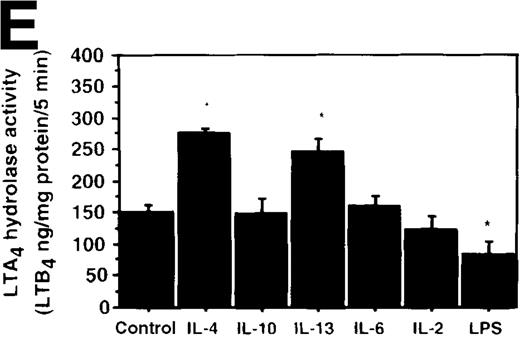
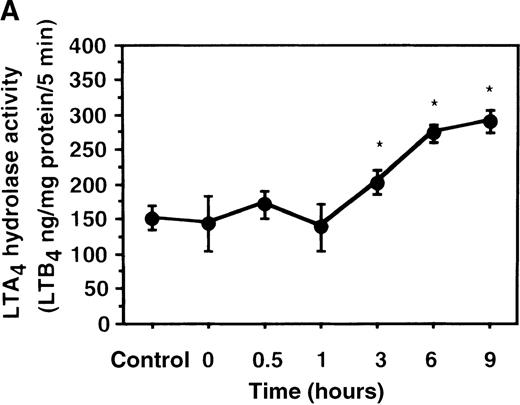
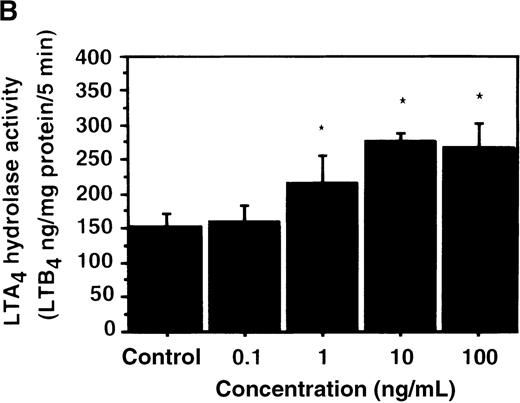
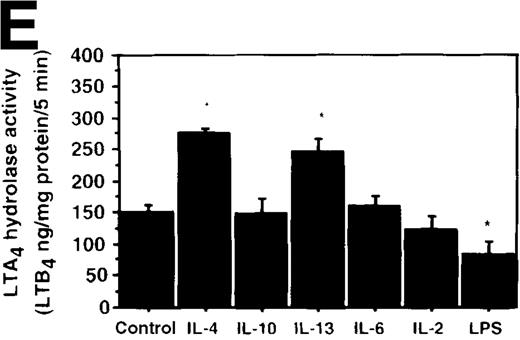
We further examined the effect of IL-4 on LTA4hydrolase activity by an enzyme assay using the cell lysate as an enzyme source and LTA4-free acid as the substrate. The activity of LTA4 hydrolase in PMNs without IL-4 treatment was 151.7 ± 5.8 ng/mg protein/5 min. The level of LTA4 hydrolase activity was significantly increased to 273.9 ± 4.4 ng/mg protein/5 min after incubation with IL-4 (10 ng/mL) for 6 hours (Figure 6A). Dose-response study showed that the maximal enhancement was obtained at 10 ng/mL (Figure 6B). IL-13 (100 ng/mL) also increased LTA4hydrolase activity (Figure 7E).
The effect of IL-4 on LTA4 hydrolase activity.
(A) Time-course study. After PMNs were incubated with 10 ng/mL of IL-4 for various periods of time, the cell lysates were prepared and incubated with LTA4 at 37°C for 5 minutes. The supernatant was recovered, and the concentration of LTB4was measured by HPLC as described in “Materials and methods.” (B) Dose-response study. After PMNs were incubated with various concentrations of IL-4 (0.1, 1, 10, 100 ng/mL) for 6 hours, the cell lysates were incubated with LTA4 at 37°C for 5 minutes. The supernatant was recovered, and the concentration of LTB4 was measured by HPLC. Data represent mean ± SEM (n = 4). *P < .05 versus control.
Effect of IL-4, IL-10, IL-13, IL-6, IL-2, and LPS.
(A) Effect of IL-4, IL-10, IL-13, IL-6, IL-2, and LPS on A23187-stimulated production of LTB4. PMNs were incubated with IL-4 (10 ng/mL), IL-10 (100 ng/mL), IL-13 (100 ng/mL), IL-6 (100 ng/mL), IL-2 (10 ng/mL), or LPS (100 ng/mL) for 6 hours. A23187-stimulated LTB4 production was measured by RIA as described in “Materials and methods.” Data represent mean ± SEM (n = 4). *P < .05 versus control. (B) Effect of IL-4, IL-10, IL-13, IL-6, IL-2, and LPS on mRNA expression for LTA4 hydrolase. After PMNs were incubated with IL-4 (10 ng/mL), IL-10 (100 ng/mL), IL-13 (100 ng/mL), IL-6 (100 ng/mL), IL-2 (10 ng/mL), or LPS (100 ng/mL) for 6 hours, total RNA was isolated and RT-PCR for LTA4 hydrolase was performed as described in “Materials and methods.” (C) Northern blot analysis for LTA4 hydrolase. After PMNs were incubated with IL-4 (10 ng/mL), IL-10 (100 ng/mL), IL-13 (100 ng/mL), or LPS (100 ng/mL) for 6 hours, total RNA was isolated and Northern blot analysis for LTA4 hydrolase was performed as described in “Materials and methods.” The same membrane was rehybridized with a human beta-actin probe as a control. The positions of marker RNA are indicated by arrows. (D) Effect of IL-4, IL-10, IL-13, IL-6, IL-2, and LPS on protein expression of LTA4 hydrolase. PMNs were incubated with IL-4 (10 ng/mL), IL-10 (100 ng/mL), IL-13 (100 ng/mL), IL-6 (100 ng/mL), IL-2 (10 ng/mL), or LPS (100 ng/mL) for 6 hours. The cell lysates were prepared. Equal amount of protein (20 μg) were applied on 8% SDS-PAGE and electro-transferred onto nitrocellulose membrane. Western blot analysis was performed with anti-cPLA2, anti-5-LO, or anti-LTA4 hydrolase antibody as described in “Materials and methods.” The positions of molecular marker proteins are indicated by arrows. (E) Effect of IL-4, IL-10, IL-13, IL-6, IL-2, and LPS on LTA4 hydrolase activity. After PMNs were incubated with IL-4 (10 ng/mL), IL-10 (100 ng/mL), IL-13 (100 ng/mL), IL-6 (100 ng/mL), IL-2 (10 ng/mL), or LPS (100 ng/mL) for 6 hours, the cell lysates were prepared and incubated with LTA4 at 37°C for 5 minutes. The supernatant was recovered, and the concentration of LTB4 was measured by HPLC as described in “Materials and methods.” Data represent mean ± SEM (n = 4). *P < .05 versus control.
Effect of other cytokines and bioactive substances: IL-6, IL-2, and LPS on LTB4 synthesis in human PMNs
To examine the effects of other cytokines and bioactive substances on LTB4 synthesis in human PMNs, we examined the action of IL-6, IL-2, and LPS. LPS significantly inhibited A23187-stimulated production of LTB4 from 2075 ± 125.0 pg/105 cells to 975 ± 110.9 pg/105 cells, and IL-2 tended to decrease it to 1100 ± 108.0 pg/105 cells (P = .08) (Figure7A). Enzyme protein synthesis, mRNA expression, and enzyme activity for LTA4 hydrolase were also suppressed by LPS treatment (n = 4, P < .05) (Figure 7B-E).
Effect of IL-4, IL-10, IL-13, IL-6, IL-2, and LPS on A23187-induced TXB2 production in human PMNs
We also examined the action of IL-4, IL-10, IL-13, IL-6, IL-2, and LPS on arachidonate-COX pathway by measuring A23187-stimulated production of TXB2. As shown in Table2, A23187-stimulated production of TXB2 tended to decline after incubation with IL-4 and IL-13, but the decline was not significant. On the other hand, 6 hours' exposure to LPS (100 ng/mL) enhanced A23187-stimulated production of TXB2 from 605 ± 32.3 pg/106cells (control) to 917 ± 42.7 pg/106 cells (n = 4,P < .05). Other cytokines showed no significant action on the production of TXB2.
Discussion
We found that IL-4 and IL-13 increased the production of LTB4 by up-regulating the activity of LTA4hydrolase in human PMNs. This up-regulation was associated with the increased mRNA expression and new protein synthesis of LTA4hydrolase.
IL-4 and IL-13 are produced by Th2 cells, which are dominant in patients with allergic diseases, such as bronchial asthma and atopic dermatitis.1 25-29 IL-4 caused immunoglobulin-class
switching in B-lymphocytes and exerted the immunoglobulin-producing cells to synthesize more IgE.30 IL-4 also induced adhesion molecules on the surface of vascular endothelium and bronchial epithelium and caused migration of eosinophils and neutrophils into the airway in bronchial asthma.4,5,31 Clinical studies demonstrated that the levels of IL-4 were correlated with the numbers of eosinophils in BALF in patients with bronchial asthma, and IL-4 inhalation caused bronchial hyperresponsiveness in these patients.5,29 IL-13 has similar biological functions because the receptor for IL-4 shares many components with that of IL-13.32-35 IL-13 was able to induce immunoglobulin isotype switching to IgE in B-lymphocytes.36 IL-13 also induced adhesion molecules in mouse lung epithelial cells37 and in human lung fibroblasts.31 IL-13 mRNA was up-regulated in bronchial mucosa from patients with bronchial asthma.27Endobronchial allergen challenge increased the concentration of IL-13 in BALF from asthmatic patients.38 Thus, IL-4 and IL-13 play significant roles in the initiation and development of allergic inflammation.
Airway inflammation is an important feature in patients with bronchial asthma.39 The increased number of inflammatory cells was demonstrated in airway secretion and biopsy samples from asthma patients when compared with the control subjects.40-44 The inflammatory cells were not only eosinophils, mast cells, and monocytes but also neutrophils.45-47 Investigators reported that the number of neutrophils in airways was significantly increased in sudden-onset fatal asthma and nocturnal asthma.48-50 Allergen inhalation resulted in acute bronchoconstriction (early allergic response), which was followed by late-phase allergic reaction (LAR) after 6 to 8 hours in sensitized animals and asthma patients. LAR was associated with the accumulation of inflammatory cells, including eosinophils, macrophages, and mast cells.51-53 In the time-course study, neutrophils were increased in the early phase of this event and then replaced by other inflammatory cells.9,47,54 55 These studies suggested that neutrophils might play important roles in developing bronchial hyperreactivity and allergic inflammation by directly injuring airway epithelium and/or by recruiting other inflammatory cells.
The current study has shown that IL-4 and IL-13 significantly enhanced the synthesis of LTB4 in PMNs. LTB4 is an arachidonate 5-LO metabolite and a potent chemotactic factor to eosinophils as well as neutrophils. Some investigators reported that the LTB4 synthesizing activity in peripheral leukocytes was enhanced in bronchial asthma.56-58 We also reported that the level of LTB4 in BALF obtained from children with severe asthma attacks was significantly higher than that of normal subjects.59 LTB4 is synthesized predominantly in neutrophils. The synthesis of LTB4 is initiated by transmembranous stimulation by various factors that increase the level of intracellular calcium ion, leading to the translocation of cPLA2 from cytosol to nuclear membrane.60,61Cytosolic PLA2 cleaves AA from membrane phospholipid of the nucleus. The released AA is converted into LTA4 via an unstable intermediate, 5-hydroperoxyeicosatetraenoic acid, by 5-LO, which is also translocated from cytosol to nuclear membrane where FLAP resides.62,63 The final step is the transformation of LTA4 to LTB4 by LTA4 hydrolase. Thus, LTA4 hydrolase is a key enzyme of LTB4synthesis. We previously reported that cPLA2 is transcriptionally up-regulated by LPS in human PMNs.20 5-LO and FLAP are also newly induced by granulocyte-macrophage colony–stimulating factor in human neutrophils.14,15,64 To our knowledge, there have been no reports that the activity of LTA4 hydrolase is up-regulated by bioactive substances such as interleukins and growth factors in human neutrophils. In a clinical study, Okano-Mitani et al reported that LTA4 hydrolase activity was increased in peripheral leukocytes from patients with atopic dermatitis.65 Our demonstration that IL-4 and IL-13 cause a new induction of LTA4 hydrolase activity reveals a novel up-regulatory mechanism of LTB4 synthesis in human PMNs. We speculate that IL-4 and IL-13 enhance the transmigration of neutrophils and eosinophils into airway submucosa by increasing the synthesis of LTB4 and that they amplify the airway inflammation. However, one should be careful to translate the results of the current in vitro study to in vivo phenomena because isolated PMNs are placed in nonphysiologic conditions and A23187 provides no receptor-mediated stimulation.
The enhancement of LTA4 hydrolase activity in neutrophils is considered to be transcriptionally up-regulated because the human LTA4 hydrolase gene, which is located in 12q 22, has inducible promoter regions, including phorbol-ester-response element (AP-2) and 2 xenobiotic-response elements.66Further studies are needed to explore more precise mechanisms.
LTA4 hydrolase is found abundantly in red blood cells as well as neutrophils.67 68 However, red blood cells cannot produce much LTB4 without transference of LTA4 from other LTA4-producing cells because red blood cells have no 5-LO activity. Therefore, neutrophils are the largest source of LTB4 in humans.
Recent studies revealed that LPS, bacterial endotoxin, increased the synthesis of TXA2 and PGE2, arachidonate COX products, by transcriptionally up-regulating COX-2 in human PMNs.20-22 The new induction of COX-2 by LPS was inhibited by exogenously added IL-4 and IL-10.21 Th2 cytokines thus negatively regulate the arachidonate COX pathway and positively regulate the 5-LO pathway in PMNs. Thromboxanes and prostaglandins are the final products of alternative pathway of AA metabolism. AA is alternatively converted by COX-1 and/or COX-2 to PGH2, which is converted to PGE2, PGF2a, PGD2, PGI2, and/or TXA2 depending on cell types. TXA2 and PGE2 are the major products in the COX pathway and are proinflammatory lipid mediators produced in PMNs. These biological actions are associated predominantly with the process of nonallergic inflammation caused by bacterial invasion, ischemia, and autoimmune mechanisms. In general, arachidonate COX metabolites are associated with nonallergic inflammation. On the other hand, 5-LO metabolites such as LTC4, LTD4, LTE4, and LTB4 are predominantly involved in allergic inflammation. It is quite interesting that allergy-associated cytokines IL-4 and IL-13 tend to suppress COX-2 activity and enhance LTA4hydrolase activity, resulting in the increased production of LTB4 in Th2 cell–dominant circumstances.
Our study is the first demonstration that Th2-associated cytokines IL-4 and IL-13 up-regulate LTB4 synthesis in PMNs by increasing LTA4 hydrolase activity at both the mRNA and the protein levels. Our data suggested that (1) Th2-cell–associated cytokines, IL-4 and IL-13, increase the level of LTB4production in PMNs in the process of allergic inflammation and (2) PMN-derived LTB4 may be a key factor amplifying the inflammation. Our results also indicate that the up-regulation of LTB4 synthesis by IL-4 and IL-13 is specifically attributable to LTA4 hydrolase, but not to cPLA2, 5-LO, or FLAP.
Acknowledgment
We would like to thank Professor Daniel Tai for providing anti-LTB4 and anti-TXB2 rabbit sera.
Supported by grants from The Ministry of Education, Science, Sports, and Culture of Japan.
Reprints:Masafumi Zaitsu, Department of Pediatrics, Saga Medical School, 5-1-1 Nabeshima, Saga 849-8501, Japan; e-mail:g9609@post.saga-med.ac.jp.
The publication costs of this article were defrayed in part by page charge payment. Therefore, and solely to indicate this fact, this article is hereby marked “advertisement” in accordance with 18 U.S.C. section 1734.

