Abstract
Chronic lymphocytic leukemia (CLL) cells can be made to express recombinant CD40-ligand (CD154) by transduction with a replication-defective adenovirus vector (Ad-CD154). Ad-CD154–transduced and bystander leukemia cells become highly effective antigen-presenting cells that can induce CLL-specific autologous cytotoxic T lymphocytes in vitro. This study investigated the immunologic and clinical responses to infusion of autologous Ad-CD154-CLL cells in patients with CLL. After a one-time bolus infusion of autologous Ad-CD154–transduced leukemia cells, there was increased or de novo expression of immune accessory molecules on bystander, noninfected CLL cells in vivo. Treated patients also developed high plasma levels of interleukin-12 and interferon-γ, the magnitudes of which corresponded to absolute blood CD4+T-cell counts before therapy. On average, patients experienced a greater than 240% increase in absolute blood T-cell counts within 1 to 4 weeks of treatment. Moreover, treatment increased the numbers of leukemia-specific T cells, demonstrated by autologous ELISPOT assay and mixed lymphocyte reactions. These biologic effects were associated with reductions in leukemia cell counts and lymph node size. Treatment did not induce autoimmune thrombocytopenia or hemolytic anemia and no dose-limiting toxicity was observed. This approach may provide a novel and effective form of gene therapy for patients with this disease.
Introduction
Chronic lymphocytic leukemia (CLL) is the most common adult leukemia in the United States.1 It is characterized by progressive accumulation of well-differentiated malignant monoclonal B lymphocytes in blood, lymph nodes, liver, spleen, and marrow.2 Progression of the disease is typified by increases in blood lymphocyte count; increases in the size of lymph nodes, liver, and spleen; and advancing anemia and thrombocytopenia. Although chemotherapy may palliate symptoms, there is no established cure. This necessitates development of new treatments with a different mechanism of action.
Several features of this disease suggest that immune-based strategies may have therapeutic potential. CLL B cells are slowly dividing, monoclonal B cells that express differentiation antigens, major histocompatibility complex (MHC) class I and II molecules, and surface immunoglobulin (Ig).2,3 The Ig molecules expressed by the CLL B cells have features that distinguish them from the Ig molecules expressed by normal, nonmalignant B cells, even when encoded by nonmutated Ig variable region genes.4-6 Also, complex cytogenetic abnormalities frequently accumulate over time in CLL B cells.2,3,7 8 These genetic differences could result in CLL-specific antigens that may be recognized by the host immune system.
However, despite expressing high levels of MHC class I and II molecules, CLL B cells are ineffective antigen-presenting cells (APCs). Indeed, CLL B cells are unable to stimulate even normal allogeneic T cells in a mixed lymphocyte reaction (MLR).9-13 This is due in part to their lack of important costimulatory surface molecules, such as CD80 and CD86, which are necessary for efficient T-cell activation.9 14-16
We found that activated T cells could induce CLL B cells to become effective APCs.9 This effect was mediated largely by the ligand for CD40, designated CD154. CD154 is a type II membrane glycoprotein that is expressed transiently by activated CD4+ T cells.17 Normally, CD154 engages CD40 on potential APCs, including B cells, monocytes, and dendritic cells, and induces expression of accessory surface molecules that are important in cognate costimulatory cell-cell interactions. CLL B cells express CD40 and also are induced to express de novo or enhanced amounts of CD54, CD70, CD80, CD86, and CD95, following CD40 ligation in vitro. Such phenotypic changes allow these cells to function as effective stimulators of allogeneic or autologous T cells in a mixed lymphocyte culture.18 Conceivably, such activated neoplastic B cells also may present tumor-associated antigens to autologous T cells, allowing for the immune rejection of tumor, as recently observed in animal models of B-cell lymphoma.19 20
The CLL B cells can be transduced in vitro with high-titer, replication-defective adenovirus vector to express high levels of transgene.21 A replication-defective adenovirus vector was constructed using serotype 5 adenovirus in which the E1 region of the virus genome was replaced with the gene encoding murine CD154 flanked in the 5′ direction with a heterologous cytomegalovirus (CMV) promoter, and in the 3′ direction with a bovine polyadenylation signal (Ad-CD154). Substantial numbers of CLL B cells can be transduced in vitro to express the CD154 transgene using this adenovirus vector.18 Expression of CD154 transgene by CLL B cells simulates exposure of these cells to activated T cells and induces leukemia cell expression of immune costimulatory surface molecules. In addition, CLL B cells that express CD154 can induce noninfected, bystander CLL B cells to express such surface molecules. When tested in vitro, Ad-CD154–infected CLL B cells, but not CLL cells infected with an adenovirus vector encoding an irrelevant transgene, could stimulate allogeneic as well as autologous T cells in an MLR, thereby inducing T-cell proliferation and production of interferon-γ (IFN-γ). Moreover, Ad-CD154–infected CLL B cells, but not CLL cells infected with a control adenovirus vector, could induce generation of cytotoxic T lymphocytes (CTL) against noninfected autologous CLL B cells in vitro.18 Because these in vitro studies suggested that Ad-CD154 potentially could elicit a therapeutic host antileukemia immune response, we performed a phase I dose-escalation study assessing the safety of administering a single intravenous infusion of autologous Ad-CD154–transduced leukemia cells to patients with B-cell CLL.
Patients, materials, and methods
Patients and CLL B-cell transduction
Eleven patients were entered into the study (Table1). All patients had progressive intermediate or high-risk CLL by the modified Rai criteria. Four of the patients previously were treated with chemotherapy. All patients had performance status of 0 to 2, life expectancy of more than 3 months, and normal renal, hepatic, and pulmonary function on study entry. Also, all patients had evidence of serum antibody against Ad5 adenovirus by Western blot analysis (data not shown).
After providing informed consent, patients underwent leukapheresis. Blood mononuclear cells were isolated via density gradient centrifugation and then infected for 24 hours with high-titer replication-defective Ad-CD154 in a Good Manufacturing Practice (GMP) facility, as described.21 Following infection, the cells were washed extensively to remove free virus and viably frozen in 10% dimethylsulfoxide (DMSO) for storage in liquid nitrogen. An aliquot of cells was taken before freezing for bacterial culture to ensure sterility. On the day of treatment, the transduced cells were thawed and washed before intravenous infusion. The autologous transduced cells were administered as a single intravenous bolus infusion over approximately 10 minutes.
Mononuclear cell and T-cell isolation
Whole blood was collected from the patients into heparinized tubes and then spun at 100g for 10 minutes. The plasma was removed and then stored at −80°C. Mononuclear cells were isolated via Ficoll-Hypaque density gradient centrifugation on Histopaque 1077 (Sigma Chemical, St Louis, MO). Following isolation, the cells were washed and suspended in RPMI-1640. Autologous T cells were isolated using anti-CD4 and anti-CD8–conjugated magnetic beads where indicated (Dynal, Lake Success, NY). For this, the mononuclear cells (1 × 10⁸) were incubated with magnetic beads (200 μL/each) for 1 hour at 4°C. The estimated number of Dynalbeads per T cell was 4 to 10. The magnetic bead–bound CD4+ and CD8+ cells were washed and eluted by DETACHaBEAD (100 μL) for 1 hour at room temperature. Over 95% of the isolated cells expressed CD3 as assessed by flow cytometry (data not shown).
Reverse transcriptase–polymerase chain reaction
Total RNA was isolated from 5 × 10⁶ blood mononuclear cells using RNeasy kit (Quiagen, Chatsworth, CA). First strand complementary DNA (cDNA) was synthesized using 5 μg of total RNA, the Superscript cDNA synthesis kit (GIBCO BRL, Gaithersburg, MD), and oligo-dT primers. The residual RNA was removed with RNAseH and one fourth of the cDNA was used in the polymerase chain reaction (PCR) reaction. The PCR reactions were performed for 30 cycles in 50 μL of 1 × Boehringer Mannheim amplification buffer (Indianapolis, IN), Taq polymerase, and 200 μmol/L of dNTP. Primers for the murine CD154 consisted of the sense primer 5′-GATGAGGATCCTCAAATTG-3′ and the antisense primer 5′-GTTTCTAGATCAGAGTTTGAGTAAGCC-3′ (nt 346-783); these amplified a 437-bp fragment of the 3′ end of the CD154 molecule. One fifth of the amplified PCR product was visualized on a 1% agarose gel by ethidium bromide staining.
Enzyme-linked immunosorbent assay for plasma cytokines
We measured the levels of plasma cytokines by enzyme-linked immunosorbent assay (ELISA). We added antihuman IFN-γ, interleukin (IL)-6, IL-1α, IL-4, or tumor necrosis factor (TNF)-α capture antibody (PharMingen, San Diego, CA) at 10 μg/mL phosphate buffer (0.1 mol/L Na2HPO4, pH 9.0) to individual wells of a 96-well EIA/RIA A/2 ELISA plate (Costar, Cambridge, MA). After an overnight incubation at 4°C, the plates were washed twice with wash buffer (0.05% Tween 20 in phosphate-buffered saline [PBS]). The wells then were filled with PBS containing 10% fetal calf serum (FCS) to block residual protein-binding activity. The plates were washed 4 times with wash buffer and incubated overnight with the patient plasma samples at 4°C. Recombinant human IFN-γ, IL-6, IL-1α, IL-4, or TNF-α was used for standard curve (1:2 serial dilutions in detection buffer (10% FCS, 0.05% Tween 20 in PBS). The plates were washed 4 times in wash buffer and incubated for 1 hour at room temperature with biotinylated-mouse antihuman IFN-γ, IL-6, IL-1α, IL-4, or TNF-α (PharMingen) 5 μg/mL in detection buffer. The plates were washed twice and treated with Avidin and biotinylated horseradish peroxidase (Elite Vectastain, Vector Laboratories, Burlingame, CA) for 1 hour at room temperature. IL-2 and IL-12 (p70) concentrations were determined using OptEIA ELISA kits (PharMingen, La Jolla, CA). After the plates were washed 5 times, the substrate TMB peroxidase was added (Kirkegaard & Perry Laboratories, Gaithersburg, MD). The OD at 450 nm was measured using an ELISA microplate reader (Molecular Devices, Menlo Park, CA) and cytokine concentrations were extrapolated from the standard curves.
ELISPOT assay
One hundred microliters of anti–IFN-γ antibody (clone no. 2G1, Endogen, Woburn, MA) at 10 μg/mL in sterile PBS (pH 7.4) was added to each well of a 96-well nitrocellulose plate (Millipore, Bedford, MA). After an overnight incubation at 4°C, the plates were washed 4 times with sterile PBS. Residual protein-binding sites were blocked by adding 200 μL/well of PBS containing 1% bovine serum albumin (BSA) or 10% FCS for a 30-minute or longer incubation at 37°C prior to adding cells. Serial dilutions of autologous T cells suspended in serum-free AIM-V media were added to separate wells of the microtiter plate (100 μL/well). A fixed number (1 × 10⁵ cells/well) of CD40-activated autologous CLL B stimulator cells was added to wells to give varying responder/stimulator ratios. The CD40-activated autologous CLL B cells were prepared from leukapheresis mononuclear cells by culturing the cells for 48 hours at 37°C either with HeLa cells transfected to express human CD154 or with their culture supernatant, which contained approximately 5 ng/mL soluble CD154, as assessed by ELISA. All assay media contained recombinant IL-2 at a final concentration of 25 U/mL. The murine anti-HLA mAb W6/32 was added to a final concentration of 10 μg/mL to some of the wells, as indicated. The plates were incubated for 48 hours at 37°C in a 5% CO2 incubator, washed free of cells 4 times with PBS, and then washed 4 times with PBS containing 0.05% Tween 20. One hundred microliters of biotinylated secondary anti–IFN-γ antibody (clone B133.5, Endogen) was added to each well at 1 μg/mL in PBS containing 4% BSA. After 1 hour of incubation at 37°C, the wells were washed 4 times with PBS with 0.05% Tween 20. Then, 100 μL of horseradish peroxidase (HRP)-conjugated Streptavidin at 1:500 concentration in PBS with 0.05% Tween 20 was added to each well. The plates were incubated for 30 minutes at room temperature. The wells then were washed 4 times with PBS containing 0.05% Tween 20. Fresh AEC substrate was prepared by dissolving one tablet of 3-amino-9-ethylcarbazol (Sigma) in 5 mL dimethylformamide and then diluting this into 45 mL of sodium acetate buffer, pH 5.0, that contains 25 μL of freshly added 30% hydrogen peroxide. Then 100 μL of AEC substrate was added to each well and the plates were incubated for 5 minutes or more at room temperature. The substrate solution was discarded and the plates were rinsed with tap water and air-dried. After the plates were completely dry, spots were counted for each well manually with a stereomicroscope.
Results
Infusion of Ad-CD154–transduced autologous CLL B cells
Eleven patients with progressive, intermediate or high-risk CLL by the modified Rai criteria were treated (Table 1). Patients received their autologous transduced cells an average of 44 ± 23 days after leukapheresis (range, 10-77 days). Five patients received approximately 3 × 10⁸ (pilot group and group 1), 3 received approximately 1 × 10⁹ (group 2), and 3 received approximately 3 × 10⁹ (group 3) autologous Ad-CD154–transduced CLL cells according to a dose-escalation design (Table 1).
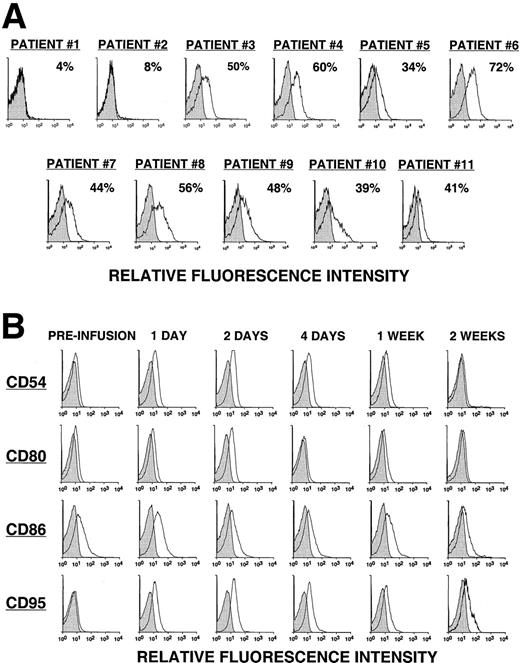
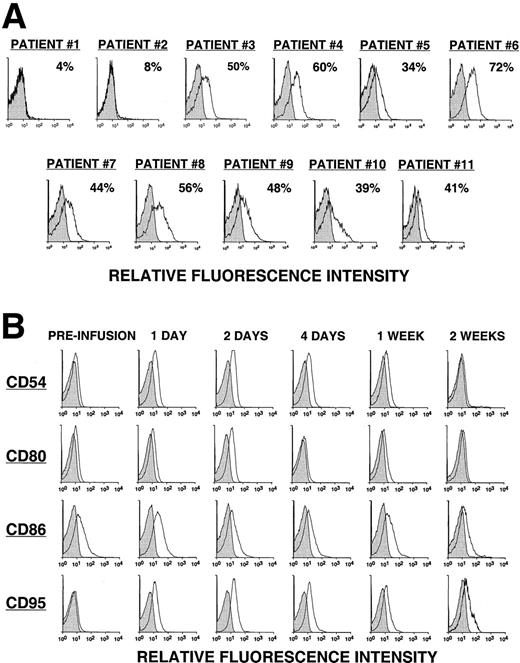
Fewer than 8% of the leukemia cells from the first 2 patients (pilot group) expressed detectable levels of the CD154 transgene, as assessed by direct monoclonal antibody (mAb) staining and flow cytometric analysis (Figure 1A). The 2 patients in the pilot group did not have a discernible clinical response to the infusion. On the other hand, approximately half (49% ± 11%) of the CLL cells of patients in groups 1, 2, and 3 expressed the CD154 transgene, as assessed by flow cytometry (Figure 1A). Moreover, these cells had an average mean fluorescence intensity ratio (MFIR) of 4.8 ± 1.6 when stained with a fluorochrome-labeled anti-CD154 mAb versus a fluorochrome-labeled, isotype-matched control mAb of irrelevant specificity. As expected, the expression of the CD154 transgene by Ad-CD154–infected CLL B cells resulted in increased and/or de novo expression of immune accessory molecules, for example, CD54, CD95, CD80, and CD86 (data not shown).
CD154 transgene expression by Ad-CD154–infected CLL B cells and in vivo modulation of costimulatory molecules on bystander leukemia cells following Ad-CD154-CLL infusion.
(A) Following Ad-CD154 infection, blood mononuclear cells were stained with fluorochrome-labeled mAbs specific for CD19 and CD154 or an irrelevant specificity (isotype control). Cells were analyzed by multiparameter flow cytometry. The histograms depict the logarithmic fluorescence intensity of the gated CD19+ B-cell population stained with mAb against CD154 or an isotype control mAb. (B) Blood mononuclear cells were isolated from patients immediately before the infusion of autologous Ad-CD154–transduced CLL cells and on days 1, 2, 4, 7, and 14 thereafter. The cells were stained with fluorochrome-labeled mAbs specific for CD19 and another surface antigen, or an isotype control, as indicated. The histograms depict the staining of the gated CD19+ B-cell population with the respective mAbs or an isotype control mAb.
Immunologic response to Ad-CD154–transduced CLL cells
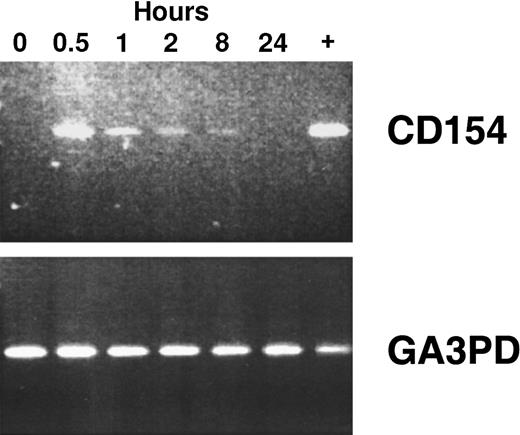
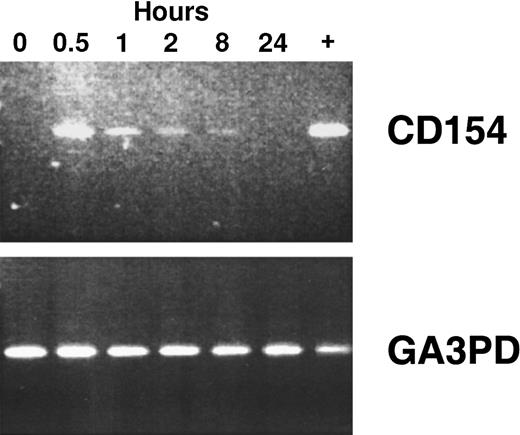
Using reverse transcriptase (RT)–PCR, we detected expression of the CD154 transgene in the blood mononuclear cells of patients of groups 1 to 3 for at least 8 hours after the infusion of Ad-CD154–transduced leukemia cells (Figure2). However, bystander leukemia cells that did not express the CD154 transgene had de novo or enhanced expression of CD80, CD86, CD54, and/or CD95 for several days after treatment (Figure 1B, Table 2, and data not shown). Such changes were not observed on the leukemia cells of patients in the pilot group, suggesting that a threshold number of infused Ad-CD154–transduced CLL B cells was required for this effect. Nevertheless, we did not otherwise discern a clear dose-response relationship between the number of infused Ad-CD154–transduced cells and the extent of the phenotypic changes on bystander cells of patients in groups 1, 2, and 3.
CD154 transgene expression in blood mononuclear cells isolated after infusion of autologous Ad-CD154–transduced CLL cells.
To demonstrate CD154 transgene and the housekeeping gene glyceraldehyde-3-phosphate dehydrogenase (GA3PD) expression, RT-PCR was performed on messenger RNA (mRNA) isolated from blood mononuclear cells isolated from patient 003 prior to cell infusion and 0.5, 1, 2, 8, and 24 hours thereafter. The far right lane (+) represents RT-PCR performed with mRNA prepared from an aliquot of Ad-CD154–transduced cells used for infusion.
We examined whether there was a serum factor(s) induced by the infusion of Ad-CD154-CLL cells that could affect leukemia cell survival or expression of immune accessory molecules. For this, CLL cells obtained from patients before therapy were cultured for 24 hours in media supplemented with autologous serum collected before therapy and 8, 24, or 48 hours after the infusion of Ad-CD154-CLL cells. CLL cells cultured in media supplemented with 25% sera from any one of these time points had the same relative viability, as assessed by their ability to exclude propidium iodide (data not shown). Moreover, we did not observe any one of these sera to induce leukemia cells to increase their relative expression levels of CD80, CD86, or CD95 as assessed by flow cytometry (data not shown).
High levels of Th1-type cytokines were detected in the plasma from patients in groups 1 to 3 after infusion of Ad-CD154-CLL cells. Two of the 3 patients in group 1 and all patients of groups 2 and 3 had high plasma concentrations of IL-12 and IFN-γ 8 to 48 hours after the infusion of Ad-CD154–transduced cells (Table3). Peak IL-12 levels correlated with peak IFN-γ levels by nonparametric analysis (Spearman r = 0.7782, 2-tailed P = .017). However, the IL-12 levels were noted to rise more rapidly and to peak earlier than that of the plasma levels of IFN-γ (Table 3). In contrast, 105 CD19+Ad-CD154–infected CLL B cells produced less than 0.2 pg of IL-12 and less than 0.2 ng of IFN-γ in 48 hours in vitro, suggesting that the Ad-CD154–transfected leukemia B cells were not the source of the plasma Th1 cytokines detected in vivo (data not shown).
We also observed increases in absolute numbers of blood T cells following the infusion of Ad-CD154–transduced cells. Such increases followed the rise in cytokine levels by several days and lasted several weeks. All 3 patients in group 1 had substantial increases (206%-482%) in the absolute numbers of blood T cells by 1 to 4 weeks after the infusion of Ad-CD154–transduced CLL cells (Table4). Two of the 3 patients in group 2 had significant increases (109% and 386%) in the numbers of T cells 1 to 3 weeks after treatment (Table 4). Finally, all 3 patients in group 3 had significant increases (97%-412%) in the absolute numbers of blood T cells within 1 to 4 weeks after the infusion of Ad-CD154–transduced cells (Table 4). We observed increases in the absolute numbers of both CD4+ and CD8+ T cells, commonly resulting in absolute T-cell numbers of more than 4000 to 5000/μL of blood after therapy (Table 4).
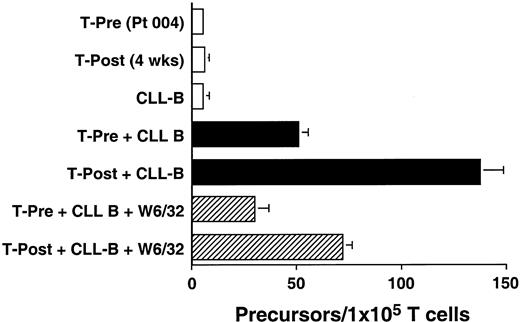
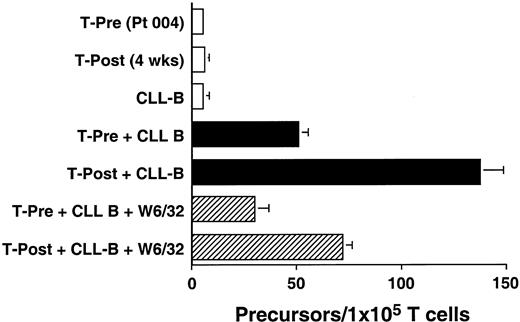
We used an ELISPOT assay to examine whether the increases in absolute T-cell counts after treatment were associated with expansions in the numbers of T cells that were reactive against autologous CLL B cells. Blood T cells from patients before therapy and 4 weeks after treatment were cultured for 48 hours with CD40-activated autologous CLL B cells. The proportions of T cells induced to make IFN-γ in response to autologous CD40-activated CLL B cells increased after treatment. This response could be partially inhibited by W6/32, a mouse mAb specific for a nonpolymorphic determinant found on all HLA class I molecules, but not by a control mouse mAb of irrelevant specificity (Figure3 and data not shown). Similar reproducible findings were observed in all patients tested (n = 3, data not shown).
Ex vivo T-cell production of IFN-γ in response to autologous CLL cells before and after infusion of Ad-CD154–transduced CLL cells.
The data from 1 of 3 representative experiments on each of 3 different patients are presented. Blood mononuclear cells were isolated from patient 004 prior to (T-Pre) and 4 weeks after infusion of Ad-CD154–transduced CLL cells (T-Post). T cells were isolated from the blood mononuclear cells using CD4- and CD8-specific Dynabeads. A 48-hour ELISPOT for IFN-γ–producing T cells was performed at a responder/stimulator ratio of 1:1. The mean number of spots per duplicate wells is expressed as the T-cell precursor frequency per 1 × 10⁵ T cells. The error bars indicate the SD about the mean.
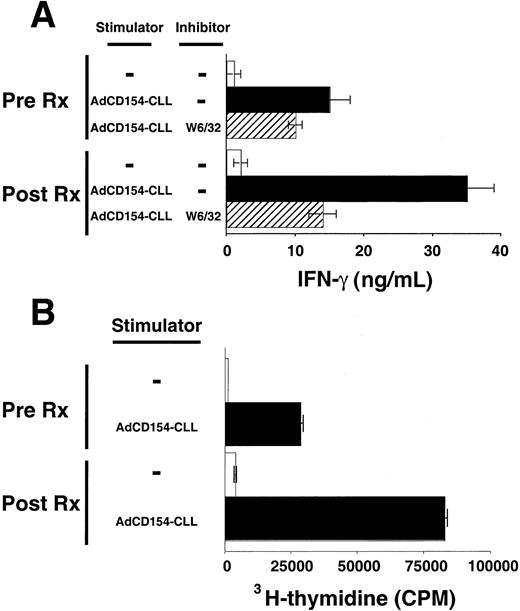
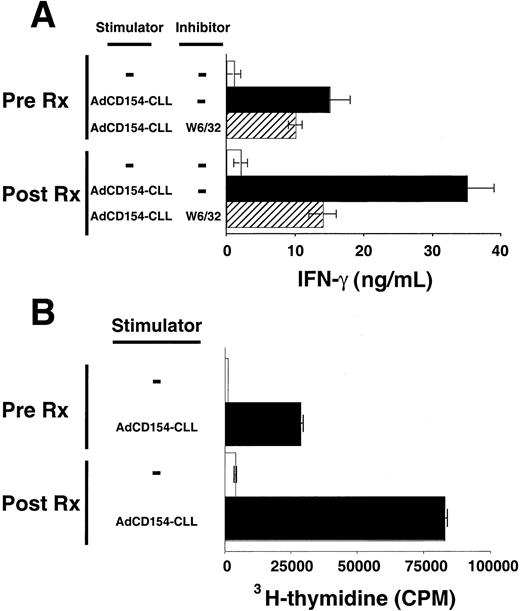
Patients' blood T cells collected several weeks after treatment also had increased reactivity against autologous CLL B cells relative to that of blood T cells collected before therapy. T cells were collected 6 months after treatment with Ad-CD154-CLL and examined for their ability to mount MLRs against autologous CLL B cells. Such T cells produced significantly greater amounts of IFN-γ in response to autologous CLL B cells than equal numbers of T cells collected before treatment (Figure 4A). Furthermore, these T cells collected after treatment incorporated significantly higher levels of 3H-thymidine in the MLR with autologous CLL cells than T cells collected before treatment (Figure 4B). Both T-cell production of IFN-γ and proliferation were dependent on the presence of CLL stimulator cells and could be partially inhibited by the anti-HLA class I mAb, W6/32, but not by MOPC21, an isotype control mAb of irrelevant specificity.
Activation and proliferation of T cells by autologous CLL cells before and after infusion of Ad-CD154–transduced CLL cells.
T cells were isolated from the blood mononuclear cells collected from patient 003 prior to (Pre Rx) and 6 months after infusion of Ad-CD154–transduced CLL cells (Post Rx). Autologous CLL B cells were infected with Ad-CD154 for 24 hours at a multiplicity of infection of 300. Transduced cells were treated with mitomycin C (60 μg/mL) for 1 hour and then washed prior to using them as stimulator cells (Ad-CD154-CLL) for autologous MLRs with the isolated T cells. (A) Patient T cells (1 × 10⁶ cells/well) with or without autologous stimulator cells (Ad-CD154-CLL) (5 × 10⁵cells/well) were added to wells of a 96-well plate in serum-free AIM-V medium containing recombinant IL-2 at 25 U/mL. The murine anti-HLA mAb W6/32 was added to a final concentration of 10 μg/mL to some wells, as indicated. Plates were incubated for 4 days at 37°C prior to harvesting the supernatants. IFN-γ concentration in the supernatants was determined by standard capture ELISA. The graph depicts the mean IFN-γ concentration of triplicate wells. The error bars indicate the SD about the mean. (B) Patient T cells (1 × 10⁶cells/well) with or without autologous stimulator cells (Ad-CD154-CLL) (5 × 10⁵ cells/well) were added to wells of a 96-well plate as described in panel A. The plates were incubated for 84 hours at 37°C prior to adding 3H-thymidine to each well at 1 μCi per well. The cells were harvested 12 hours later and the incorporated 3H-thymidine assessed by scintillation counting. The mean cpm values of triplicate wells are indicated ± SD.
Clinical response to Ad-CD154–transduced CLL cells
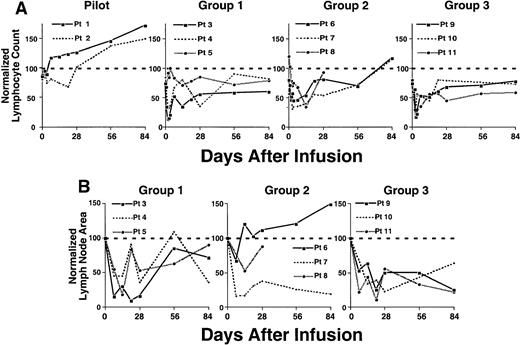
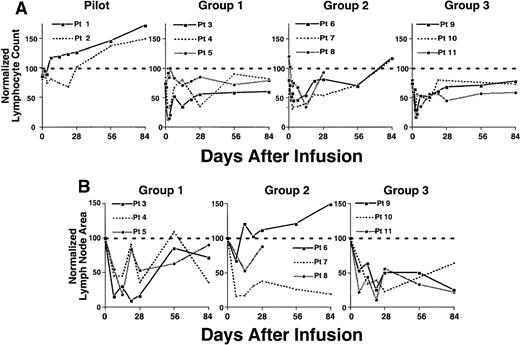
Because 97% or more of the blood lymphocytes of the patients in this study were CLL B cells (Tables 1 and 4), we monitored the absolute blood lymphocyte counts to follow the clinical response to treatment. Pilot study patients 001 and 002, who received autologous CLL cells of which only 4% or 8% expressed the CD154 transgene (Figure 2), did not have significant, sustained reductions in blood lymphocyte counts (Figure 5A). Although pilot group patient 002 did have a 30% or less reduction in blood lymphocyte count from pretreatment values, this was not sustained beyond 3 weeks after treatment. Moreover, 3 weeks after treatment, the blood lymphocyte counts of both patients in the pilot group persistently increased at rates similar to those observed before therapy (Figure 5A and data not shown), indicating that these patients continued to have progressive disease.
Reductions in absolute lymphocyte count and lymph node size following an infusion of autologous Ad-CD154–transduced CLL cells.
(A) Complete blood count and manual differential were performed at the indicated time points from the day of infusion of Ad-CD154 CLL cells (day 0). Absolute lymphocyte counts were calculated and then normalized with respect to the lymphocyte count obtained before leukapheresis. (B) Lymph node area was assessed by nodal palpation in 2 dimensions in right and left cervical, supraclavicular, and axillary regions. The largest lymph node in each of the right and left nodal regions palpated on the day of cell infusion was selected and followed over time. The total lymph node bulk was represented as the sum area of the largest lymph node in each of the right and left nodal regions. The normalized lymph node area represents the sum lymph node area at a particular time as a fraction of sum area on day of infusion (day 0) times 100.
In contrast, the patients of groups 1 to 3 had significant reductions in blood lymphocyte counts (Figure 5A). The blood lymphocyte counts of 2 of the 3 patients in group 1 decreased by 68% and 87% from pretreatment values within 48 hours of infusion (Figure 5A). Moreover, these 2 patients had sustained reductions in lymphocyte counts of 66% and 65% within 2 to 4 weeks after treatment (Figure 5A). Similarly, all patients in group 2 experienced reductions in blood lymphocyte counts of more than 30% within 3 days and 54% to 66% within 1 to 2 weeks after receiving the infusion of transduced cells (Figure 5A). Furthermore, all patients in group 3 had reductions in blood lymphocyte counts of 66% to 83% within 2 to 3 days and sustained reductions of 49% to 55% within 2 to 4 weeks after the infusion of transduced cells. All patients of groups 1 and 3 had blood lymphocyte counts after therapy that were below that of pretreatment values. Moreover, in contrast to the patients in the pilot group, the patients in groups 1 to 3 did not show continued progressive increases in their blood lymphocyte counts for 3 months or more after treatment (Figure 5A and data not shown).The patients of groups 1 to 3 also experienced reductions in lymph node size 1 to 4 weeks after receiving a single infusion of autologous Ad-CD154-CLL cells (Figure 5B). All 3 patients in group 1 experienced a 64% to 90% reduction in lymph node size 2 to 4 weeks after therapy. Furthermore, all patients in group 2 experienced a 33% to 85% reduction, and all 3 patients in group 3 experienced 75% to 78% reductions in lymph node size within 1 to 4 weeks following therapy. In most cases, the reductions in lymph node size were sustained for 3 months or more after treatment (Figure 5B and data not shown).
Safety
The treatment was well tolerated with no immediate adverse reactions associated with infusion of Ad-CD154–transduced cells. The 2 patients in the pilot group did not have a discernible clinical response to the infusion. Patients in groups 1 to 3, however, generally developed flulike symptoms (eg, fever, fatigue, arthralgia, myalgia, nausea, and anorexia) by 12 hours after the infusion. Less common adverse reactions included headache, edema, dehydration, and diarrhea (data not shown). After treatment, a few patients developed mild, transient elevations in serum transaminase levels. Some patients had prolongation of prothrombin time, hypoalbuminemia, and/or a 40% or less reduction in platelet counts after treatment (data not shown).
The coagulation abnormalities were not due to disseminated intravascular coagulation, in that no patients developed microangiopathic changes in their circulating red cells or had elevations in the plasma levels of fibrin-split products (data not shown). Rather, the prolongation in prothrombin time could be corrected by a 1:1 mix with control plasma and correlated with an acute, transient reduction in the level of factor VII (data not shown). Moreover, the decreases in platelet counts did not correlate with the administered dose and were transient, lasting less than 1 week.
Both clinical and laboratory abnormalities were transient, were not dose limiting, and resolved within a few days after treatment. None of the treated patients developed immune thrombocytopenia, autoimmune hemolytic anemia, or a positive direct antiglobulin test. We did not identify a dose-limiting toxicity or a maximum tolerated dose in this study.
Discussion
Hematologic malignancies are good candidate diseases for gene therapy in that large quantities of viable neoplastic cells can be readily harvested as single-cell suspensions for gene transfer ex vivo. Optimal methods for gene transfer and direct measurement of transgene expression can be achieved in vitro, allowing for controlled dose-escalation studies in which increasing numbers of transduced, autologous cells can be delivered back to the patient. Nevertheless, to date there have not been any published reports on clinical trials examining the use of gene transfer for the treatment of such diseases.
We developed an immune gene therapy protocol for patients with CLL based on in vitro studies demonstrating that CLL cells transduced with Ad-CD154 became highly proficient at antigen presentation and could induce autologous T-cell responses leading to the generation of CLL-specific CTL.18 In these in vitro studies, CLL cells transduced with an adenovirus vector encoding an irrelevant protein (β-galactosidase) were unable to induce autologous T cells, or even allogeneic T cells, to proliferate or to secrete cytokines in an MLR. We reasoned that autologous CLL cells transduced with Ad-CD154, but not with a control adenovirus vector, could induce host antileukemia immune responses in vivo. This formed the basis for the immune gene therapy protocol described in this report.
Following infusion of autologous Ad-CD154–transduced cells, we observed phenotypic changes on bystander leukemia cells in vivo (Figure1B and Table 2). This effect could not be mimicked by culturing the CLL cells in autologous sera obtained at various times after treatment, but rather resembled the bystander effect observed with Ad-CD154–transduced CLL cells on noninfected CLL B cells in vitro.18 This is despite the fact that the number of resident nontransduced leukemia greatly outnumbered the infused Ad-CD154-CLL B cells by estimated ratios of over 10 000:1. Such phenotypic changes were not restricted to only a subset of leukemia cells but were observed for the entire leukemia cell population. Because cytokines apparently could not effect such phenotypic changes in vitro, it is plausible that bystander leukemia cells are induced to express these surface antigens in secondary lymphoid compartments where there is a greater chance for cognate intercellular interactions to occur. If so, then the induced expression on the bystander leukemia cells seen in this study argues for a dynamic recirculation of leukemia cells between the blood and tissue compartments after treatment.
We also noted high plasma levels of Th1-type cytokines soon after the infusion of Ad-CD154-CLL cells. Indeed, significant levels of IL-12 and IFN-γ were detected in the plasma within hours following cell infusion, peaking at 4 to 8 hours or 24 to 48 hours, respectively (Table 3). It is unlikely that these cytokines were made by the infused cells. IL-12 ordinarily is produced by activated T cells, mononuclear phagocytic cells, and dendritic cells (as reviewed in Gately et al22), but not by Ad-CD154-CLL B cells cultured in vitro (data not shown). Furthermore, we did not observe a dose-response relationship between peak cytokine levels and the relative number of infused Ad-CD154–transduced cells. As such, the cytokines detected in treated patients most likely reflected a host response to the infusion of the Ad-CD154–transduced cells. Of these, IL-12 is a key cytokine in the Th1-response to antigen.22 Biologic effects of IL-12 include enhanced cytotoxic lymphocyte activity in CD8+ T cells and natural killer cells, induction of IFN-γ production by CD4+ Th1 cells, and further differentiation of antigen activated CD4+ and CD8+ T cells.22
In addition, we also noted expansion of both CD4+ and CD8+ T cells in the blood of patients 1 to 3 weeks after therapy. ELISPOT and autologous MLR studies indicated that the infusion of Ad-CD154-CLL cells enhanced the numbers of T cells that produce IFN-γ in response to autologous CLL cells in vitro. These in vitro studies used CD40-activated CLL stimulator cells that were not infected with adenovirus, indicating such increased responses were not against adenovirus-associated antigens. Moreover, we noted W6/32, but not an isotype control mAb, could partially inhibit such responses in vitro (Figures 3 and 4). This mAb recognizes nonpolymorphic determinants of HLA class I antigens and can interfere with the ability of human MHC class I molecules to present peptide antigens. As such, infusion of Ad-CD154-CLL cells apparently increases the number of T cells that can respond to MHC class I–restricted, leukemia-associated antigens.
The acute decreases in leukemia cell counts within 48 hours were unexpected. One possible explanation for the acute fall in circulating leukemia cell numbers includes leukemia cell homing or margination. However, none of the treated patients experienced a decrease in absolute lymphocyte count with signs of tissue infiltration or increases in lymph node size or vice versa. Instead, durable decreases in absolute leukemia cell counts were associated with reductions in lymph node size (Figure 5). As such, the infusion of autologous Ad-CD154 cells apparently resulted in an overall reduction in total tumor burden, even in patients with high leukemia cell counts and advanced disease. We reason that the acute decreases in leukemia cell counts most likely are due to leukemic cell apoptosis, possibly secondary to either alterations in leukemia microenvironment and/or the activity of an innate immune response to the infused cells. In any case, the initial rapid kinetics of the fall in leukemia cell counts indicates that this effect is not mediated by a primaryleukemia-specific T-cell response.
However, it is still possible that the rapid kinetics of leukemia cell clearance is secondary to the effects of a “recall” secondary immune response to the modified leukemia cells. Both the ELISPOT data (Figure 3) and the MLR data (Figure 4) indicate that there are leukemia-reactive T cells present in patients with this disease even before the infusion of the Ad-CD154–transduced cells. Moreover, the ability to induce leukemia-specific CTL after a few days in vitro is consistent with the notion that patients already are primed for a CTL response against target cells that express leukemia-associated antigens.18 This implies that activation of such a recall immune response can occur within the time period when the early reductions in leukemia cells counts are observed, thereby potentially contributing to leukemia cell clearance noted within the first few days after treatment. However, further studies are required to test this hypothesis.
Although there did not appear to be clear dose-response relationships between the patients of groups 1 to 3, there may be a threshold below which there is no discernible immunologic or clinical activity. Even though patients in group 1 received 10-fold fewer cells than those in group 3, patients in both groups had sustained reductions in blood lymphocyte counts and did not show signs of disease progression after therapy. On the other hand, the patients in the pilot group, who received cells expressing low levels of the CD154 transgene, did not experience a significant decline in blood lymphocyte counts or change in the disease progression after treatment. Furthermore, the peak plasma levels of cytokines, such as IL-12 or IFN-γ, did not correlate with the dose of administered cells. Instead, nonparametric analysis revealed a relationship between the peak plasma cytokine levels and the absolute total T-cell counts at the time of treatment. This relationship correlated more significantly with absolute CD4+ T-cell counts than with absolute CD8+T-cell counts. As such, the blood levels of CD4+ T cells at the time of therapy may have a significant impact on subsequent immunologic and clinical responses. Therefore, the magnitude of the biologic activity may depend more on a patient's immune status at the time of treatment than on the relative number of infused cells, provided that a certain threshold dose is achieved. Accordingly, this form of treatment may have an even greater effect on patients who have a fully functional immune system and/or early onset or minimal residual disease.
Patients with CLL are at high risk for spontaneously developing autoimmune hemolytic anemia or immune thrombocytopenic purpura.23-25 One model proposes that aberrant expression of CD154 may be responsible for such autoimmunity in patients with CLL.26 An alternative model proposes that such autoimmunity may reflect immune dysregulation caused by an acquired deficiency of CD154 activity.27 In this regard, it is noteworthy that patients with congenital lack of CD154 also are at increased risk for developing autoimmune hemolytic anemia and immune thrombocytopenic purpura despite having a profound immune deficiency.28 In any case, none of the treated patients developed any signs of such autoimmunity despite receiving relatively large numbers of cells expressing CD154.
Actually, the infusion of autologous Ad-CD154-CLL cells expressing high levels of the CD154 transgene was well tolerated. Some patients experienced laboratory abnormalities, such as elevation in hepatic transaminase levels, reduction in platelet counts, or prolongation of prothrombin times. These abnormalities were grade 2 or less in magnitude and of limited duration. The clinical adverse reactions primarily consisted of flulike symptoms that developed 6 to 8 hours after infusion and lasted a few days. These clinical adverse reactions most likely were secondary to the release of endogenous cytokines, such as IFN-γ and IL-12. These cytokines can induce flulike symptoms and some of the observed laboratory toxicities when administered to patients.29
Because significant increases in T-cell numbers were observed following a single dose of Ad-CD154–transduced cells, a greater and more durable response is hypothesized to occur with repeat dosing. As discussed, pretreatment T-cell counts may have an impact on the initial response to treatment. Even patient 005, who had been pretreated with multiple cycles of chemotherapy and had very low pretreatment T-cell numbers, experienced an increase in the absolute numbers of CD4+ T cells after treatment (Table 4). Conceivably, subsequent infusions of autologous Ad-CD154-CLL cells when the T-cell counts are increased could induce more significant immunologic and clinical effects. As such, dosing schedule, rather than amount of cells per dose, may prove to be the critical factor for developing this into an effective and potentially curative gene therapy strategy for patients with CLL.
Supported in part by National Institutes of Health grant M01 RR00827, PO1 CA81534, R37 CA49870 (T.J.K.), and the California Division-American Cancer Society, Fellowship #4-22-98 (W.G.W).
The publication costs of this article were defrayed in part by page charge payment. Therefore, and solely to indicate this fact, this article is hereby marked “advertisement” in accordance with 18 U.S.C. section 1734.
References
Author notes
Thomas J. Kipps, Division of Hematology and Oncology, Department of Medicine, University of California-San Diego, 9500 Gilman Dr, La Jolla, CA 92093-0663; e-mail: tkipps@ucsd.edu.

